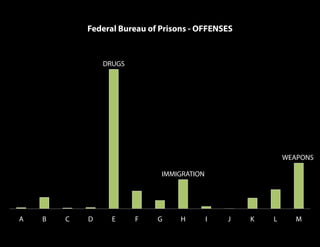
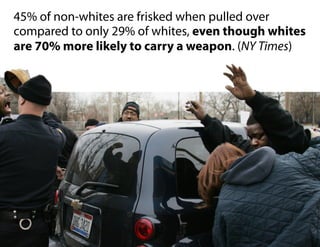
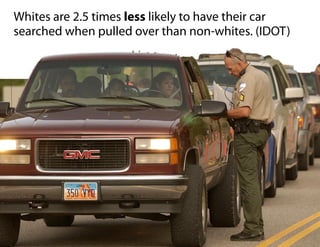
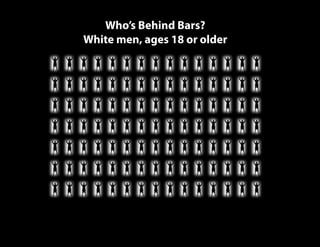
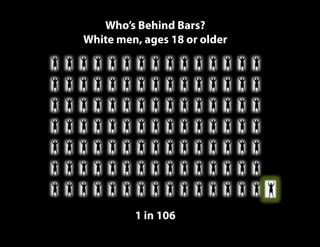
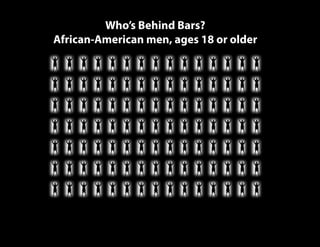
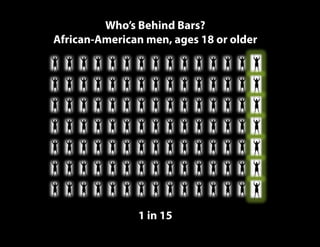
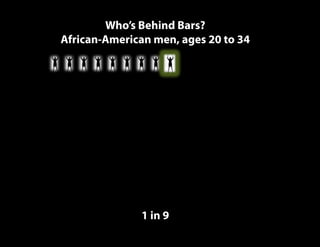
762
531
323
153
119
63 58
USA Cuba Ukraine England China Japan Syria
Prisoners per 100,000 citizens
1970 - 2000
759
7965
457 825
98,082
12,423
5785
20,483
1545 80
7477
13,427
32,088
A B C D E F G H I J K L M
Federal Bureau of Prisons - OFFENSES
DRUGS
IMMIGRATION
WEAPONS
A B C D E F G H I J K L M
Federal Bureau of Prisons - OFFENSES
Opportunity costs
Who’s the target?
What’s the “low-hanging fruit”?
45% of non-whites are frisked when pulled over
compared to only 29% of whites, even though whites
are 70% more likely to carry a weapon. (NY Times)
Whites are 2.5 times less likely to have their car
searched when pulled over than non-whites. (IDOT)
Who’s Behind Bars?
White men, ages 18 or older
Who’s Behind Bars?
White men, ages 18 or older
1 in 106
Who’s Behind Bars?
African-American men, ages 18 or older
Who’s Behind Bars?
African-American men, ages 18 or older
1 in 15
Who’s Behind Bars?
African-American men, ages 20 to 34
Who’s Behind Bars?
African-American men, ages 20 to 34
1 in 9
The New Jim Crow - statistical evidence

The New Jim Crow - statistical evidence