SlideShare a Scribd company logo
1 of 5
Download to read offline
CASE
1Implement Consulting Group
As one of the world’s largest dairy
companies, Arla Foods has been directly
influenced by this development. Not least
because the company, as a ­co-operative
owned by the milk ­producing farmers,
is obliged to take in all the milk they
produce.
Add to this the limited durability of milk
combined with an extremely fluctuating
market and increased pressure from still
larger and more global customers, and
you have a challenging situation. But
also a situation with significant benefits
­associated with creating a global over-
view of demand and supply in order to
balance the further processing of milk
in the best possible way. For a company
like Arla, having experienced a tremen-
dous growth up through the 00’s and
early 10’s, this task is easier said than
done. New markets, new suppliers and
production facilities all across the world
had stretched the old country and mar-
ket-based operating model to its limits.
The growth, primarily through mergers
with other dairies, had given Arla the
milk and the markets they had set out
for, but also a scattered IT landscape and
multiple ways of doing things across the
global company.
ONE Arla through a global
over­view of demand and
capacity
Thomas Carstensen, Senior Vice
President Milk and Trading says: “In Arla’s
2017 strategy plan, our top management
provided us with a very clear mandate,
which was to develop and implement
world-class trading and milk allocation
within a period of four years”. That was
in late 2013, and today, not even three
years later, Thomas Carstensen and his
team can conclude that the results so far
are promising to an extent where Arla’s
CEO, Peder Tuborgh, refers to the new
Sales & Operations Planning (S&OP)
process as “the pulse of Arla”.
From a supply-driven to
a demand-driven process
When Arla introduced S&OP, it was
important to change the entire mindset
of the organisation from one where
the markets, roughly said, fended for
themselves, and the core markets’
­supply chains were focused on supply-
ing the market that “owned” them. To
handle the increased milk inflow, which
was ­expected after the milk quota
After more than 30 years of existence, the EU milk quota system
was scrapped in early 2015, resulting in a substantial increase in
the amount of milk produced by European farmers. This again has
had several consequences, the most obvious being a significant
drop in the milk prices, putting many European milk farmers
under pressure.
Creating global transparency
with ONE planning and allocation
ARLA
2Implement Consulting Group
Arla – One planning and allocation
­abolishment, and to serve the ­customers
who were growing more global, the
top management foresaw a need for
the markets and supply chains to work
together as one in a more uniform and
structured way.
Hence, they ordered a global monthly
tactical decision process named Arla
Sales & Operations Planning and an
underlying standard SAP APO IT land-
scape that could decommission the
many legacy systems to be developed
and rolled out. The program ONE
Planning & Allocation was set in motion.
“With a background in sales, my primary
role has been to negotiate the change
process, getting to one harmonised
S&OP business process and organising
the programme. Doing it in a way that
supported the various functions and also
finding compromises on standardised
SAP APO templates. It has truly been
a team effort with Arla staff wanting to
succeed as one, and external consultants
understanding the need to show value
early on”, says Jakob Lignell, Director,
Global S&OP and head of the program
ONE Planning & Allocation.
In order to make the transition, it was
necessary to introduce a process that
could produce a reliable demand fore-
cast on the one hand and a viable plan
for meeting that demand on the other
on a global scale. The process defined by
Arla starts with Sales delivering quality
and commitment for the volume fore-
casting at the demand review meetings
(DRM) headed by head of sales in all
markets. The new global demand plan-
ning template plays a key role in getting
valid global transparency on demand.
The DRM is followed by gap-closing
activities at the business planning meet-
ings in the markets’ leadership teams and
in the two overlaying commercial zones
that have been created in the new “Good
growth 2020” strategy. An organisational
change that also gave Arla a supply
chain divided into two main functional
areas. Providing a clear line of sight from
the 2017 strategy programme mandate
and, hence, supporting the end goal of
one S&OP process, one standard IT land-
scape and one set of numbers.
All plants then look at the demands at
local plant review meetings (PRM) and
give input to the two supply review
meetings (SRM). This is done in a
­standard format guided by the new
SAP APO master production planning
template.
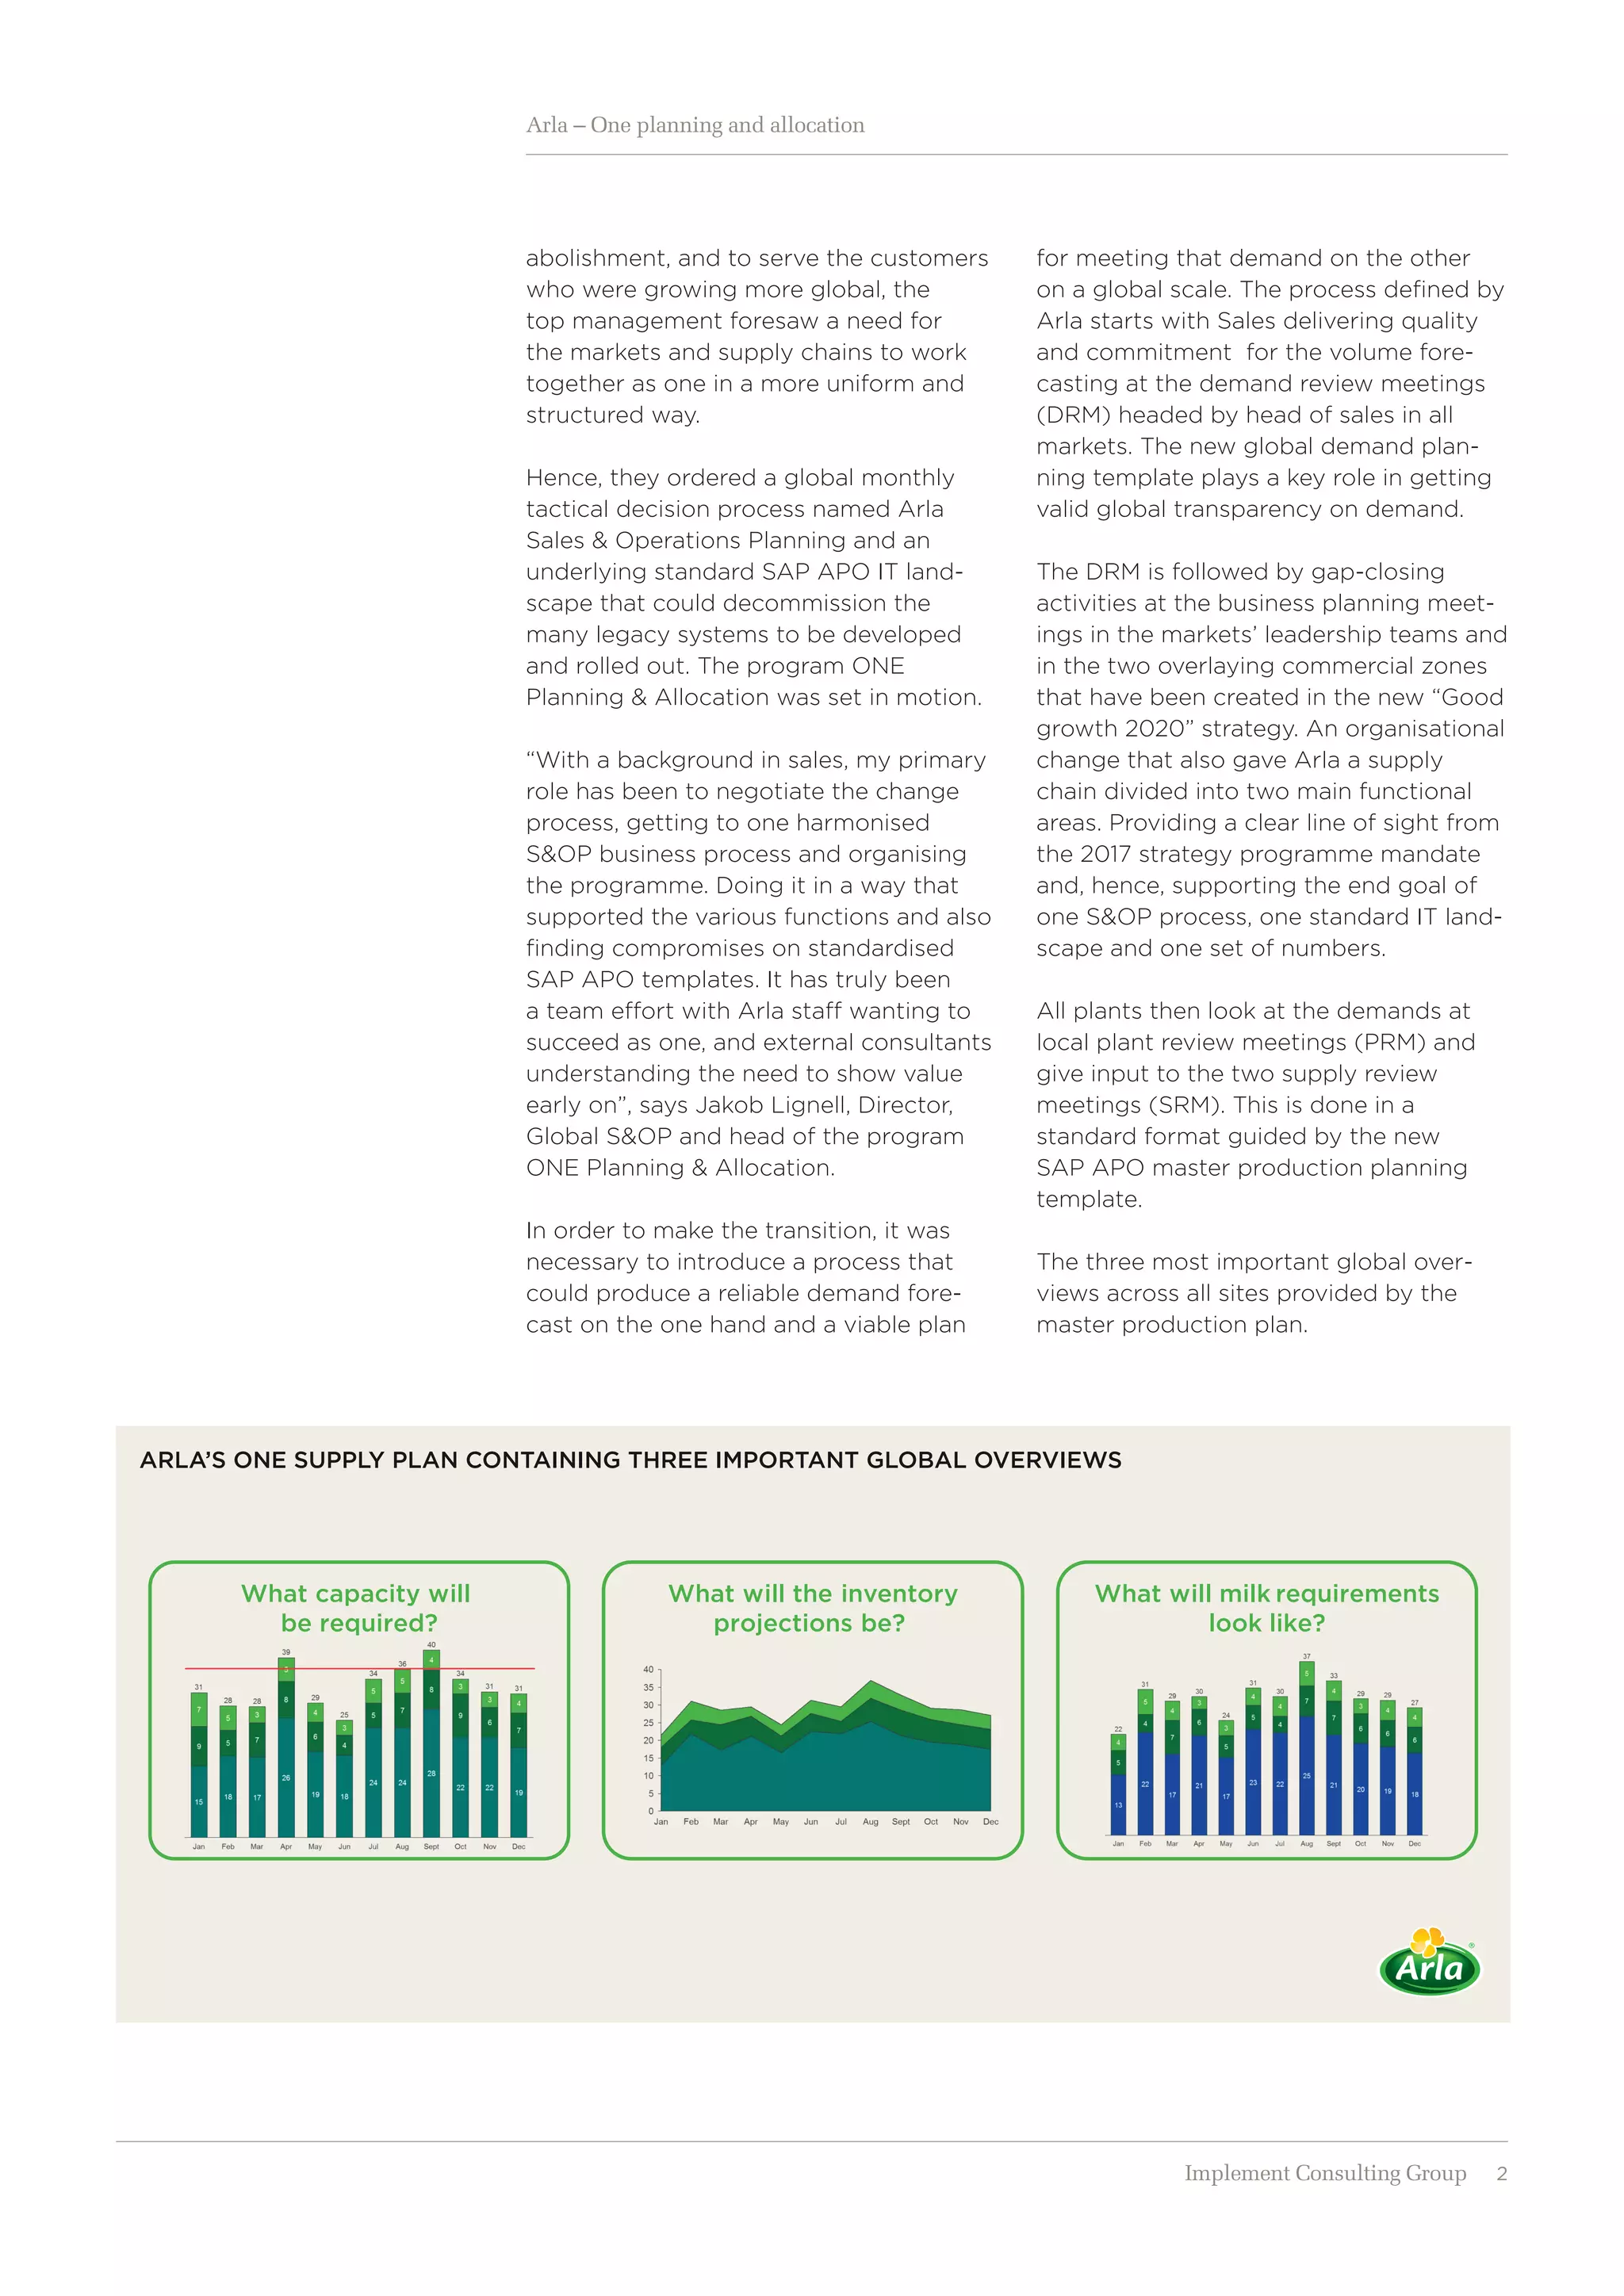
The three most important global over-
views across all sites provided by the
master production plan.
ARLA’S ONE SUPPLY PLAN CONTAINING THREE IMPORTANT GLOBAL OVERVIEWS
What capacity will
be required?
What will the inventory
projections be?
What will milk requirements
look like?
3Implement Consulting Group
Arla – One planning and allocation
The process ends with a large meeting
with all heads of sales, supply chain,
planning, product management and
category supported by finance, being
briefed on hard numbers and deciding
on corrective actions to take on tactical
issues for the coming 1-15 months. Also,
setting the guiding operational principles
for Arla.
“The global executive S&OP meeting
is a bit like the tale of the bumblebee
that should not be able to fly. Too many
issues, too many people and too little
time is often what we hear from new
people being introduced to the concept.
But the fact-based format supported by
our IT standardisation efforts and the
structured process leading up to the
meeting underlined with sheer decision
power and teamwork across the com-
pany makes it work to an outstanding
degree”, says Thomas Carstensen.
“Overall, and this goes for both
the business process as well as for
the ­programme as such, we have
­implemented a mindset saying that
silence is ­acceptance. We provide the
necessary information on the right level
of detail and to a forum for people to
voice their opinion. That said, we are
always tender-hearted on the people,
but tough-minded on the issue”, says
Jakob Lignell.
Designing an S&OP process
and IT-enabling systems is all
about people and governance
Arla set out to get the basic business
process aligned and started up before
embarking on the IT part of the pro-
gramme. This made it easier to align on
IT requirements, but it also enabled Arla
to harvest many IT and ­business benefits
as early as possible in the programme.
When asked, Jakob Lignell points out the
actual management of the programme
as one of the deciding factors for the
success: “Right from the beginning, it
was important for us to create results
early in the projects and on an ongoing
basis. We were inspired by an initiative
from The Danish Industry Foundation
called “Project Half Double” where the
aim is to create results in half the time
with double the impact”, he says.
This approach had several conse-
quences for the way that the project
was ­managed. One was the decision
not to wait for 100% solutions, but to
be pragmatic and learn from practical
experience in smaller and more flexible
loops. Another was to do away with
the well-established routine of rolling
out solutions one market at a time and
change to a roll-out by product group.
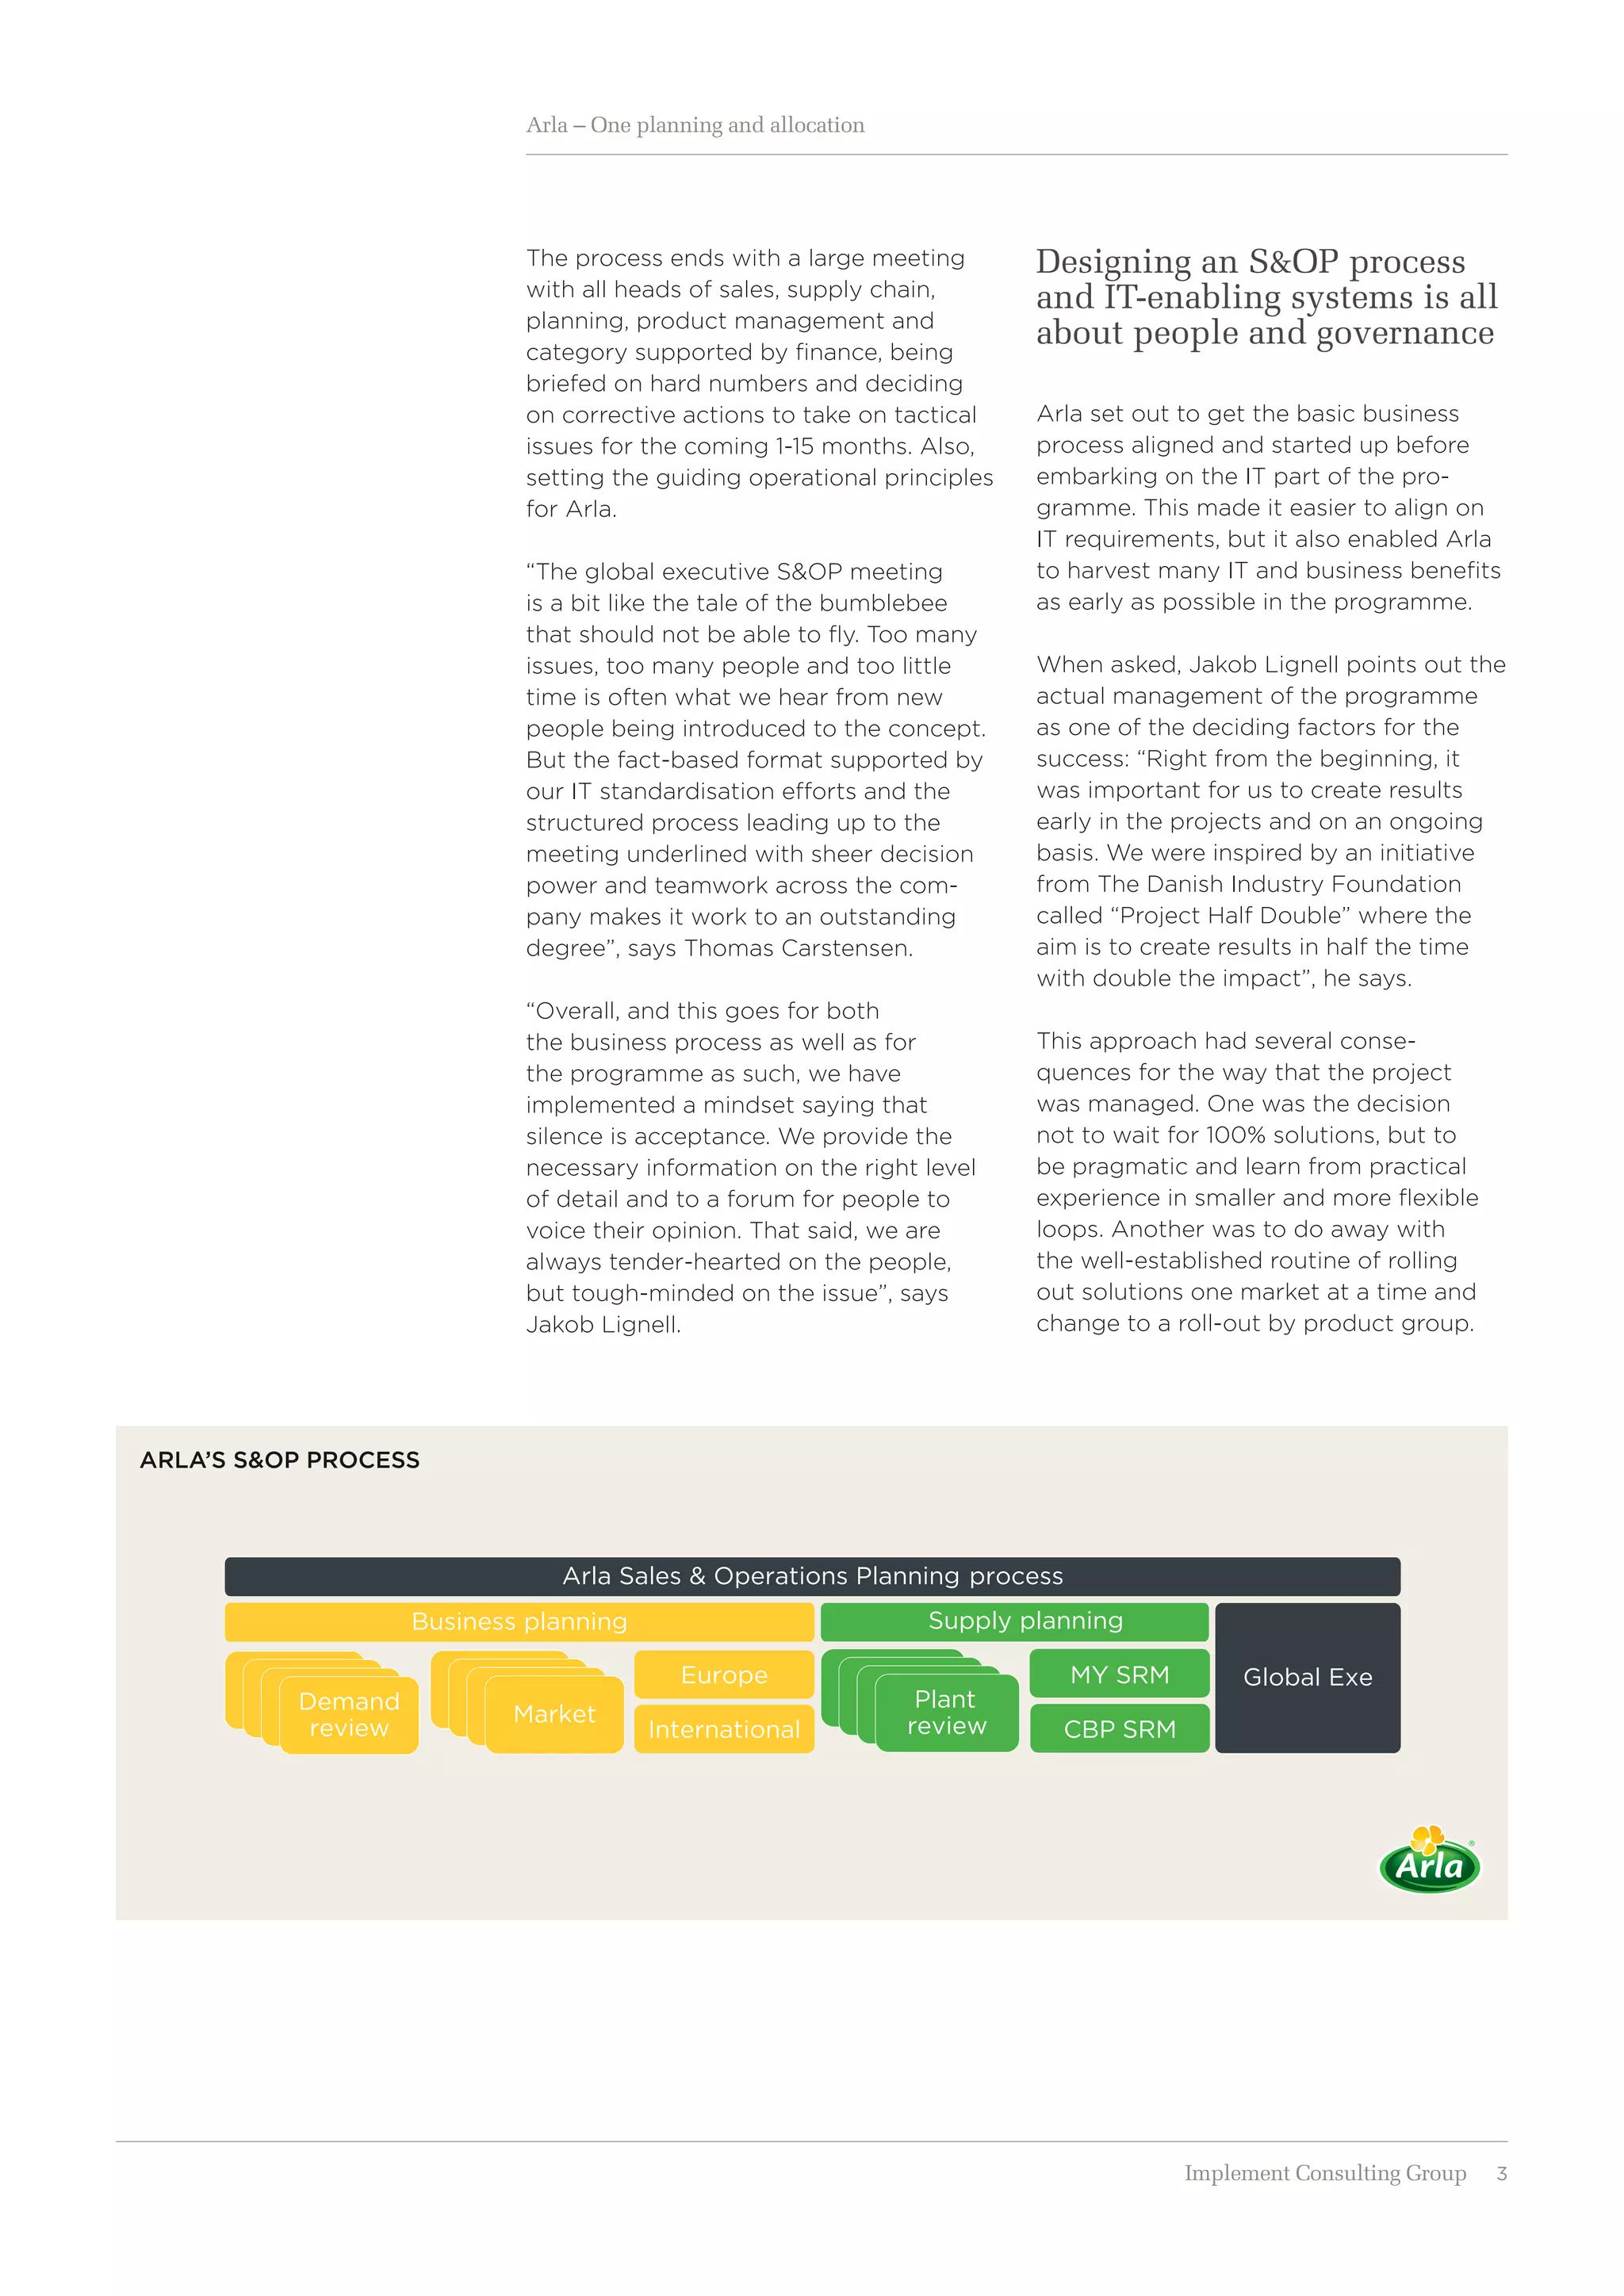
ARLA’S S&OP PROCESS
DRM
MY SRM Global Exe
Business planning Supply planning
Europe
CBP SRMInternational
DRMDRMDemand
review
DRMDRMDRMMarket
DRMDRMDRMPlant
review
Arla Sales & Operations Planning process
4Implement Consulting Group
Arla – One planning and allocation
By doing so, the project team is able
to introduce global overviews on for
example capacity early in the project as
opposed to waiting until all markets and
their product groups are aligned.
“A crucial point was also to have clear
line-of-sight governance that insured a
high level of involvement of ­stakeholders
in sequenced forums through the
­different levels in the organisation,
anchored with an executive management
steering committee. All forums having
clear role descriptions and mandates to
agree on a common way of working or
standard APO template design features
and accepting the escalation points if
consensus could not be reached at a
certain level. This, combined with a very
active business ownership approach and
a dynamic IT organisation, has insured
that the programme has stayed on time
and budget throughout its course” Says
Senior Vice President Torben Fabrin,
Arla IT.
Measuring impact
The overall impact case was built around
our S&OP KPIs that were defined in the
early days of the programme. Forecast
accuracy being the key measure to
track improvement. In this simple way,
we have been able to track a significant
improvement of the overall performance,
delivering well above expectation already
18 months before the programme is set
to end. A big part of this improvement is
derived from the business process and
the training in the SAP APO demand
planning template, but “the biggest
­surprise for me was that we only saw
a very minor drop in forecast ­accuracy
after first-user go-live of our new demand
template and a learning curve taking us
above par already after one month,” says
Jakob Lignell.
More tangible benefits for the business,
and what has proven to be the true
value for Arla, is the global transparency
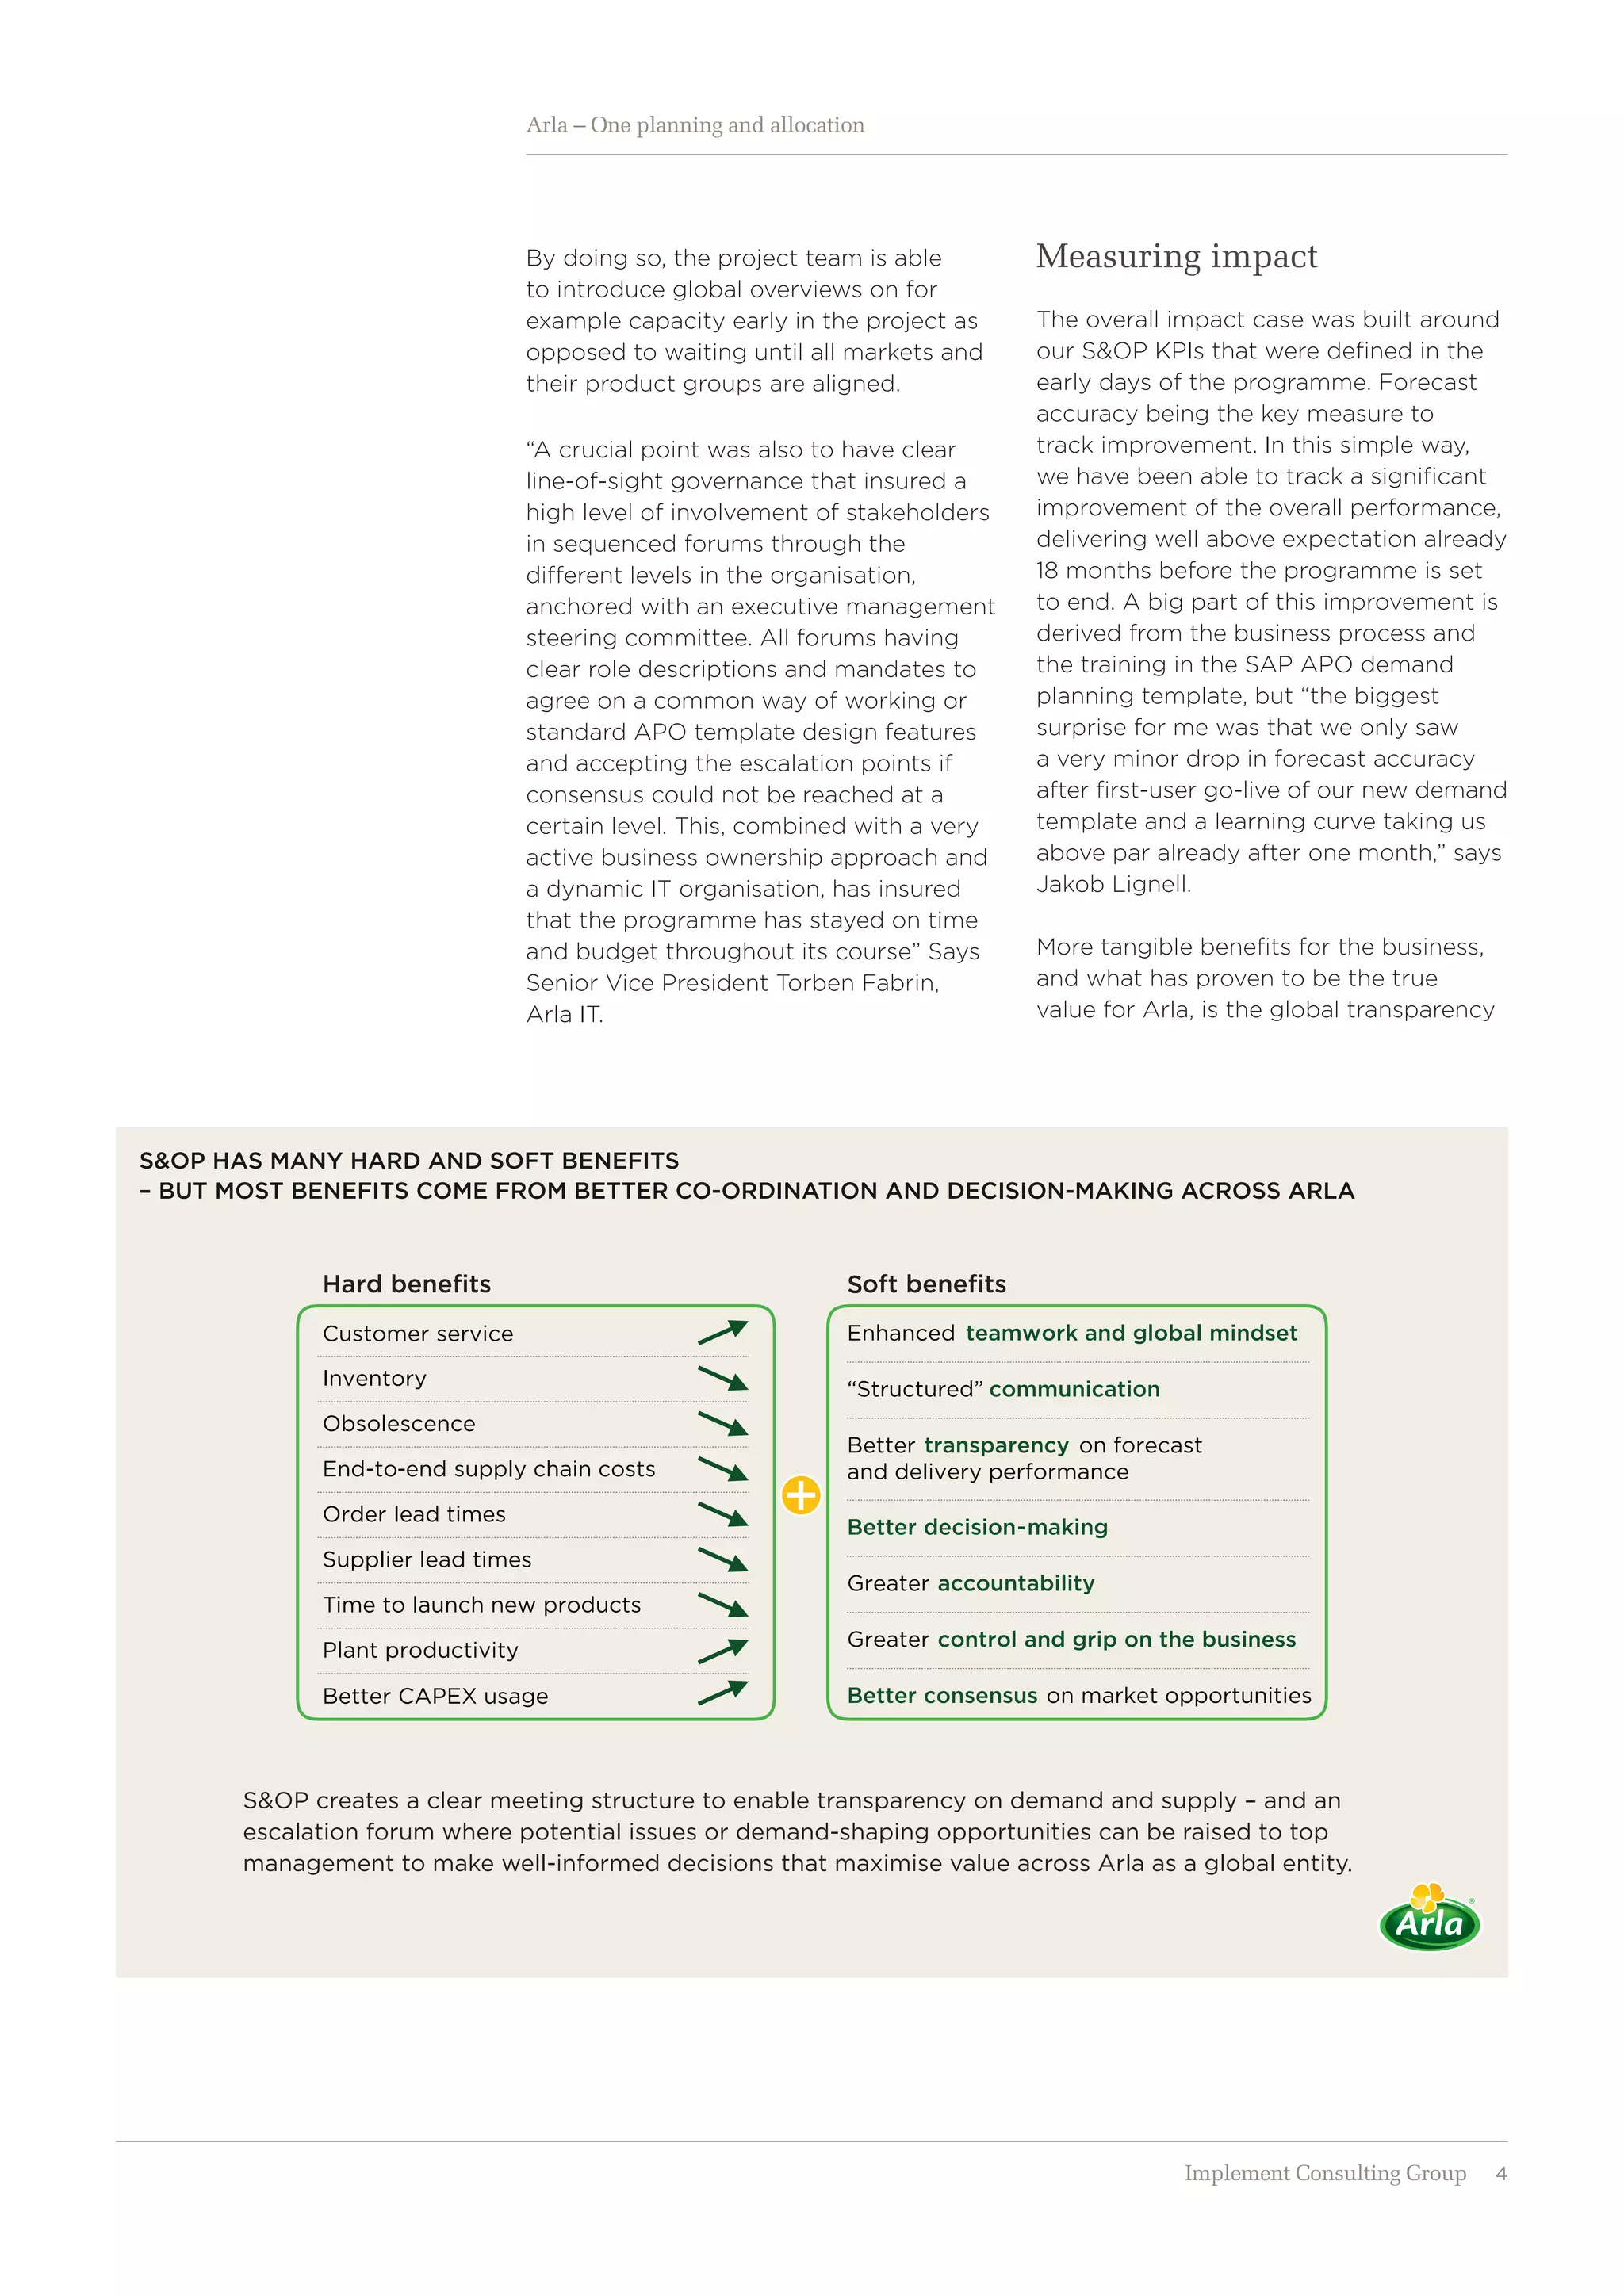
S&OP HAS MANY HARD AND SOFT BENEFITS
– BUT MOST BENEFITS COME FROM BETTER CO-ORDINATION AND DECISION-MAKING ACROSS ARLA
SHard benefits
Customer service
Inventory
Obsolescence
End-to-end supply chain costs
Order lead times
Supplier lead times
Time to launch new products
Plant productivity
Better CAPEX usage
oft benefits
Greater control and grip on the business
Greater accountability
Better decision-making
“Structured” communication
Enhanced teamwork and global mindset
Better transparency on forecast
and delivery performance
Better consensus on market opportunities
S&OP creates a clear meeting structure to enable transparency on demand and supply – and an
escalation forum where potential issues or demand-shaping opportunities can be raised to top
management to make well-informed decisions that maximise value across Arla as a global entity.
5Implement Consulting Group
Arla – One planning and allocation
Contact
Søren Skjødt, sos@implement.dk, +45 5138 7402
creating alignment and decisions that are
cascaded throughout the organisation in
an increasingly seamless way. Making our
top management eager to take part in
the different steps in the S&OP process.
Issues like clear market prioritisation
when in lack of products or raw material
is a constant theme. An example could
be a temporal lack of organic milk that
has become very sought after by the
consumers: “A topic like this is close to
heart for all markets and will give a lively
debate, and it is vital that we can trust
the numbers supplied at the meetings”,
says Jakob Lignell.
Other examples are the clear guiding
principles that are formed via case-
based decisions that are actively lifted
to ­principal guidelines helping steer the
company with less friction.
Demand shaping built on optimal overall
profitability is also a recurring event at
the meetings as well as movement of
production between plants and gap-
closing activities built on top of the
­realistic demand plans supplied by the
SAP APO demand planning template.
The examples above are just a few
among several others that underline the
impact created by the One Planning and
Allocation programme.
Overall, the process also supports hard
benefits such as better customer service,
reduced inventory and lead times, higher
productivity and better CAPEX usage.
The benefits acquired also include more
intangible ones like better decision-­
making, enhanced teamwork, a more
global mindset, better transparency,
structured communication in a common
language and much better consensus on
market decisions.
Learnings
For Jakob Lignell and his team, and
not least for Arla, the One Planning
and Allocation programme has been
a ­success. This is, of course, basically
a direct result of a tremendous effort,
change readiness and willingness to
­contribute of all involved parties in
Arla. But if we take a deep dive into
the underlying factors, it is possible to
­pinpoint the vital few success ­factors
that other companies and project
­managers facing a similar challenge
may benefit from:
•	 	Focus on impact early in the project
•	 	Create an environment of trust
between IT and the business
•	 	Be ambitious regarding the vision
and the end goal of the project
•	 	Be pragmatic and flexible in the
process – rather go for the 20% that
are used than waiting for the entire
solution to be finished
•	 	Don’t be afraid to present solutions
that are not 100% perfect and learn
as you go along
•	 	Remember that while plans and
systems are important, it is all about
people in the end. So be tender-
hearted on the people and tough-
minded on the issue

More Related Content

What's hot

Roadshow Presentation Full-Year Results 2014/15
Roadshow Presentation Full-Year Results 2014/15Roadshow Presentation Full-Year Results 2014/15
Roadshow Presentation Full-Year Results 2014/15Barry Callebaut
 
Roadshow Presentation Q1 FY 2015/16
Roadshow Presentation Q1 FY 2015/16Roadshow Presentation Q1 FY 2015/16
Roadshow Presentation Q1 FY 2015/16Barry Callebaut
 
Roberto Cerqueira do Val CV English version
Roberto Cerqueira do Val CV English versionRoberto Cerqueira do Val CV English version
Roberto Cerqueira do Val CV English versionRoberto Cerqueira do Val
 
Roadshow Presentation Barry Callebaut's 9-month / Q3 Results
Roadshow Presentation Barry Callebaut's 9-month / Q3 ResultsRoadshow Presentation Barry Callebaut's 9-month / Q3 Results
Roadshow Presentation Barry Callebaut's 9-month / Q3 ResultsBarry Callebaut
 
Investor Presentation June 27th 2016
Investor Presentation June 27th 2016Investor Presentation June 27th 2016
Investor Presentation June 27th 2016Robin Kim
 
Resume / Full Biography - Jay Martin
Resume / Full Biography - Jay MartinResume / Full Biography - Jay Martin
Resume / Full Biography - Jay MartinChief Innovation
 
Corporate Performance Transparency Sep2015
Corporate Performance  Transparency Sep2015Corporate Performance  Transparency Sep2015
Corporate Performance Transparency Sep2015Felipe Florez-Arango
 
The Barry Callebaut Group: Full-Year Results 2013/14 - Roadshow Presentation
The Barry Callebaut Group: Full-Year Results 2013/14 - Roadshow PresentationThe Barry Callebaut Group: Full-Year Results 2013/14 - Roadshow Presentation
The Barry Callebaut Group: Full-Year Results 2013/14 - Roadshow PresentationBarry Callebaut
 
Knowledge management
Knowledge managementKnowledge management
Knowledge managementShikha Pathak
 
Proctor & Gamble 2008 AnnualReport
Proctor & Gamble 2008 AnnualReportProctor & Gamble 2008 AnnualReport
Proctor & Gamble 2008 AnnualReportearningsreport
 
Presentation with Jim Prescott of Sonoco Products on S&OP at CSCMP in San Ant...
Presentation with Jim Prescott of Sonoco Products on S&OP at CSCMP in San Ant...Presentation with Jim Prescott of Sonoco Products on S&OP at CSCMP in San Ant...
Presentation with Jim Prescott of Sonoco Products on S&OP at CSCMP in San Ant...Lora Cecere
 
Stepan Overview – SAP Ariba Network Live
Stepan Overview – SAP Ariba Network LiveStepan Overview – SAP Ariba Network Live
Stepan Overview – SAP Ariba Network Live SAP Ariba
 
Barry Callebaut - Half-Year Results Fiscal Year 2016/17
Barry Callebaut - Half-Year Results Fiscal Year 2016/17Barry Callebaut - Half-Year Results Fiscal Year 2016/17
Barry Callebaut - Half-Year Results Fiscal Year 2016/17Barry Callebaut
 
Herdez_CasodeExito_Sourcing_Vivo
Herdez_CasodeExito_Sourcing_VivoHerdez_CasodeExito_Sourcing_Vivo
Herdez_CasodeExito_Sourcing_VivoDaniel W Hodgsdon A
 
SAP Business One with ProcessForce - BeOne Solution
SAP Business One with ProcessForce - BeOne SolutionSAP Business One with ProcessForce - BeOne Solution
SAP Business One with ProcessForce - BeOne SolutionBeOne Solution
 
Full-Year Results Fiscal Year 2014/15 of the Barry Callebaut Group - Media Co...
Full-Year Results Fiscal Year 2014/15 of the Barry Callebaut Group - Media Co...Full-Year Results Fiscal Year 2014/15 of the Barry Callebaut Group - Media Co...
Full-Year Results Fiscal Year 2014/15 of the Barry Callebaut Group - Media Co...Barry Callebaut
 
The Industrial Equipment & Machinery industry: challenges and opportunities
The Industrial Equipment & Machinery industry: challenges and opportunitiesThe Industrial Equipment & Machinery industry: challenges and opportunities
The Industrial Equipment & Machinery industry: challenges and opportunitiesHederaslides
 

What's hot (19)

Chief Innovation
Chief InnovationChief Innovation
Chief Innovation
 
Roadshow Presentation Full-Year Results 2014/15
Roadshow Presentation Full-Year Results 2014/15Roadshow Presentation Full-Year Results 2014/15
Roadshow Presentation Full-Year Results 2014/15
 
Roadshow Presentation Q1 FY 2015/16
Roadshow Presentation Q1 FY 2015/16Roadshow Presentation Q1 FY 2015/16
Roadshow Presentation Q1 FY 2015/16
 
Roberto Cerqueira do Val CV English version
Roberto Cerqueira do Val CV English versionRoberto Cerqueira do Val CV English version
Roberto Cerqueira do Val CV English version
 
Roadshow Presentation Barry Callebaut's 9-month / Q3 Results
Roadshow Presentation Barry Callebaut's 9-month / Q3 ResultsRoadshow Presentation Barry Callebaut's 9-month / Q3 Results
Roadshow Presentation Barry Callebaut's 9-month / Q3 Results
 
Investor Presentation June 27th 2016
Investor Presentation June 27th 2016Investor Presentation June 27th 2016
Investor Presentation June 27th 2016
 
Resume / Full Biography - Jay Martin
Resume / Full Biography - Jay MartinResume / Full Biography - Jay Martin
Resume / Full Biography - Jay Martin
 
Corporate Performance Transparency Sep2015
Corporate Performance  Transparency Sep2015Corporate Performance  Transparency Sep2015
Corporate Performance Transparency Sep2015
 
The Barry Callebaut Group: Full-Year Results 2013/14 - Roadshow Presentation
The Barry Callebaut Group: Full-Year Results 2013/14 - Roadshow PresentationThe Barry Callebaut Group: Full-Year Results 2013/14 - Roadshow Presentation
The Barry Callebaut Group: Full-Year Results 2013/14 - Roadshow Presentation
 
Knowledge management
Knowledge managementKnowledge management
Knowledge management
 
Henkel annual report
Henkel annual reportHenkel annual report
Henkel annual report
 
Proctor & Gamble 2008 AnnualReport
Proctor & Gamble 2008 AnnualReportProctor & Gamble 2008 AnnualReport
Proctor & Gamble 2008 AnnualReport
 
Presentation with Jim Prescott of Sonoco Products on S&OP at CSCMP in San Ant...
Presentation with Jim Prescott of Sonoco Products on S&OP at CSCMP in San Ant...Presentation with Jim Prescott of Sonoco Products on S&OP at CSCMP in San Ant...
Presentation with Jim Prescott of Sonoco Products on S&OP at CSCMP in San Ant...
 
Stepan Overview – SAP Ariba Network Live
Stepan Overview – SAP Ariba Network LiveStepan Overview – SAP Ariba Network Live
Stepan Overview – SAP Ariba Network Live
 
Barry Callebaut - Half-Year Results Fiscal Year 2016/17
Barry Callebaut - Half-Year Results Fiscal Year 2016/17Barry Callebaut - Half-Year Results Fiscal Year 2016/17
Barry Callebaut - Half-Year Results Fiscal Year 2016/17
 
Herdez_CasodeExito_Sourcing_Vivo
Herdez_CasodeExito_Sourcing_VivoHerdez_CasodeExito_Sourcing_Vivo
Herdez_CasodeExito_Sourcing_Vivo
 
SAP Business One with ProcessForce - BeOne Solution
SAP Business One with ProcessForce - BeOne SolutionSAP Business One with ProcessForce - BeOne Solution
SAP Business One with ProcessForce - BeOne Solution
 
Full-Year Results Fiscal Year 2014/15 of the Barry Callebaut Group - Media Co...
Full-Year Results Fiscal Year 2014/15 of the Barry Callebaut Group - Media Co...Full-Year Results Fiscal Year 2014/15 of the Barry Callebaut Group - Media Co...
Full-Year Results Fiscal Year 2014/15 of the Barry Callebaut Group - Media Co...
 
The Industrial Equipment & Machinery industry: challenges and opportunities
The Industrial Equipment & Machinery industry: challenges and opportunitiesThe Industrial Equipment & Machinery industry: challenges and opportunities
The Industrial Equipment & Machinery industry: challenges and opportunities
 

Similar to The making of Arla tactical decision process (S&OP)

The Anaplan planning cloud is for Sales, Finance, and Operations.
The Anaplan planning cloud is for Sales, Finance, and Operations.The Anaplan planning cloud is for Sales, Finance, and Operations.
The Anaplan planning cloud is for Sales, Finance, and Operations.Intellium
 
Next Generation S&OP
Next Generation S&OPNext Generation S&OP
Next Generation S&OPPeter Murray
 
how_british_american_tobacco_294357
how_british_american_tobacco_294357how_british_american_tobacco_294357
how_british_american_tobacco_294357Jorge Escobar
 
ATOSS Software AG Annual Report 2013
ATOSS Software AG Annual Report 2013ATOSS Software AG Annual Report 2013
ATOSS Software AG Annual Report 2013ATOSS Software AG
 
Productivity Through Process Improvement
Productivity Through Process ImprovementProductivity Through Process Improvement
Productivity Through Process ImprovementGeoffrey Knowles
 
Sales and Operations Planning at Newell Rubbermaid
Sales and Operations Planning at Newell RubbermaidSales and Operations Planning at Newell Rubbermaid
Sales and Operations Planning at Newell Rubbermaidadownard
 
Sage Process Manufacturing - Worldwide Customer Insights
Sage Process Manufacturing - Worldwide Customer InsightsSage Process Manufacturing - Worldwide Customer Insights
Sage Process Manufacturing - Worldwide Customer InsightsBurCom Consulting Ltd.
 
IBM_BAT (TaO) Case Study.PDF
IBM_BAT (TaO) Case Study.PDFIBM_BAT (TaO) Case Study.PDF
IBM_BAT (TaO) Case Study.PDFNaushad Mirza
 
Coralie_Bailly-Lean_Manufacturing_any_size_company
Coralie_Bailly-Lean_Manufacturing_any_size_companyCoralie_Bailly-Lean_Manufacturing_any_size_company
Coralie_Bailly-Lean_Manufacturing_any_size_companyCoralie Bailly
 
Mcs balance score card @phillips final
Mcs balance score card @phillips finalMcs balance score card @phillips final
Mcs balance score card @phillips finalFirst Economy
 
Business Guide for Supply Chain Leaders for S&OP in the Pandemic
Business Guide for Supply Chain Leaders for S&OP in the PandemicBusiness Guide for Supply Chain Leaders for S&OP in the Pandemic
Business Guide for Supply Chain Leaders for S&OP in the PandemicLora Cecere
 
IBF conference, 20-22 Amsterdam Nov/2013
IBF conference, 20-22 Amsterdam Nov/2013IBF conference, 20-22 Amsterdam Nov/2013
IBF conference, 20-22 Amsterdam Nov/2013Humberto Galasso
 
Digitizing the Supply Chain, from Planning and Procurement to Execution
Digitizing the Supply Chain, from Planning and Procurement to ExecutionDigitizing the Supply Chain, from Planning and Procurement to Execution
Digitizing the Supply Chain, from Planning and Procurement to ExecutionCognizant
 
Sales and Operations Planning: A Guide for the Supply Chain Leader
Sales and Operations Planning: A Guide for the Supply Chain LeaderSales and Operations Planning: A Guide for the Supply Chain Leader
Sales and Operations Planning: A Guide for the Supply Chain LeaderLora Cecere
 
Steelwedge Integrated Business Planning
Steelwedge Integrated Business PlanningSteelwedge Integrated Business Planning
Steelwedge Integrated Business Planningsteelwedge2000
 
ONE NUMBER – UN PIANO DELLA DOMANDA CONDIVISO E AFFIDABILE GARANTISCE LA SODD...
ONE NUMBER – UN PIANO DELLA DOMANDA CONDIVISO E AFFIDABILE GARANTISCE LA SODD...ONE NUMBER – UN PIANO DELLA DOMANDA CONDIVISO E AFFIDABILE GARANTISCE LA SODD...
ONE NUMBER – UN PIANO DELLA DOMANDA CONDIVISO E AFFIDABILE GARANTISCE LA SODD...Concordia Srl
 
BA401 SAP
BA401 SAPBA401 SAP
BA401 SAPbestham
 

Similar to The making of Arla tactical decision process (S&OP) (20)

The Anaplan planning cloud is for Sales, Finance, and Operations.
The Anaplan planning cloud is for Sales, Finance, and Operations.The Anaplan planning cloud is for Sales, Finance, and Operations.
The Anaplan planning cloud is for Sales, Finance, and Operations.
 
Next Generation S&OP
Next Generation S&OPNext Generation S&OP
Next Generation S&OP
 
how_british_american_tobacco_294357
how_british_american_tobacco_294357how_british_american_tobacco_294357
how_british_american_tobacco_294357
 
Corporate Performance
Corporate Performance Corporate Performance
Corporate Performance
 
ATOSS Software AG Annual Report 2013
ATOSS Software AG Annual Report 2013ATOSS Software AG Annual Report 2013
ATOSS Software AG Annual Report 2013
 
Productivity Through Process Improvement
Productivity Through Process ImprovementProductivity Through Process Improvement
Productivity Through Process Improvement
 
Sales and Operations Planning at Newell Rubbermaid
Sales and Operations Planning at Newell RubbermaidSales and Operations Planning at Newell Rubbermaid
Sales and Operations Planning at Newell Rubbermaid
 
Sage Process Manufacturing - Worldwide Customer Insights
Sage Process Manufacturing - Worldwide Customer InsightsSage Process Manufacturing - Worldwide Customer Insights
Sage Process Manufacturing - Worldwide Customer Insights
 
IBM_BAT (TaO) Case Study.PDF
IBM_BAT (TaO) Case Study.PDFIBM_BAT (TaO) Case Study.PDF
IBM_BAT (TaO) Case Study.PDF
 
Coralie_Bailly-Lean_Manufacturing_any_size_company
Coralie_Bailly-Lean_Manufacturing_any_size_companyCoralie_Bailly-Lean_Manufacturing_any_size_company
Coralie_Bailly-Lean_Manufacturing_any_size_company
 
Mcs balance score card @phillips final
Mcs balance score card @phillips finalMcs balance score card @phillips final
Mcs balance score card @phillips final
 
Business Guide for Supply Chain Leaders for S&OP in the Pandemic
Business Guide for Supply Chain Leaders for S&OP in the PandemicBusiness Guide for Supply Chain Leaders for S&OP in the Pandemic
Business Guide for Supply Chain Leaders for S&OP in the Pandemic
 
IBF conference, 20-22 Amsterdam Nov/2013
IBF conference, 20-22 Amsterdam Nov/2013IBF conference, 20-22 Amsterdam Nov/2013
IBF conference, 20-22 Amsterdam Nov/2013
 
Digitizing the Supply Chain, from Planning and Procurement to Execution
Digitizing the Supply Chain, from Planning and Procurement to ExecutionDigitizing the Supply Chain, from Planning and Procurement to Execution
Digitizing the Supply Chain, from Planning and Procurement to Execution
 
Sales and Operations Planning: A Guide for the Supply Chain Leader
Sales and Operations Planning: A Guide for the Supply Chain LeaderSales and Operations Planning: A Guide for the Supply Chain Leader
Sales and Operations Planning: A Guide for the Supply Chain Leader
 
Steelwedge Integrated Business Planning
Steelwedge Integrated Business PlanningSteelwedge Integrated Business Planning
Steelwedge Integrated Business Planning
 
ONE NUMBER – UN PIANO DELLA DOMANDA CONDIVISO E AFFIDABILE GARANTISCE LA SODD...
ONE NUMBER – UN PIANO DELLA DOMANDA CONDIVISO E AFFIDABILE GARANTISCE LA SODD...ONE NUMBER – UN PIANO DELLA DOMANDA CONDIVISO E AFFIDABILE GARANTISCE LA SODD...
ONE NUMBER – UN PIANO DELLA DOMANDA CONDIVISO E AFFIDABILE GARANTISCE LA SODD...
 
os54-44-47-hackett-group
os54-44-47-hackett-groupos54-44-47-hackett-group
os54-44-47-hackett-group
 
Sem 2 mba winter 2013
Sem 2 mba winter 2013Sem 2 mba winter 2013
Sem 2 mba winter 2013
 
BA401 SAP
BA401 SAPBA401 SAP
BA401 SAP
 

The making of Arla tactical decision process (S&OP)

  • 1. CASE 1Implement Consulting Group As one of the world’s largest dairy companies, Arla Foods has been directly influenced by this development. Not least because the company, as a ­co-operative owned by the milk ­producing farmers, is obliged to take in all the milk they produce. Add to this the limited durability of milk combined with an extremely fluctuating market and increased pressure from still larger and more global customers, and you have a challenging situation. But also a situation with significant benefits ­associated with creating a global over- view of demand and supply in order to balance the further processing of milk in the best possible way. For a company like Arla, having experienced a tremen- dous growth up through the 00’s and early 10’s, this task is easier said than done. New markets, new suppliers and production facilities all across the world had stretched the old country and mar- ket-based operating model to its limits. The growth, primarily through mergers with other dairies, had given Arla the milk and the markets they had set out for, but also a scattered IT landscape and multiple ways of doing things across the global company. ONE Arla through a global over­view of demand and capacity Thomas Carstensen, Senior Vice President Milk and Trading says: “In Arla’s 2017 strategy plan, our top management provided us with a very clear mandate, which was to develop and implement world-class trading and milk allocation within a period of four years”. That was in late 2013, and today, not even three years later, Thomas Carstensen and his team can conclude that the results so far are promising to an extent where Arla’s CEO, Peder Tuborgh, refers to the new Sales & Operations Planning (S&OP) process as “the pulse of Arla”. From a supply-driven to a demand-driven process When Arla introduced S&OP, it was important to change the entire mindset of the organisation from one where the markets, roughly said, fended for themselves, and the core markets’ ­supply chains were focused on supply- ing the market that “owned” them. To handle the increased milk inflow, which was ­expected after the milk quota After more than 30 years of existence, the EU milk quota system was scrapped in early 2015, resulting in a substantial increase in the amount of milk produced by European farmers. This again has had several consequences, the most obvious being a significant drop in the milk prices, putting many European milk farmers under pressure. Creating global transparency with ONE planning and allocation ARLA
  • 2. 2Implement Consulting Group Arla – One planning and allocation ­abolishment, and to serve the ­customers who were growing more global, the top management foresaw a need for the markets and supply chains to work together as one in a more uniform and structured way. Hence, they ordered a global monthly tactical decision process named Arla Sales & Operations Planning and an underlying standard SAP APO IT land- scape that could decommission the many legacy systems to be developed and rolled out. The program ONE Planning & Allocation was set in motion. “With a background in sales, my primary role has been to negotiate the change process, getting to one harmonised S&OP business process and organising the programme. Doing it in a way that supported the various functions and also finding compromises on standardised SAP APO templates. It has truly been a team effort with Arla staff wanting to succeed as one, and external consultants understanding the need to show value early on”, says Jakob Lignell, Director, Global S&OP and head of the program ONE Planning & Allocation. In order to make the transition, it was necessary to introduce a process that could produce a reliable demand fore- cast on the one hand and a viable plan for meeting that demand on the other on a global scale. The process defined by Arla starts with Sales delivering quality and commitment for the volume fore- casting at the demand review meetings (DRM) headed by head of sales in all markets. The new global demand plan- ning template plays a key role in getting valid global transparency on demand. The DRM is followed by gap-closing activities at the business planning meet- ings in the markets’ leadership teams and in the two overlaying commercial zones that have been created in the new “Good growth 2020” strategy. An organisational change that also gave Arla a supply chain divided into two main functional areas. Providing a clear line of sight from the 2017 strategy programme mandate and, hence, supporting the end goal of one S&OP process, one standard IT land- scape and one set of numbers. All plants then look at the demands at local plant review meetings (PRM) and give input to the two supply review meetings (SRM). This is done in a ­standard format guided by the new SAP APO master production planning template. The three most important global over- views across all sites provided by the master production plan. ARLA’S ONE SUPPLY PLAN CONTAINING THREE IMPORTANT GLOBAL OVERVIEWS What capacity will be required? What will the inventory projections be? What will milk requirements look like?
  • 3. 3Implement Consulting Group Arla – One planning and allocation The process ends with a large meeting with all heads of sales, supply chain, planning, product management and category supported by finance, being briefed on hard numbers and deciding on corrective actions to take on tactical issues for the coming 1-15 months. Also, setting the guiding operational principles for Arla. “The global executive S&OP meeting is a bit like the tale of the bumblebee that should not be able to fly. Too many issues, too many people and too little time is often what we hear from new people being introduced to the concept. But the fact-based format supported by our IT standardisation efforts and the structured process leading up to the meeting underlined with sheer decision power and teamwork across the com- pany makes it work to an outstanding degree”, says Thomas Carstensen. “Overall, and this goes for both the business process as well as for the ­programme as such, we have ­implemented a mindset saying that silence is ­acceptance. We provide the necessary information on the right level of detail and to a forum for people to voice their opinion. That said, we are always tender-hearted on the people, but tough-minded on the issue”, says Jakob Lignell. Designing an S&OP process and IT-enabling systems is all about people and governance Arla set out to get the basic business process aligned and started up before embarking on the IT part of the pro- gramme. This made it easier to align on IT requirements, but it also enabled Arla to harvest many IT and ­business benefits as early as possible in the programme. When asked, Jakob Lignell points out the actual management of the programme as one of the deciding factors for the success: “Right from the beginning, it was important for us to create results early in the projects and on an ongoing basis. We were inspired by an initiative from The Danish Industry Foundation called “Project Half Double” where the aim is to create results in half the time with double the impact”, he says. This approach had several conse- quences for the way that the project was ­managed. One was the decision not to wait for 100% solutions, but to be pragmatic and learn from practical experience in smaller and more flexible loops. Another was to do away with the well-established routine of rolling out solutions one market at a time and change to a roll-out by product group. ARLA’S S&OP PROCESS DRM MY SRM Global Exe Business planning Supply planning Europe CBP SRMInternational DRMDRMDemand review DRMDRMDRMMarket DRMDRMDRMPlant review Arla Sales & Operations Planning process
  • 4. 4Implement Consulting Group Arla – One planning and allocation By doing so, the project team is able to introduce global overviews on for example capacity early in the project as opposed to waiting until all markets and their product groups are aligned. “A crucial point was also to have clear line-of-sight governance that insured a high level of involvement of ­stakeholders in sequenced forums through the ­different levels in the organisation, anchored with an executive management steering committee. All forums having clear role descriptions and mandates to agree on a common way of working or standard APO template design features and accepting the escalation points if consensus could not be reached at a certain level. This, combined with a very active business ownership approach and a dynamic IT organisation, has insured that the programme has stayed on time and budget throughout its course” Says Senior Vice President Torben Fabrin, Arla IT. Measuring impact The overall impact case was built around our S&OP KPIs that were defined in the early days of the programme. Forecast accuracy being the key measure to track improvement. In this simple way, we have been able to track a significant improvement of the overall performance, delivering well above expectation already 18 months before the programme is set to end. A big part of this improvement is derived from the business process and the training in the SAP APO demand planning template, but “the biggest ­surprise for me was that we only saw a very minor drop in forecast ­accuracy after first-user go-live of our new demand template and a learning curve taking us above par already after one month,” says Jakob Lignell. More tangible benefits for the business, and what has proven to be the true value for Arla, is the global transparency S&OP HAS MANY HARD AND SOFT BENEFITS – BUT MOST BENEFITS COME FROM BETTER CO-ORDINATION AND DECISION-MAKING ACROSS ARLA SHard benefits Customer service Inventory Obsolescence End-to-end supply chain costs Order lead times Supplier lead times Time to launch new products Plant productivity Better CAPEX usage oft benefits Greater control and grip on the business Greater accountability Better decision-making “Structured” communication Enhanced teamwork and global mindset Better transparency on forecast and delivery performance Better consensus on market opportunities S&OP creates a clear meeting structure to enable transparency on demand and supply – and an escalation forum where potential issues or demand-shaping opportunities can be raised to top management to make well-informed decisions that maximise value across Arla as a global entity.
  • 5. 5Implement Consulting Group Arla – One planning and allocation Contact Søren Skjødt, sos@implement.dk, +45 5138 7402 creating alignment and decisions that are cascaded throughout the organisation in an increasingly seamless way. Making our top management eager to take part in the different steps in the S&OP process. Issues like clear market prioritisation when in lack of products or raw material is a constant theme. An example could be a temporal lack of organic milk that has become very sought after by the consumers: “A topic like this is close to heart for all markets and will give a lively debate, and it is vital that we can trust the numbers supplied at the meetings”, says Jakob Lignell. Other examples are the clear guiding principles that are formed via case- based decisions that are actively lifted to ­principal guidelines helping steer the company with less friction. Demand shaping built on optimal overall profitability is also a recurring event at the meetings as well as movement of production between plants and gap- closing activities built on top of the ­realistic demand plans supplied by the SAP APO demand planning template. The examples above are just a few among several others that underline the impact created by the One Planning and Allocation programme. Overall, the process also supports hard benefits such as better customer service, reduced inventory and lead times, higher productivity and better CAPEX usage. The benefits acquired also include more intangible ones like better decision-­ making, enhanced teamwork, a more global mindset, better transparency, structured communication in a common language and much better consensus on market decisions. Learnings For Jakob Lignell and his team, and not least for Arla, the One Planning and Allocation programme has been a ­success. This is, of course, basically a direct result of a tremendous effort, change readiness and willingness to ­contribute of all involved parties in Arla. But if we take a deep dive into the underlying factors, it is possible to ­pinpoint the vital few success ­factors that other companies and project ­managers facing a similar challenge may benefit from: • Focus on impact early in the project • Create an environment of trust between IT and the business • Be ambitious regarding the vision and the end goal of the project • Be pragmatic and flexible in the process – rather go for the 20% that are used than waiting for the entire solution to be finished • Don’t be afraid to present solutions that are not 100% perfect and learn as you go along • Remember that while plans and systems are important, it is all about people in the end. So be tender- hearted on the people and tough- minded on the issue