The Lunar Thermal Ice Pump
•
0 likes•89 views

A brief summary of the concept of thermally-driven ice storage on the Moon. Audience: lunar scientists

Recommended
Recommended
More Related Content
Similar to The Lunar Thermal Ice Pump
Similar to The Lunar Thermal Ice Pump (20)
Recently uploaded
Recently uploaded (20)
The Lunar Thermal Ice Pump
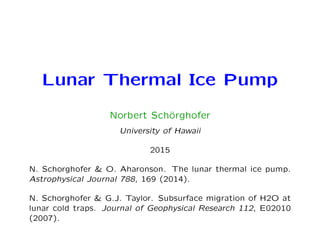
- 1. Lunar Thermal Ice Pump Norbert Sch¨orghofer University of Hawaii 2015 N. Schorghofer & O. Aharonson. The lunar thermal ice pump. Astrophysical Journal 788, 169 (2014). N. Schorghofer & G.J. Taylor. Subsurface migration of H2O at lunar cold traps. Journal of Geophysical Research 112, E02010 (2007).
- 2. Ice storage on the Moon Proposed storage mechanisms for H2O or volatile H: Cold trapping, exposed ice Urey (1952), Watson et al. (1961) Cold trapping, buried ice Paige et al. (2010) Thermal ice pump Schorghofer & Aharonson (2014) Adsorption† e.g., Cocks et al. (2002) Hydration† Implanted solar wind∗ Starukhina (2001,2006) & diffusion-limited escape The “Thermal Ice Pump” is a mechanism for storing water ice, physically different from cold trapping. † adsorption is a surface phenomenon whereas hydration is a bulk phenomenon. ∗ forms H or OH
- 3. Physics of H2O Migration Subsurface diffusion. Molecules follow a random walk within subsurface pore spaces (diffusion) Thermalization. When a molecule comes in contact with the surface, it thermally accommodates. Physical justification: Vi- brational frequency of the bond between the H2O molecule and the substrate surface is typically 1013 Hz. A fraction of incident molecules bounces elasti- cally: 0–40% at 40–180K (Haynes et al., 1992)
- 4. Sublimation Rate into Vacuum Basic kinetic theory provides relations between E ... sublimation rate into vacuum τ ... the mean residence time psv ... saturation vapor pressure E = psv √ 2πkBTm (1) E depends on saturation vapor pressure, even in vacuum. 1 τ = E σm (2) σm ... number of molecules per area for a monolayer (≈ 1019 m−2) Adsorbed water molecules are more stronlgy bound than H2O molecules on ice, e.g. 0.7 eV versus 0.5 eV (Poston et al., 2015).
- 5. Residence Time of H2O Molecule 60 80 100 120 140 160 180 200 220 240 260 10 −10 10 −5 10 0 10 5 10 10 Temperature (K) MeanResidenceTime(years) age of solar system duration of ballistic flight diurnal period 10 −5 10 0 10 5 10 10 10 15 MeanResidenceTime(seconds) 1 m/Gyr = 1 nm/yr = 3 monolayers / yr
- 6. Adsorption Isotherm → Residence Time 0 0.2 0.4 0.6 0.8 1 0 2 4 6 8 10 12 Vapor pressure p/p 0 Adsorbatevolumeθ/θ m Cadenhead & Stetter (1974) − adsorption Cadenhead & Stetter (1974) − desorption Fit Measured adsorption isotherms for lunar sample 15565,3G at 15○C (Cadenhead & Stetter, 1974) and an empirical fit (Schorghofer & Aharonson, 2014). Single monolayer has 1/5th the vapor pres- sure (and therefore sublimation rate) of bulk ice.
- 7. Subsurface Diffusion Molecules follow a random walk within the subsurface pore space (⇒ diffusion process) At high temperature: time of flight > surface residence time at low temperature: time of flight < surface residence time ice grain Transport due to differences in surface concentration or due to temperature gradient.
- 8. Migration Models σ... areal density (#molecules/area) zn... depth at site n, zn+1 = zn + ... jump length (mean free path), τ... residence time The outward flux from any site: σ/τ. The net flux is J = −( σn+1 2τn+1 − σn 2τn ) = − ∂ ∂z ( σ 2τ ) = − ∂ ∂z E(σ,T) Flux caused by gradient in temperature T or surface concentra- tion σ. Three levels of description/models: Random walk (discrete) Continuum (diffusion-advection equation) Boundary-value problem (time average)
- 9. Loss rate of buried ice 70 80 90 100 110 120 130 140 10 −6 10 −4 10 −2 10 0 10 2 10 4 Temperature (K) IceLossRate(kg/m 2 /Ga) buried exposed sublimationloss dash line: ice on surface solid line: buried beneath 10 cm of 75µm grains In steady state, a gradient of in adsorbate concentration is estab- lished. Loss rate is reduced relative to sublimation into vacuum by number of hops it takes to escape: Eburied = ( /∆z)Evacuum. 100 kg/m2/Gyr = 110 K for exposed ice = 130 K for buried ice
- 10. Pumping Effect Temperature Sublimationrate 0 Depthbelowsurface T(z,t) Schematic illustration of a subsurface temperature pro- file (solid line = instanta- neous, dashed lines = min- imum and maximum). A volatile water molecule has a probability to hop up or down. A molecule on the surface has a higher mobil- ity than a molecule at depth. In the long term, this leads to a net vertical flux of wa- ter molecules. When suffi- ciently many H2O molecules are available on the surface, this acts as an “ice pump”.
- 11. History and Analogs The concept of subsurface ice accumulation due to thermally driven diffusion (an “ice pump”) was originally proposed for Mars, by Mellon & Jakosky (1993). On Mars, the source of water molecules is the humid atmosphere. Animation: https://github.com/nschorgh/Planetary-Code-Collection/ blob/master/Mars/Misc/movie1zooms.wmv Reproduced in the lab- oratory (with a static rather than a periodic gradient) by Hudson et al. (2009).
- 12. Physical Concept of Ice Pumps 110 115 120 125 130 0 0.2 0.4 0.6 0.8 1 x 10 −8 Ideal Ice Pump surface mean subsurface Pumping Differential Temperature (K) EquilibriumVaporPressure(Pa) 110 115 120 125 130 0 0.5 1 1.5 x 10 −9 Lunar Ice Pump surface mean subsurface Temperature (K) EquilibriumVaporPressure(Pa) θ/θ m =∞ θ/θ m =0.1 110 115 120 125 130 0 1 2 3 4 5 6 x 10 −10 Adsorbate Pump surface mean subsurface Temperature (K) EquilibriumVaporPressure(Pa) θ/θm =∞ θ/θ m =0.3 θ/θ m =0.03 170 180 190 200 210 0 0.05 0.1 0.15 0.2 Martian Ice Pump surface mean subsurface Temperature (K) EquilibriumVaporPressure(Pa)
- 13. Surface Population 0 5 10 15 20 25 40 60 80 100 120 140 160 180 200 Time (days) SurfaceTemperature(K) 0 5 10 15 20 25 0 0.1 0.2 H2 OSurfaceConcentration(monolayers) Model of population of H2O molecules on the surface. Molecules are most mobile but also most easily lost during warmest time. w∞ = 1 m/Ga ... space weathering loss for thick ice layer σ ... area density of volatile water molecules E ... sublimation rate dσ dt = s − (1 − e−σ/σm)w∞ − E(T,σ) Stiff ordinary differential equation.
- 14. 40 60 80 100 120 140 50 100 150 200 250 Mean Temperature (K) PeakTemperature(K) Net loss Strong Pumping Weak Pumping Classical Coldtrap PumpingDifferential(m/Ga) 0 0.2 0.4 0.6 0.8 1 Pumping differential according to model calculations that as- sume a supply rate of 1 m/Ga and a space weathering rate of 1 m/Ga. Three nearly-complementary regions: weak pumping and classical cold trapping (red), strong pumping (blue), and net loss (grey).
- 15. -180˚ -150˚ -120˚ -90˚ -60˚ -30˚ 0˚ 30˚ 60˚ 90˚ 120˚ 150˚ 0.0 0.1 0.2 0.3 0.4 0.5 0.6 0.7 0.8 0.9 1.0 Pumping Differential (m/Ga) -180˚ -150˚ -120˚ -90˚ -60˚ -30˚ 0˚ 30˚ 60˚ 90˚ 120˚ 150˚ 0.0 0.1 0.2 0.3 0.4 0.5 0.6 0.7 0.8 0.9 1.0 Pumping Differential (m/Ga) Polar maps of the pumping differential (∆E), color coded and plotted only where positive, overlaid on a shaded relief topo- graphic grid illuminated from the eqatorial direction.
- 16. Conclusions Periodic temperature oscillations can drive water molecule into the subsurface (if enough volatile water molecules are available on the surface) ⇒ Downward pumping of water vapor Alternative ice storage mechanism to classical cold trap- ping Temperature regime for classical coldtrapping and strong pumping is nearly complementary. Strong pumping occurs for mean surface temperatures lower than 105 K and peak surface temperature higher than 120 K. Ice Pump operates at roughly 1% of the lunar surface, but is inefficient (≲ a few %). Efficiency is higher for large pore spaces (rocky) than for small pore spaces (dust). Adsorbate pump also operates on the Moon ⇒ Subsurface has more adsorbed H2O than the surface.