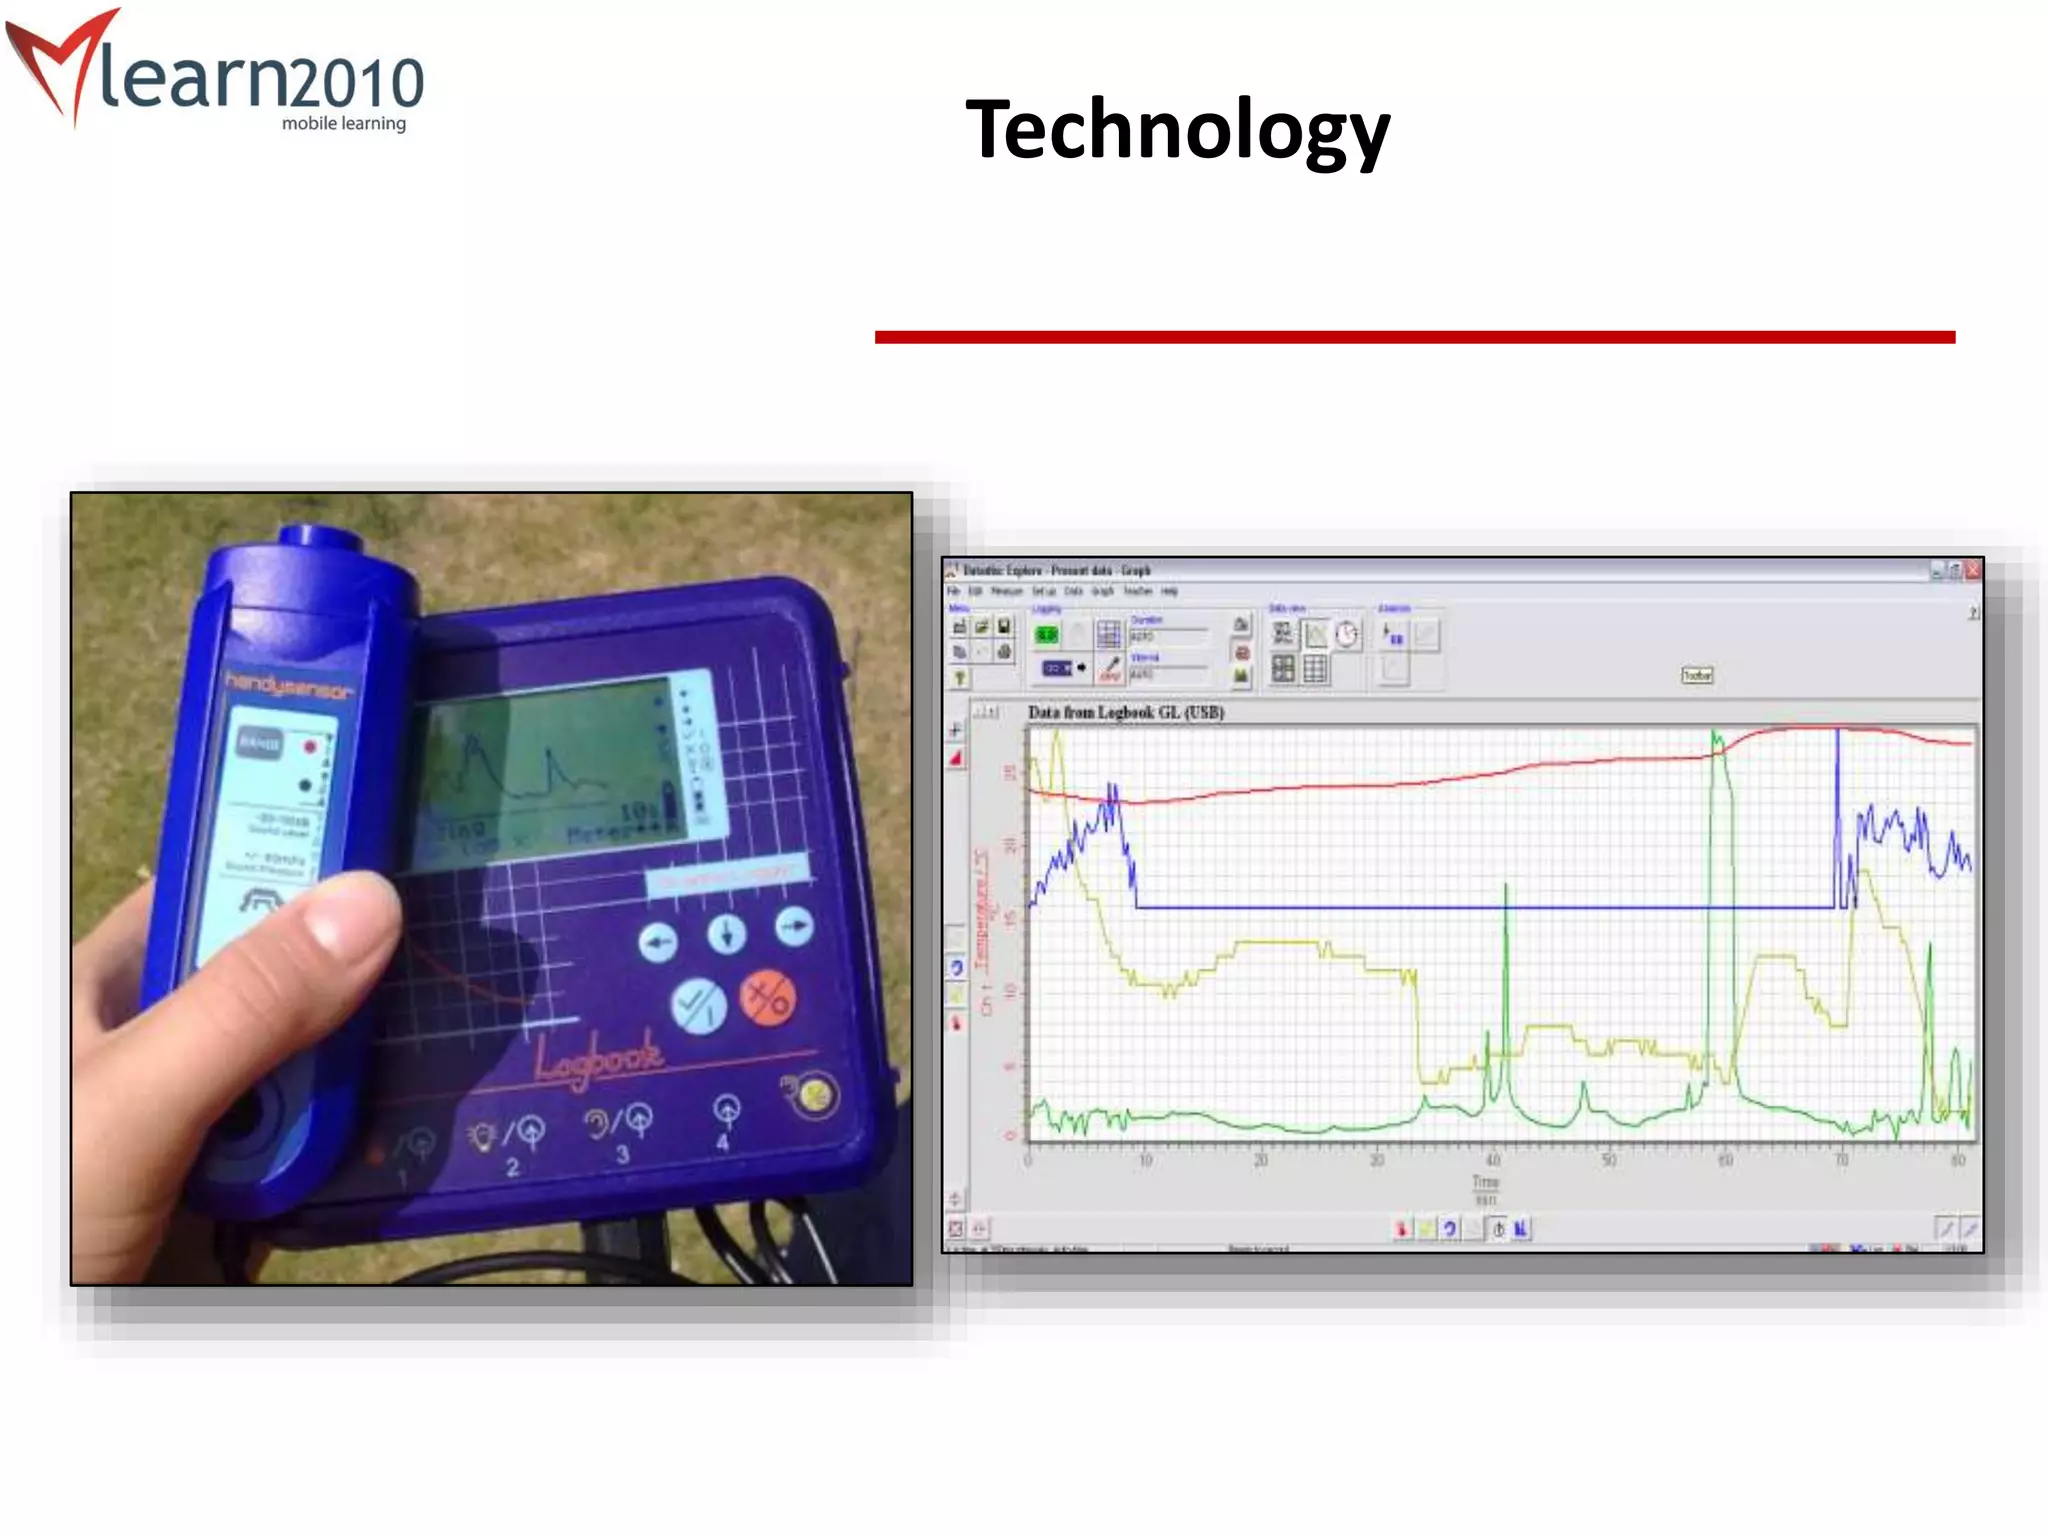
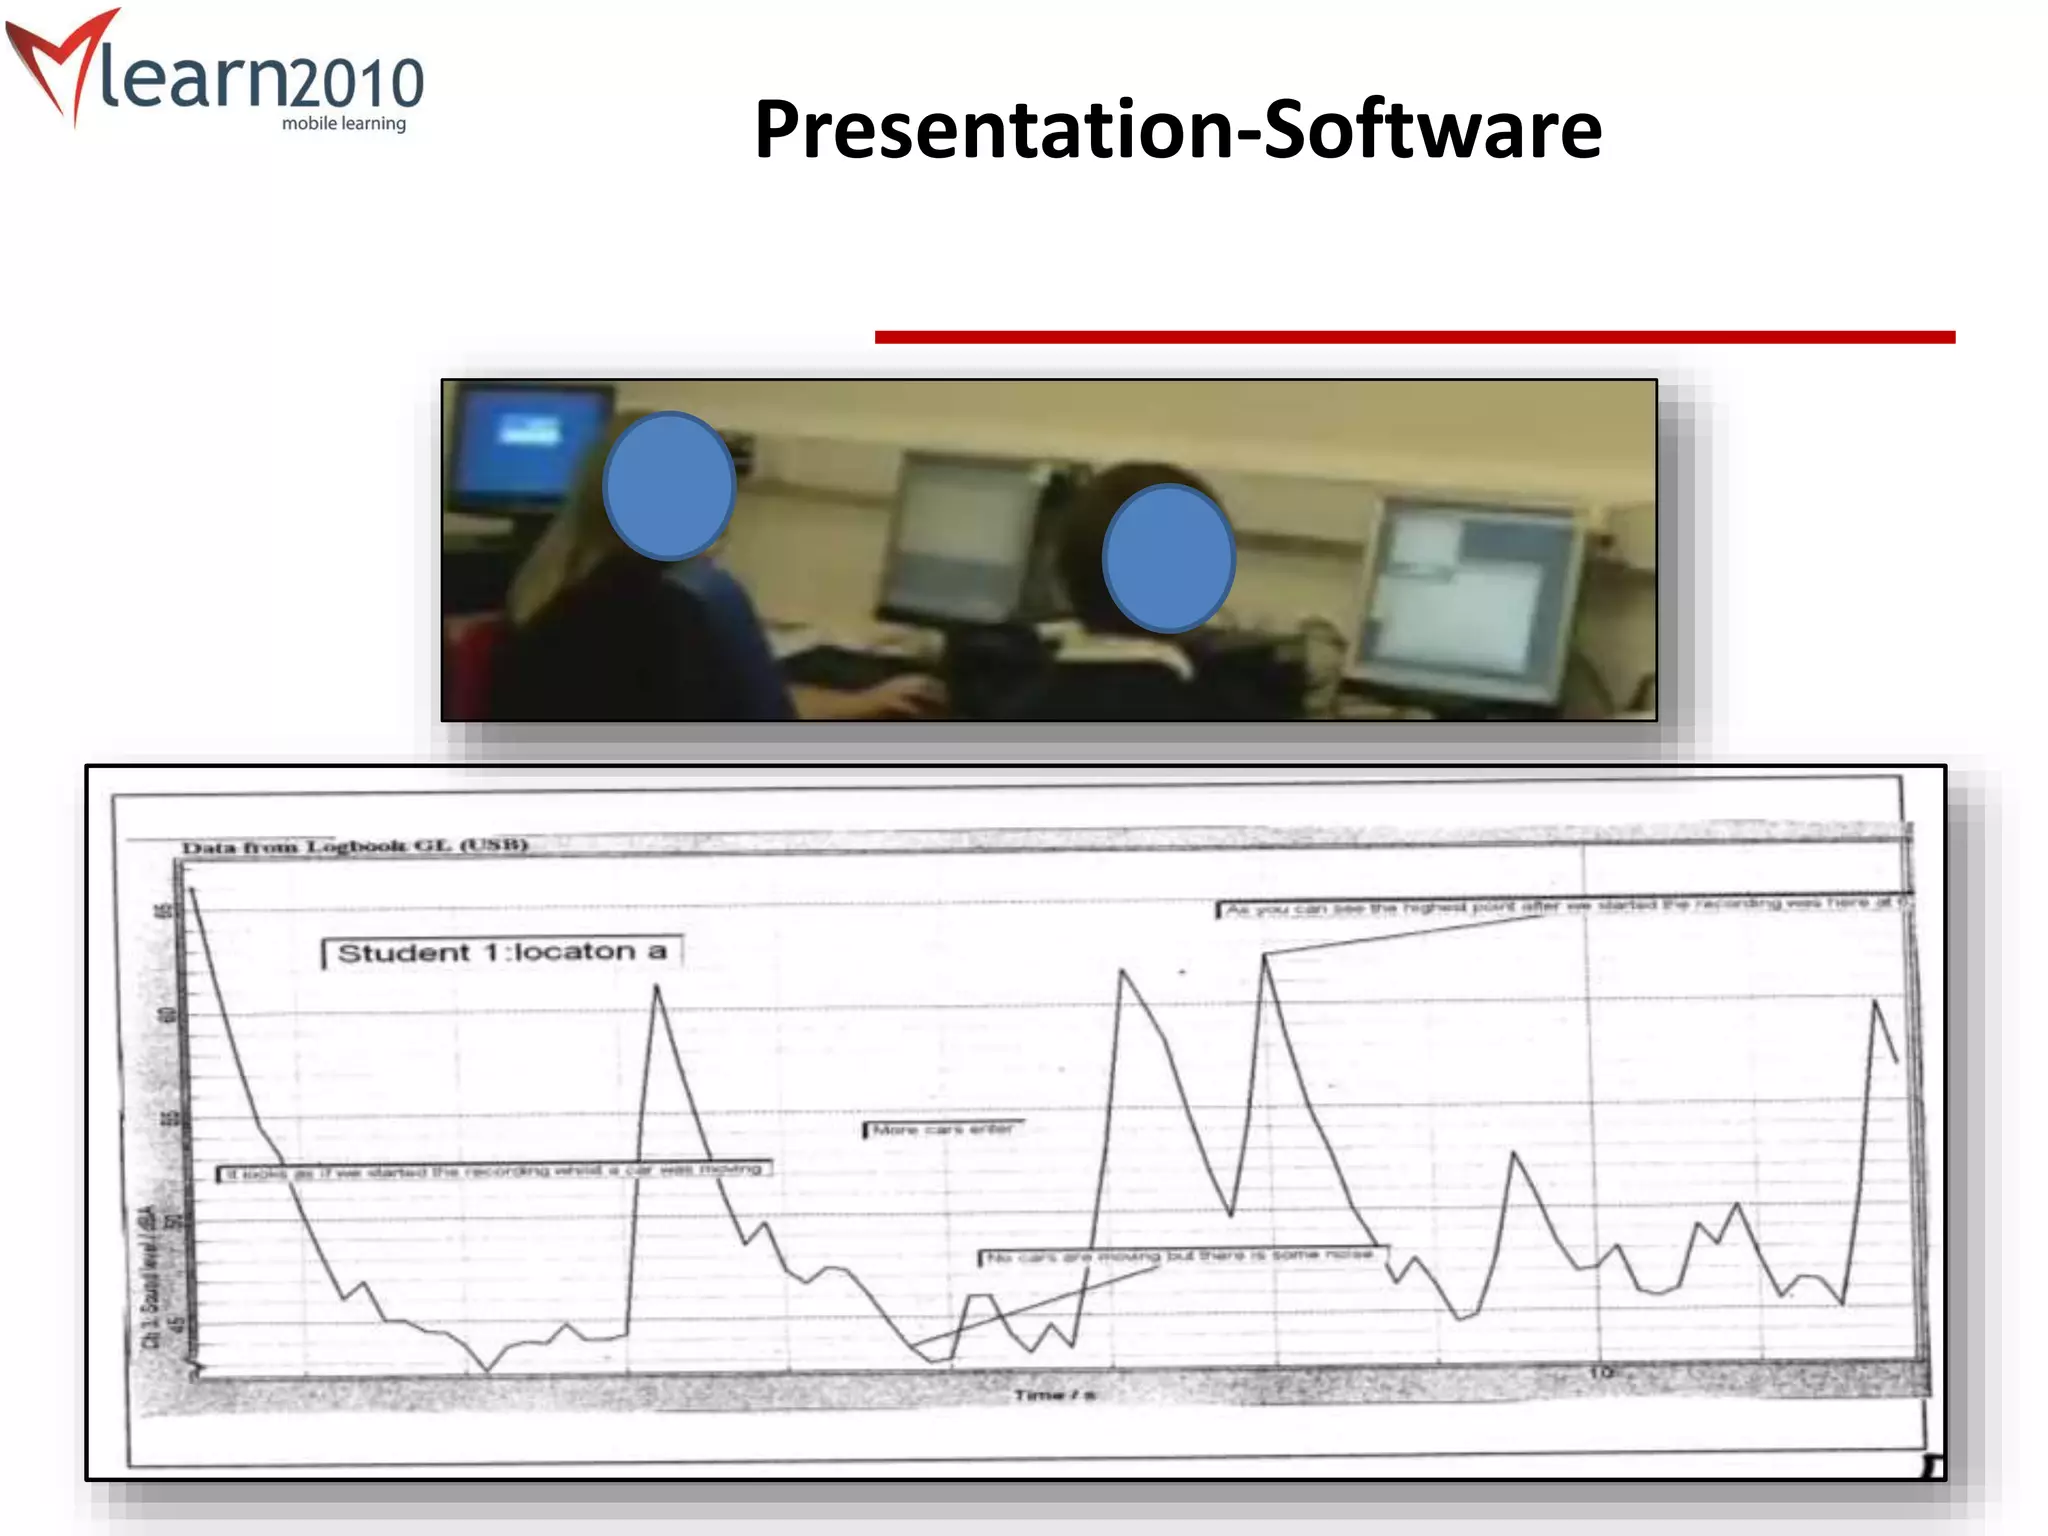
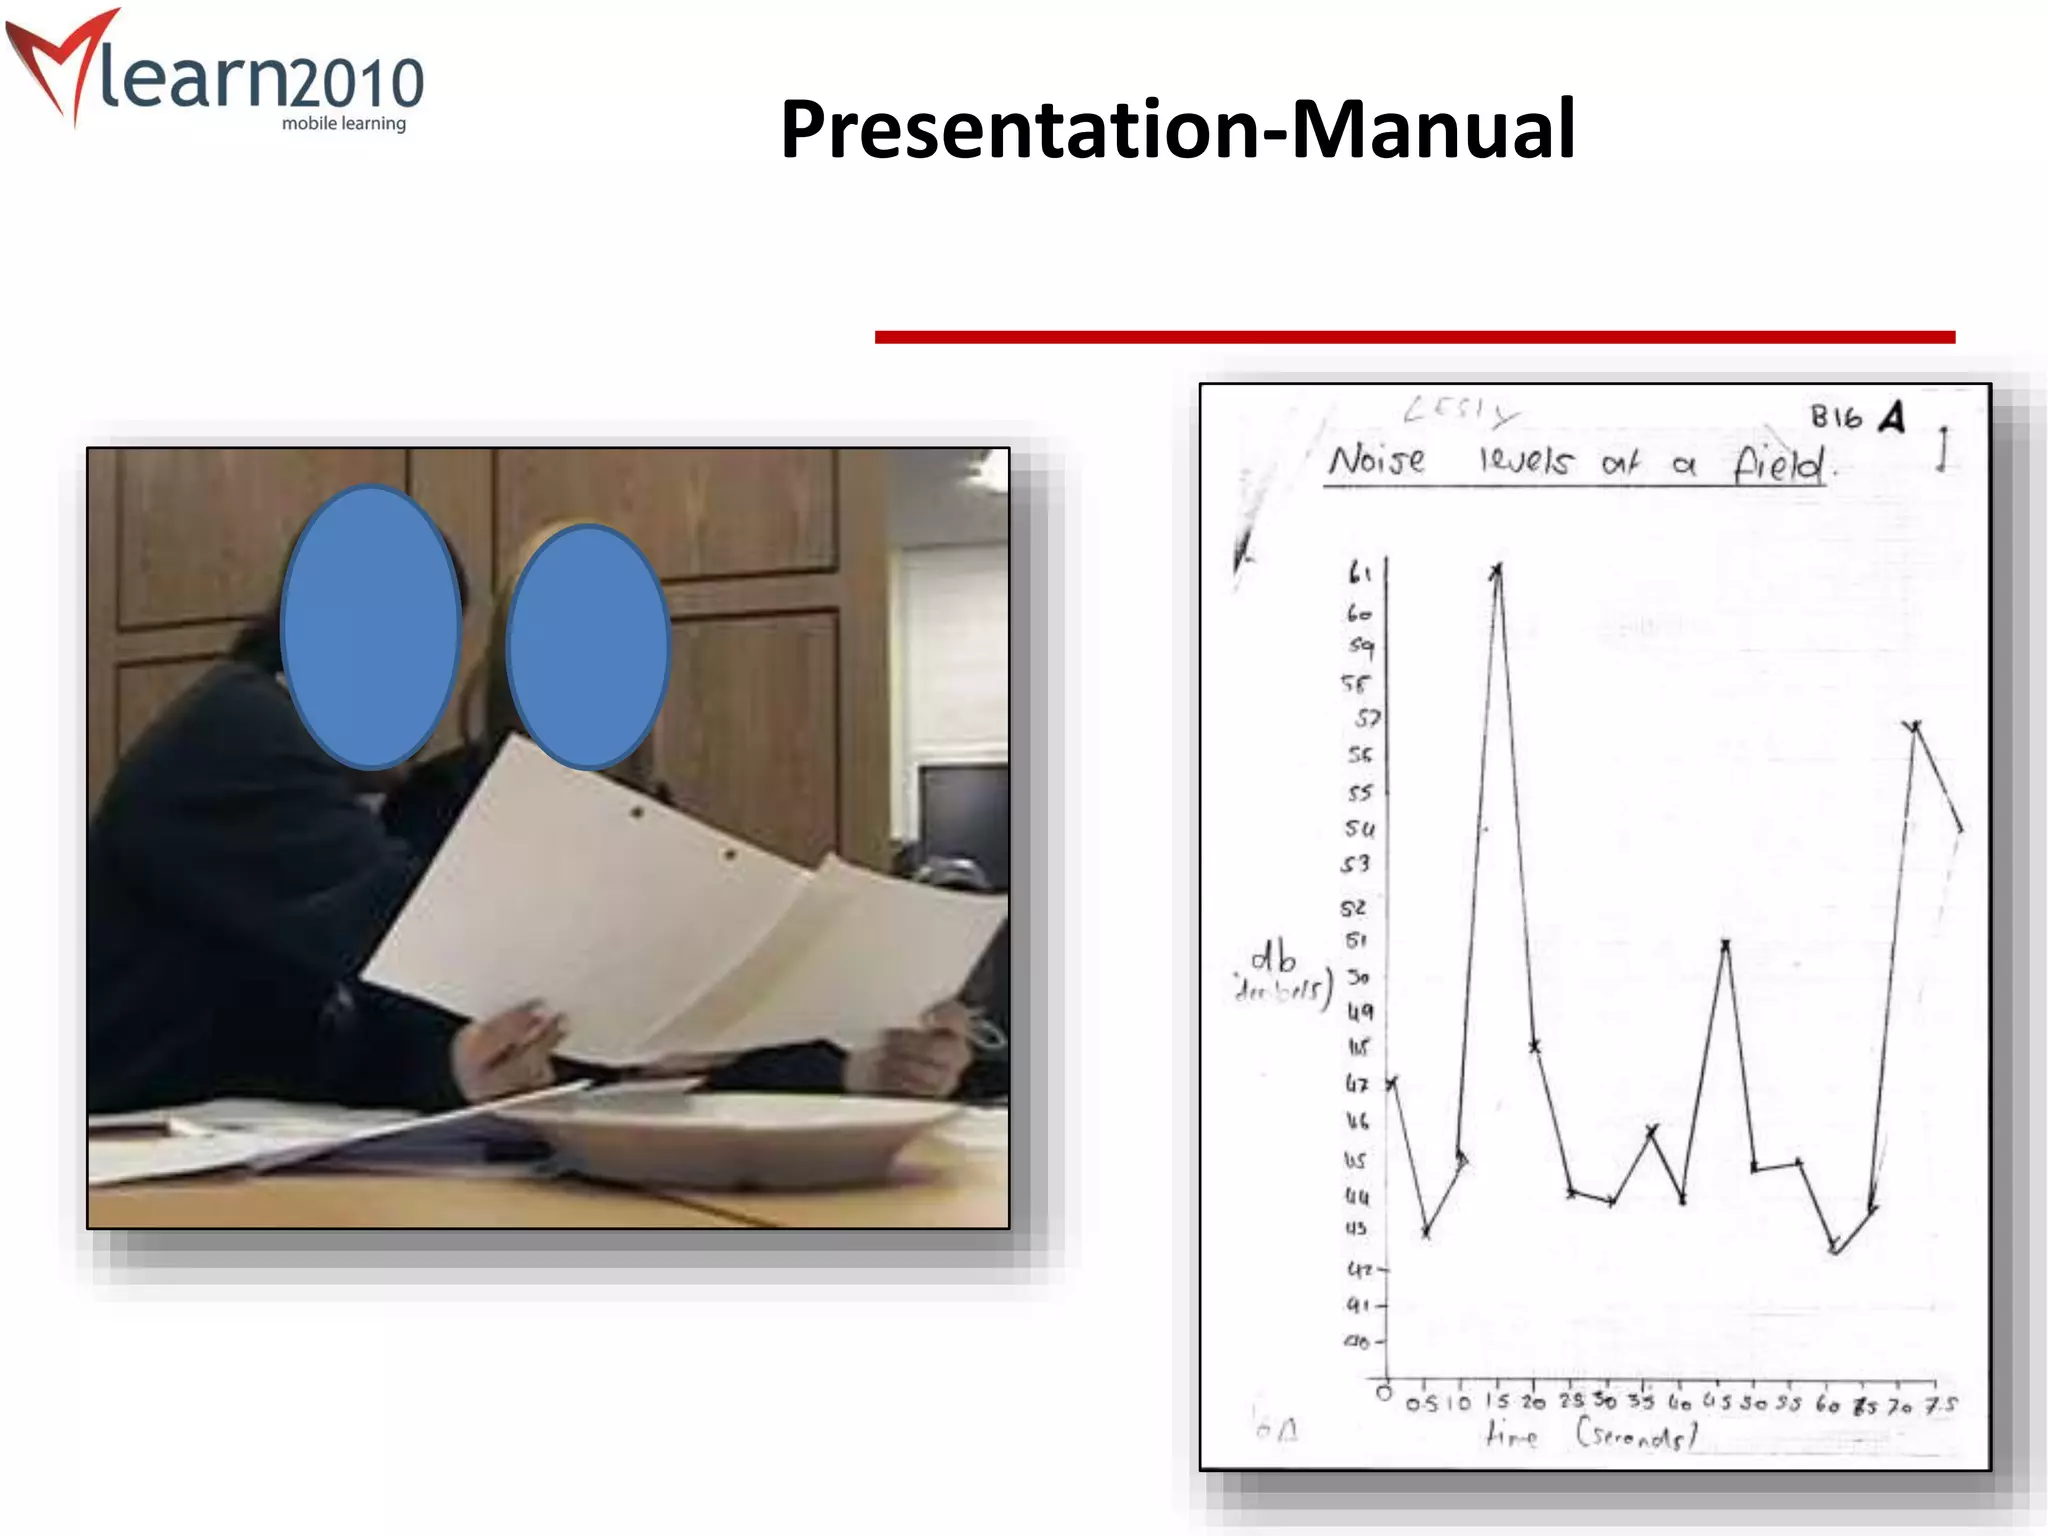
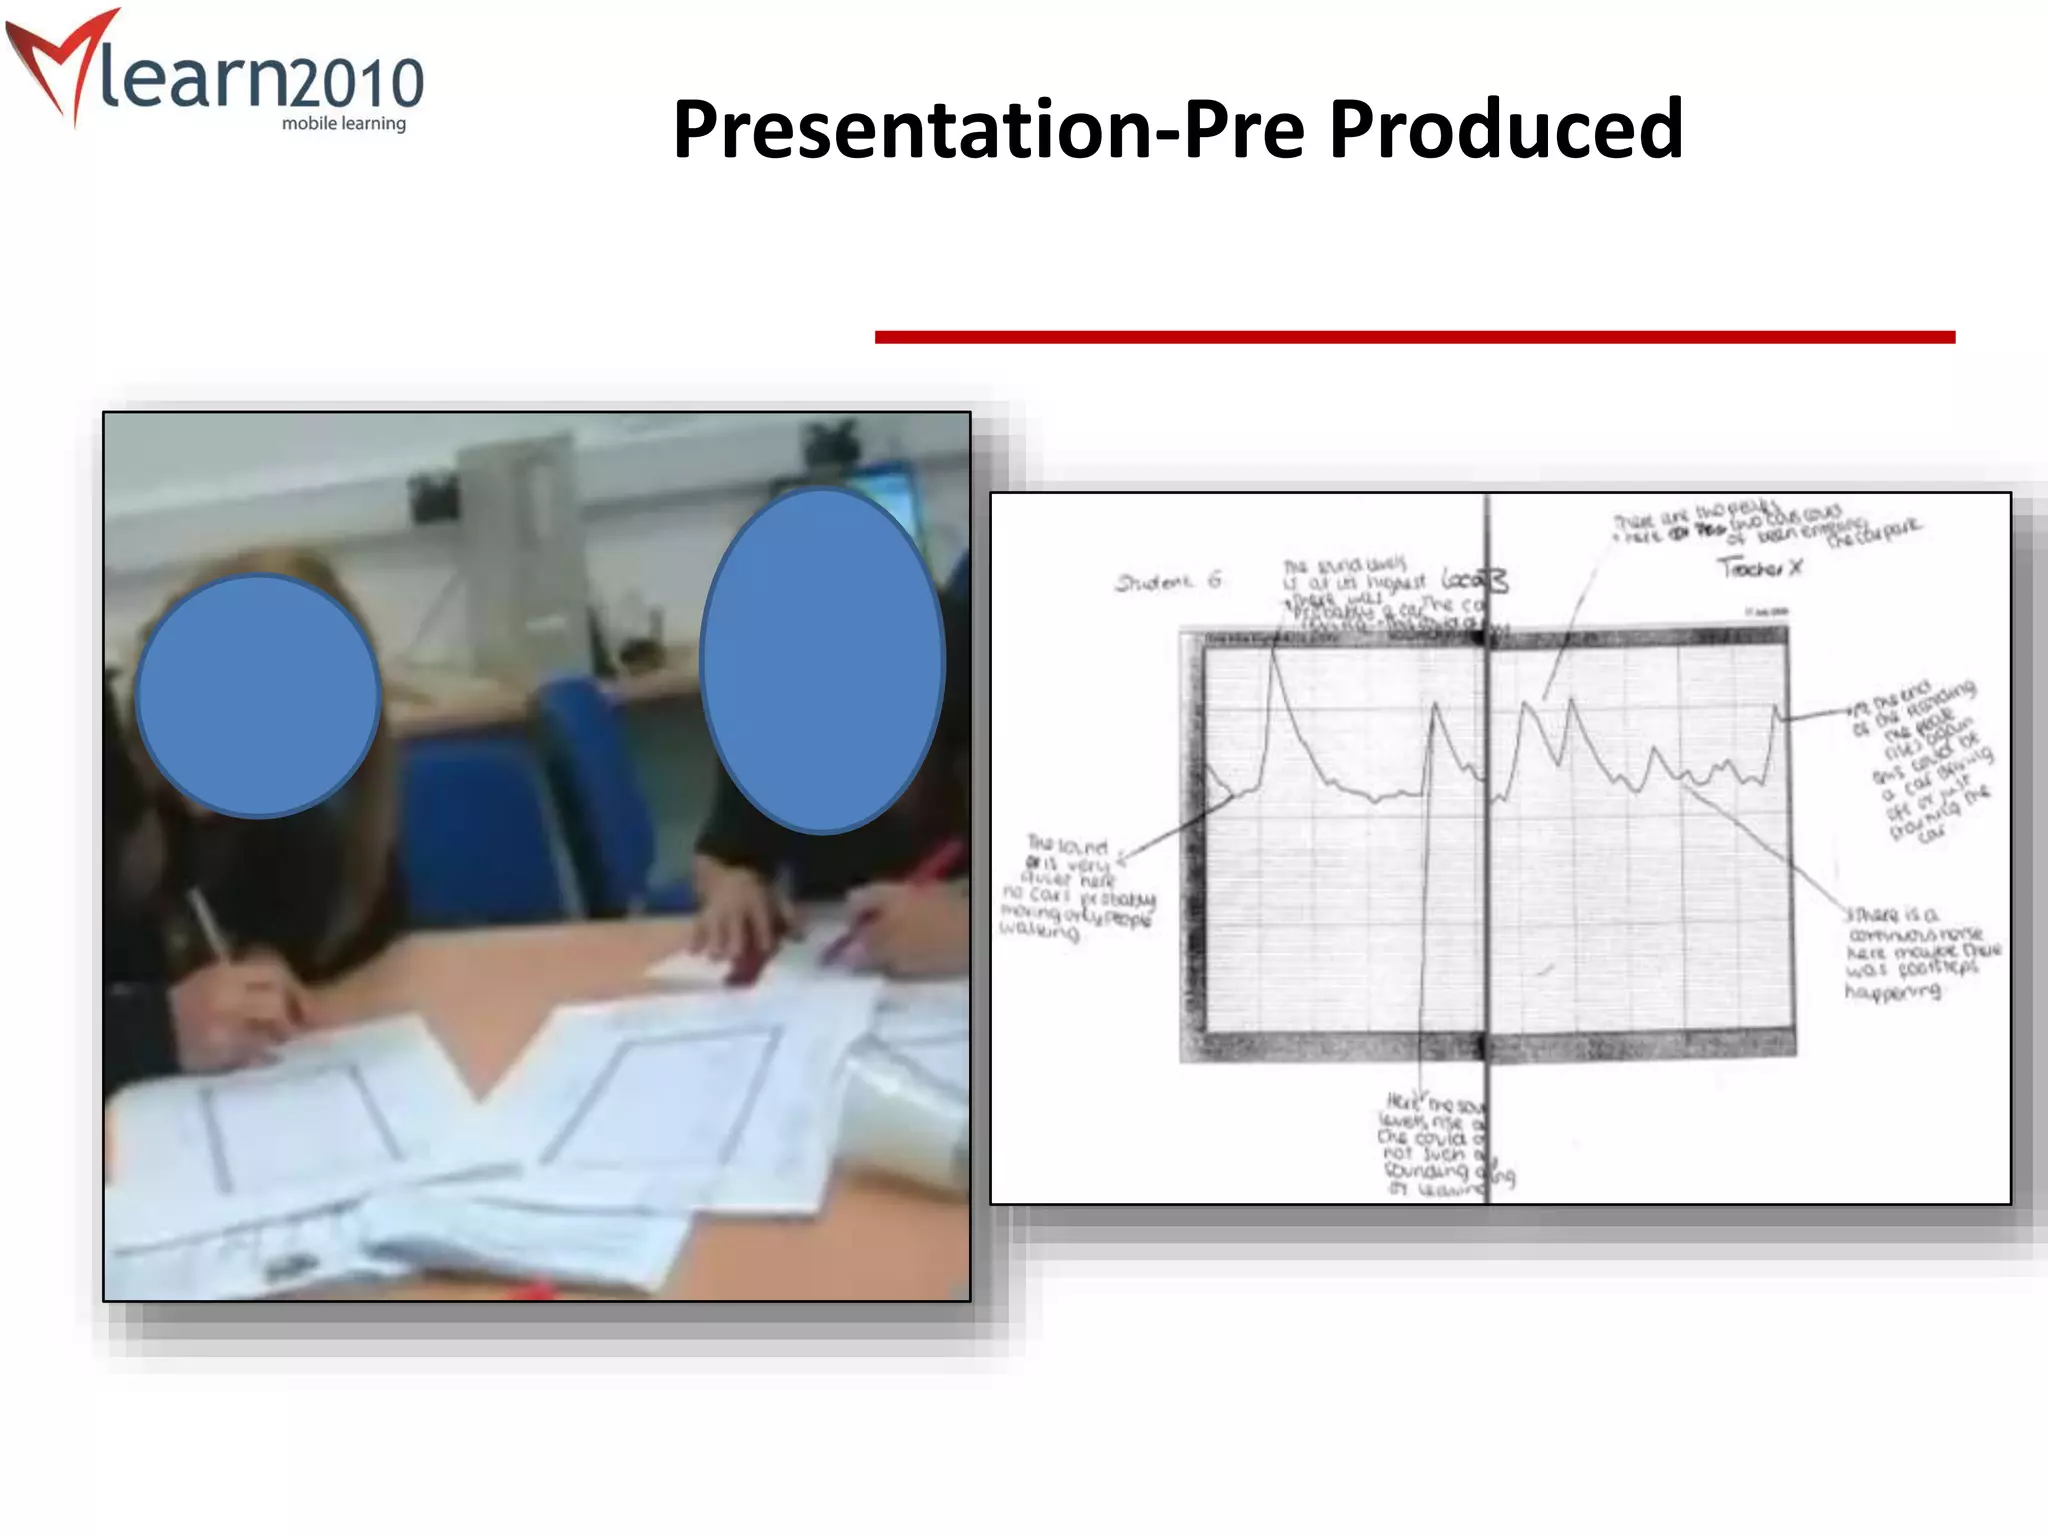
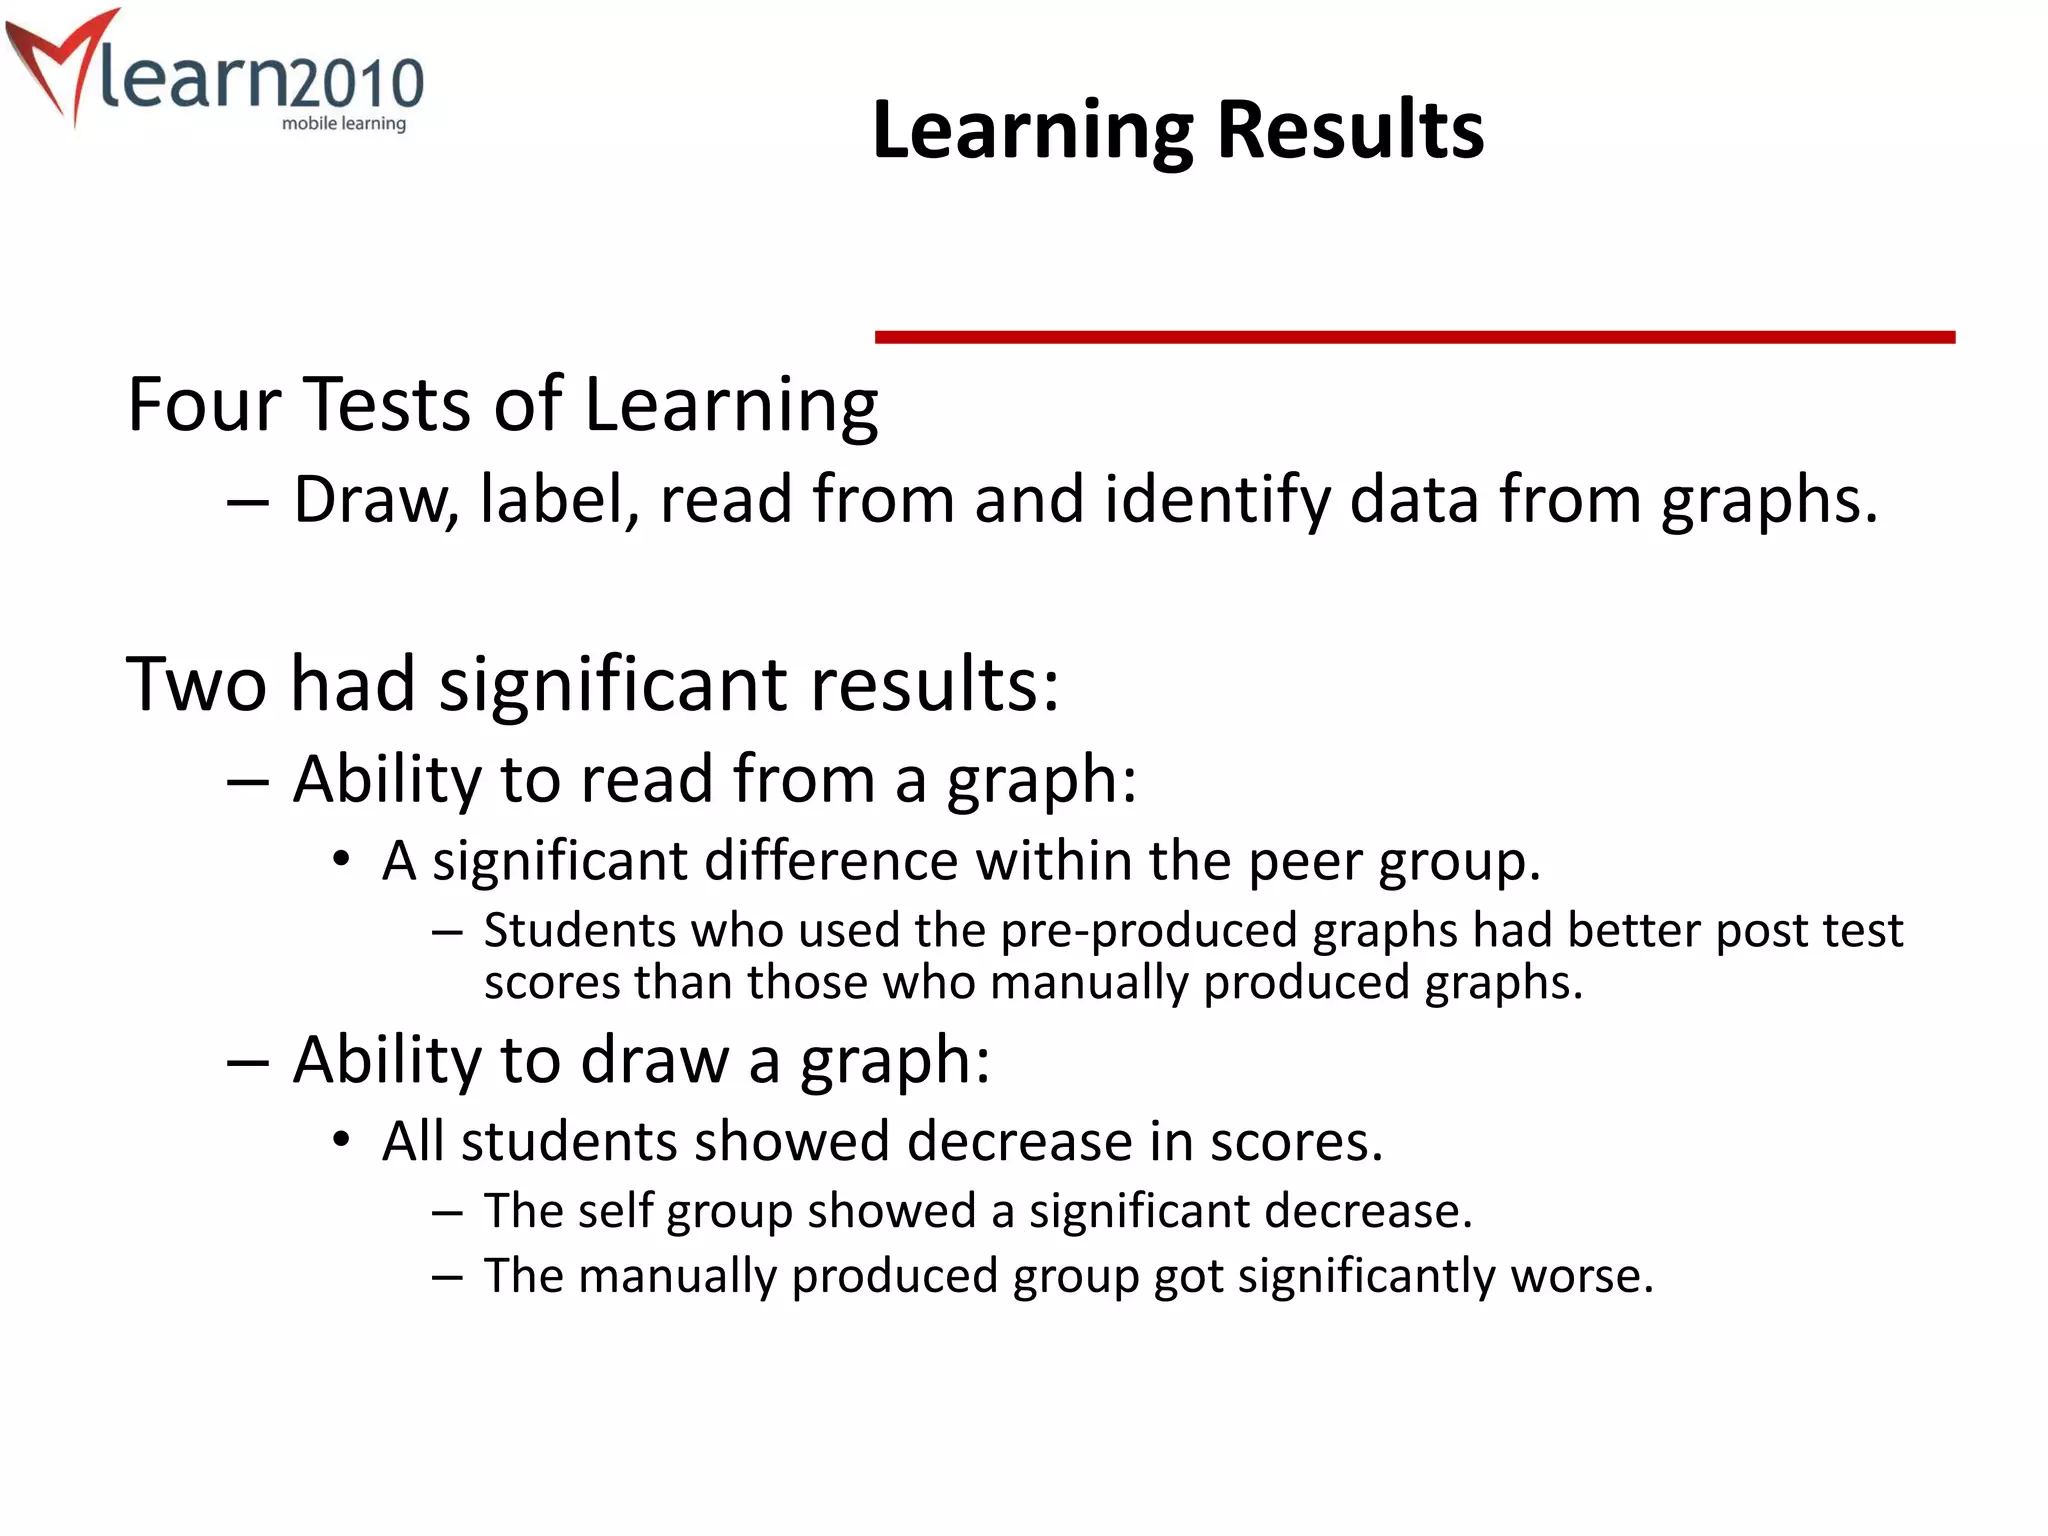
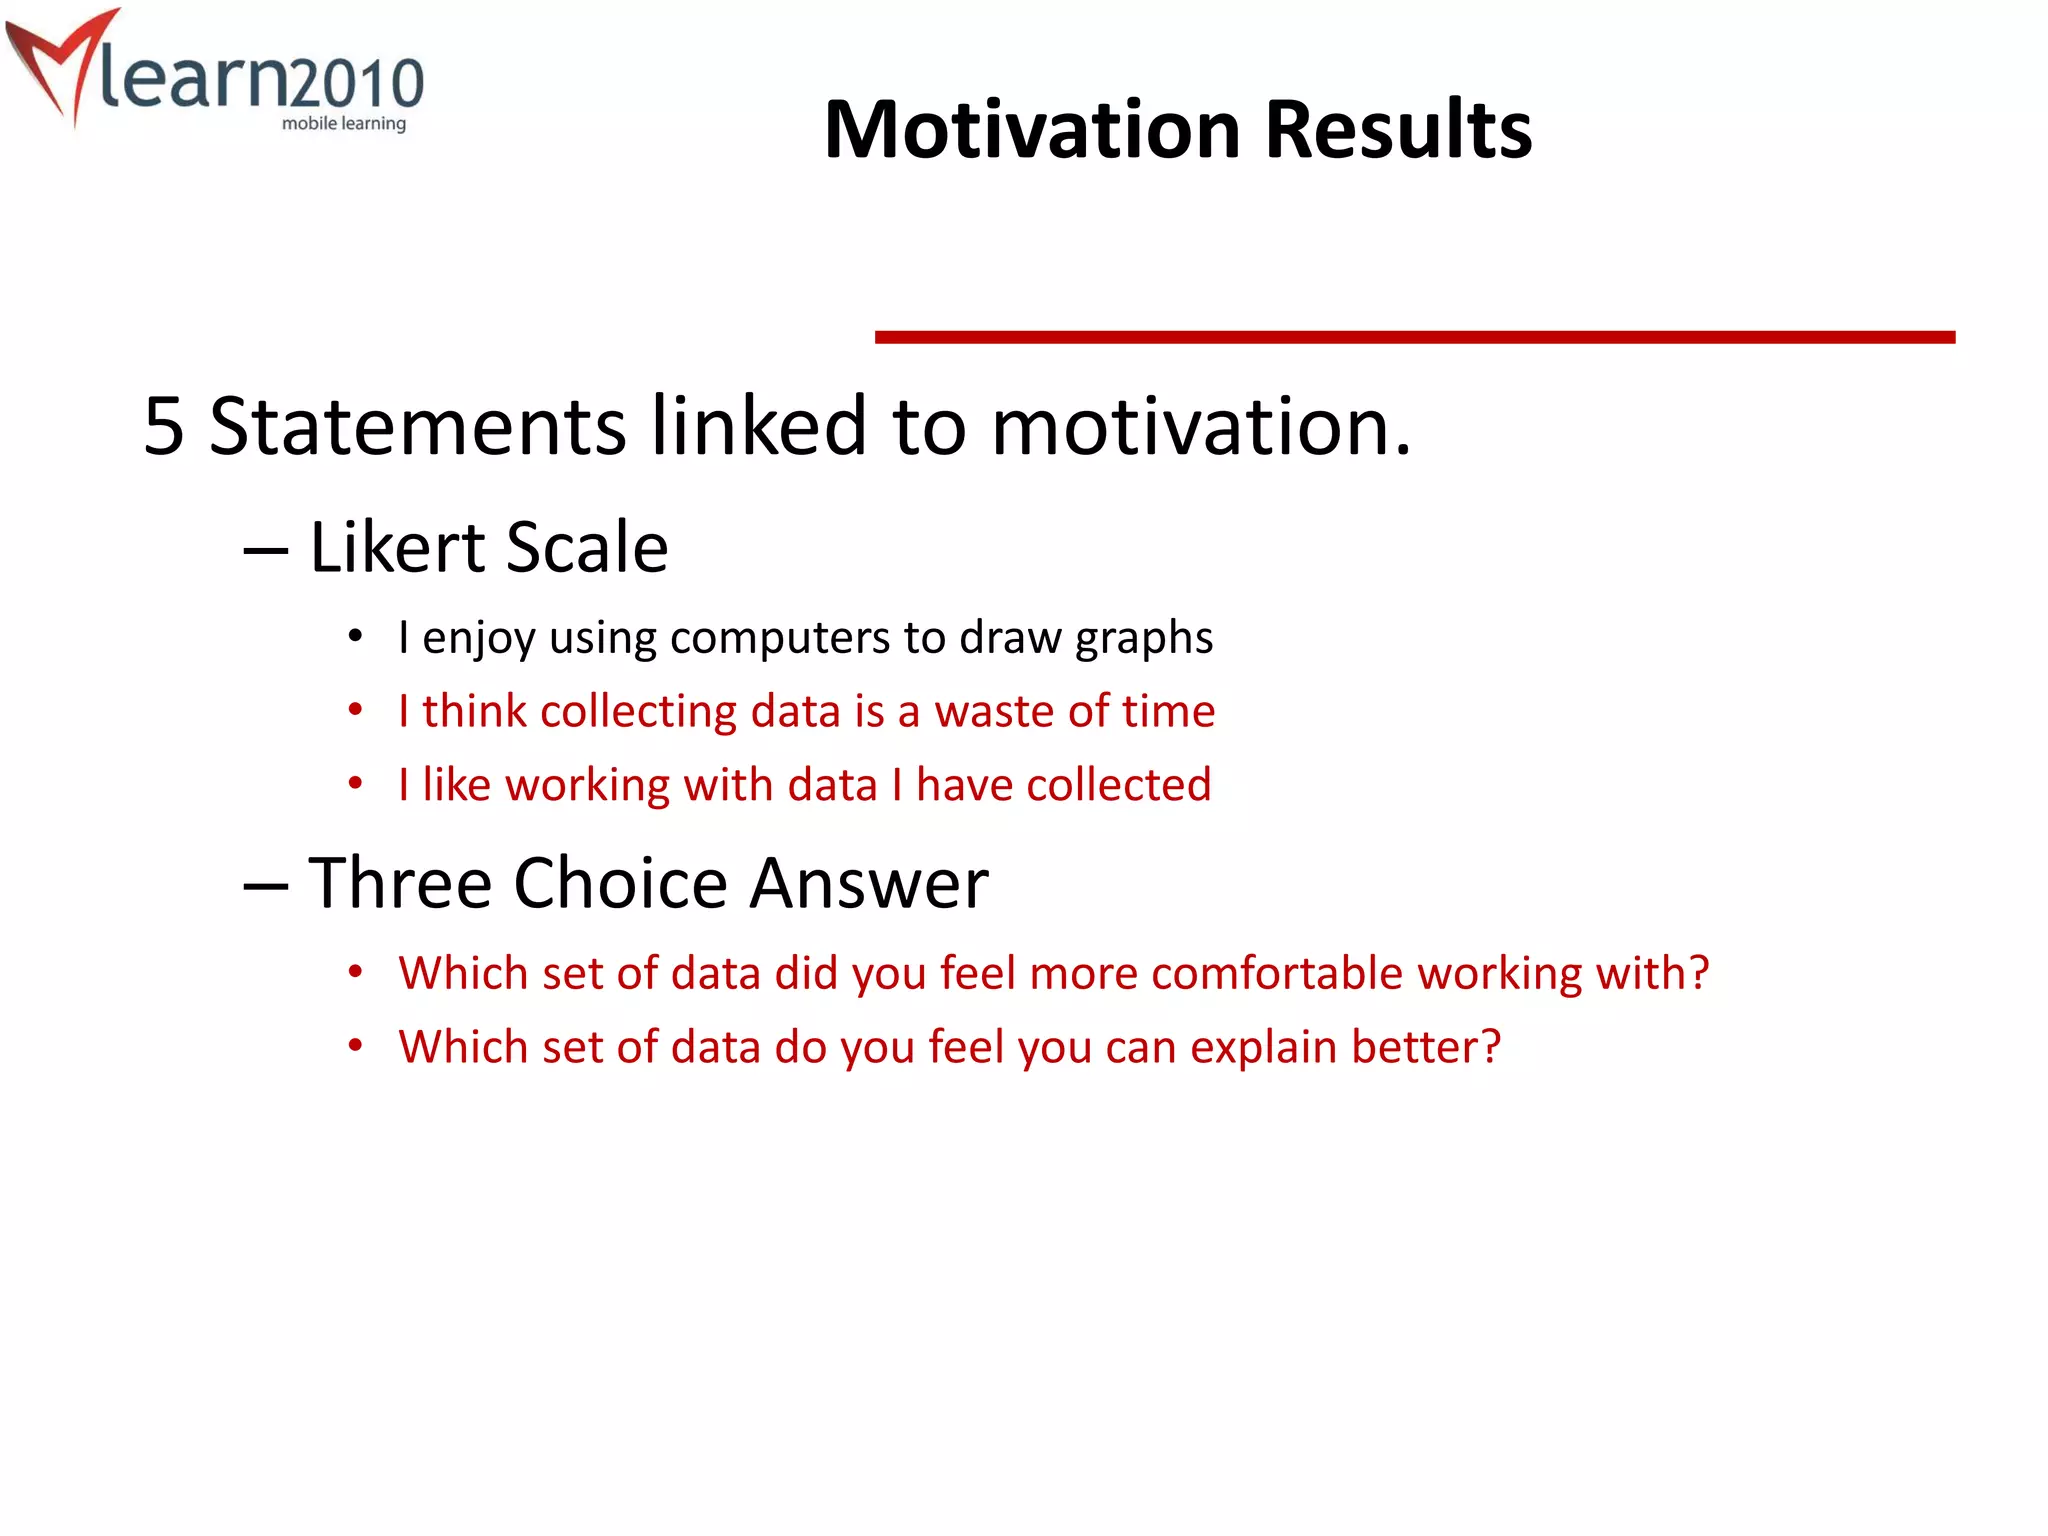
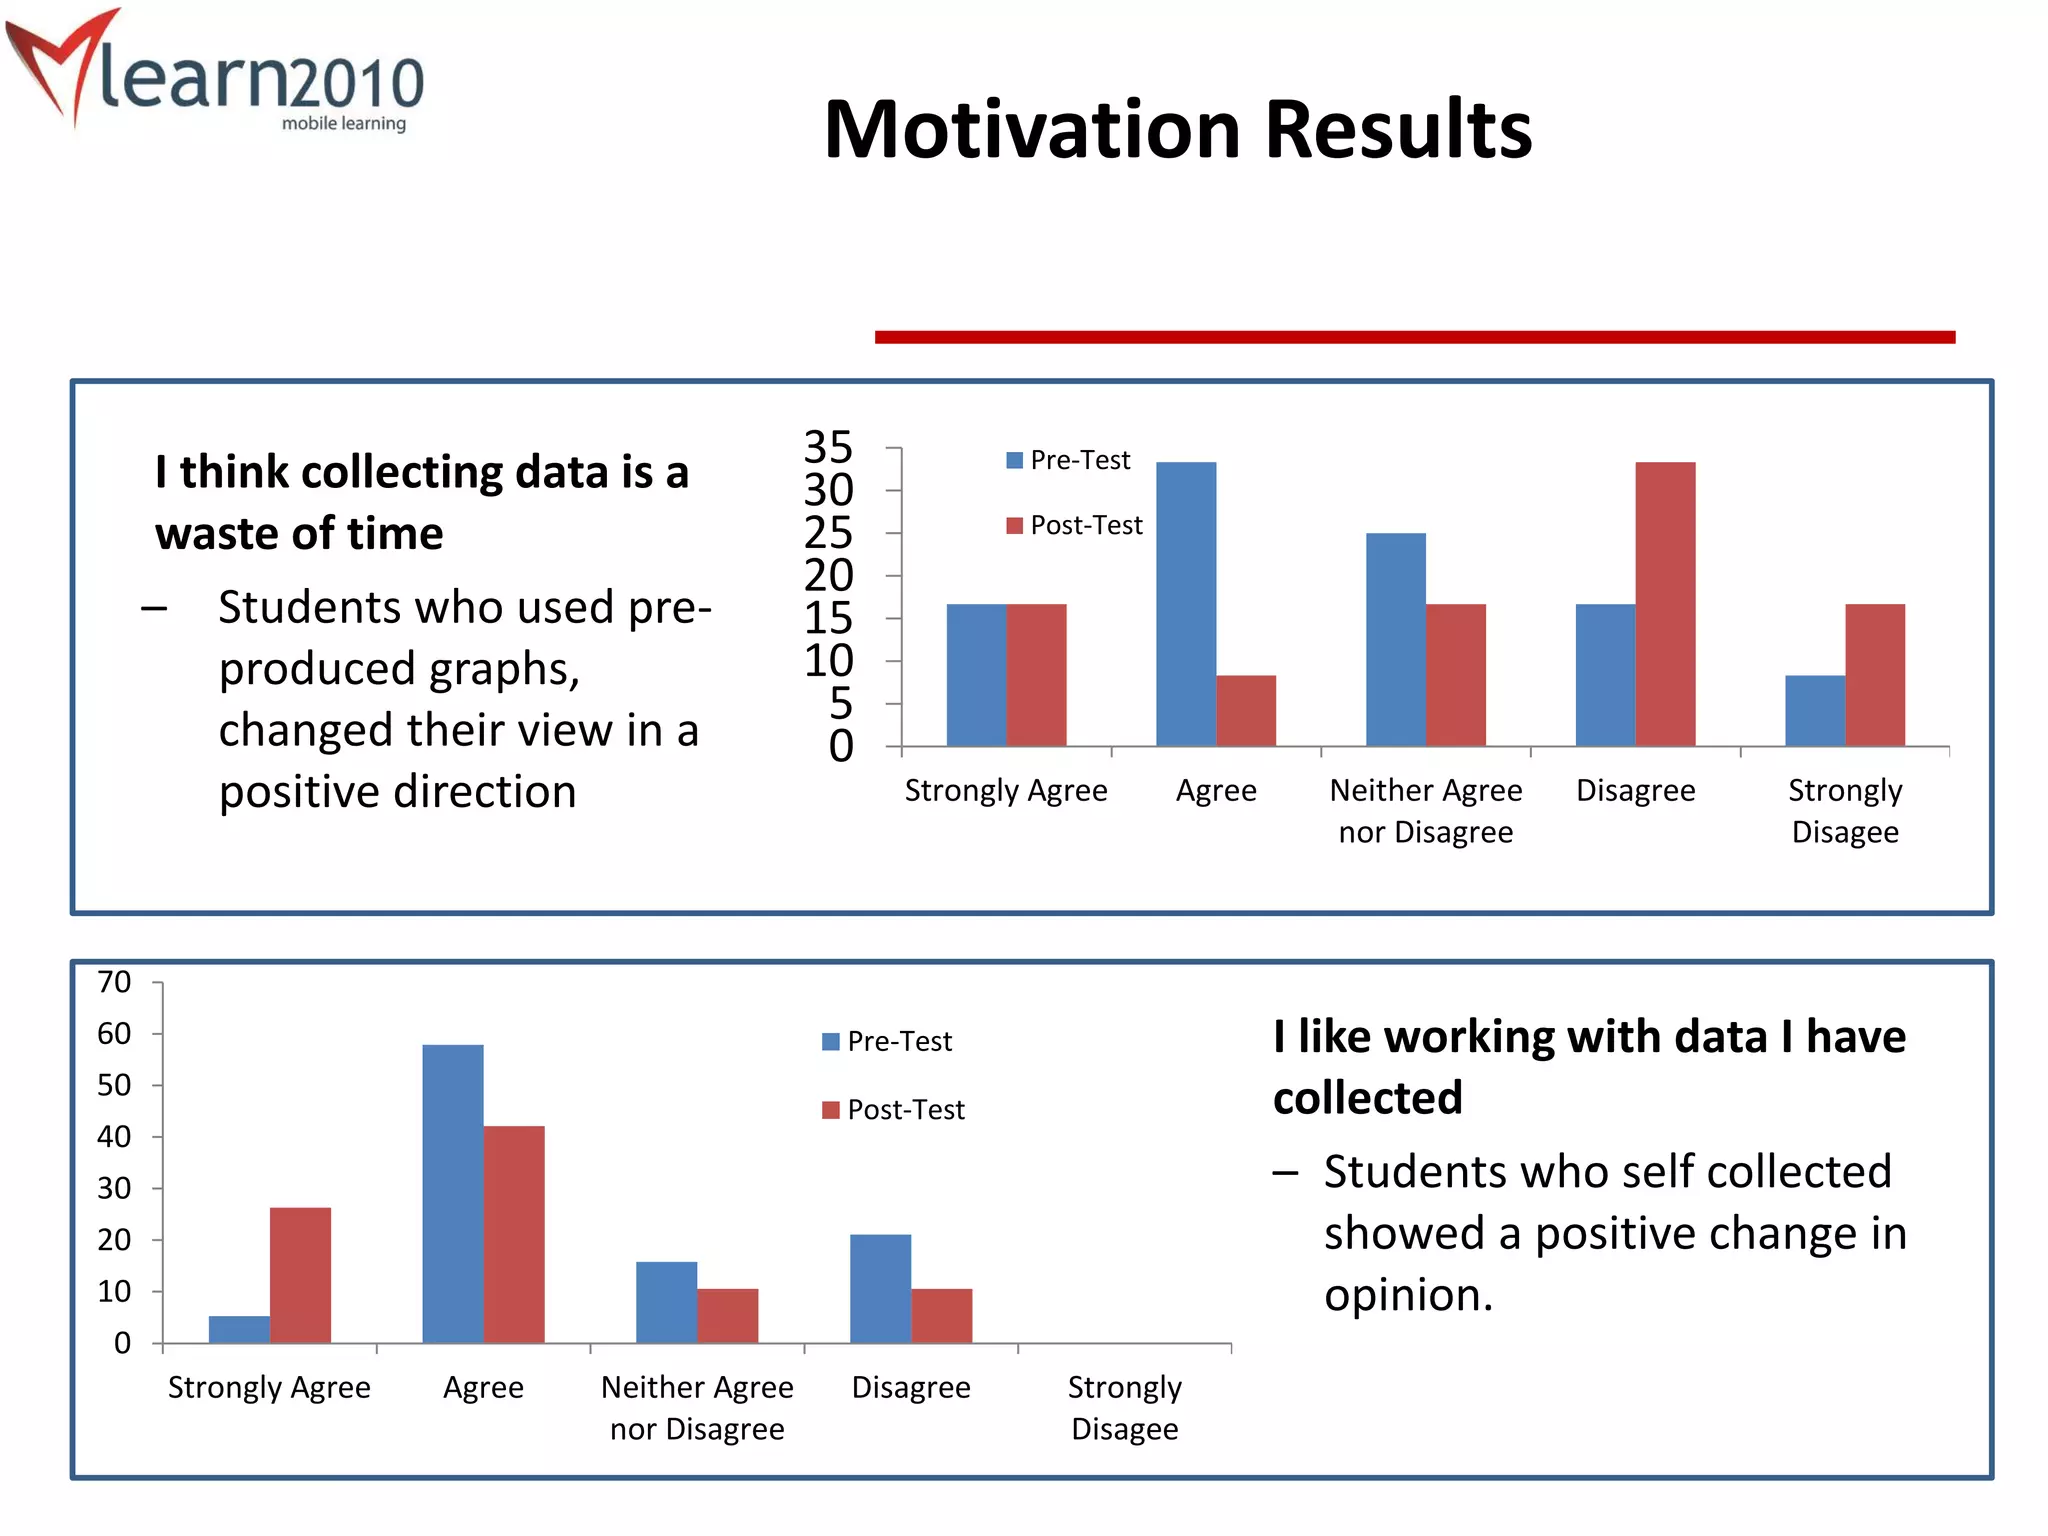
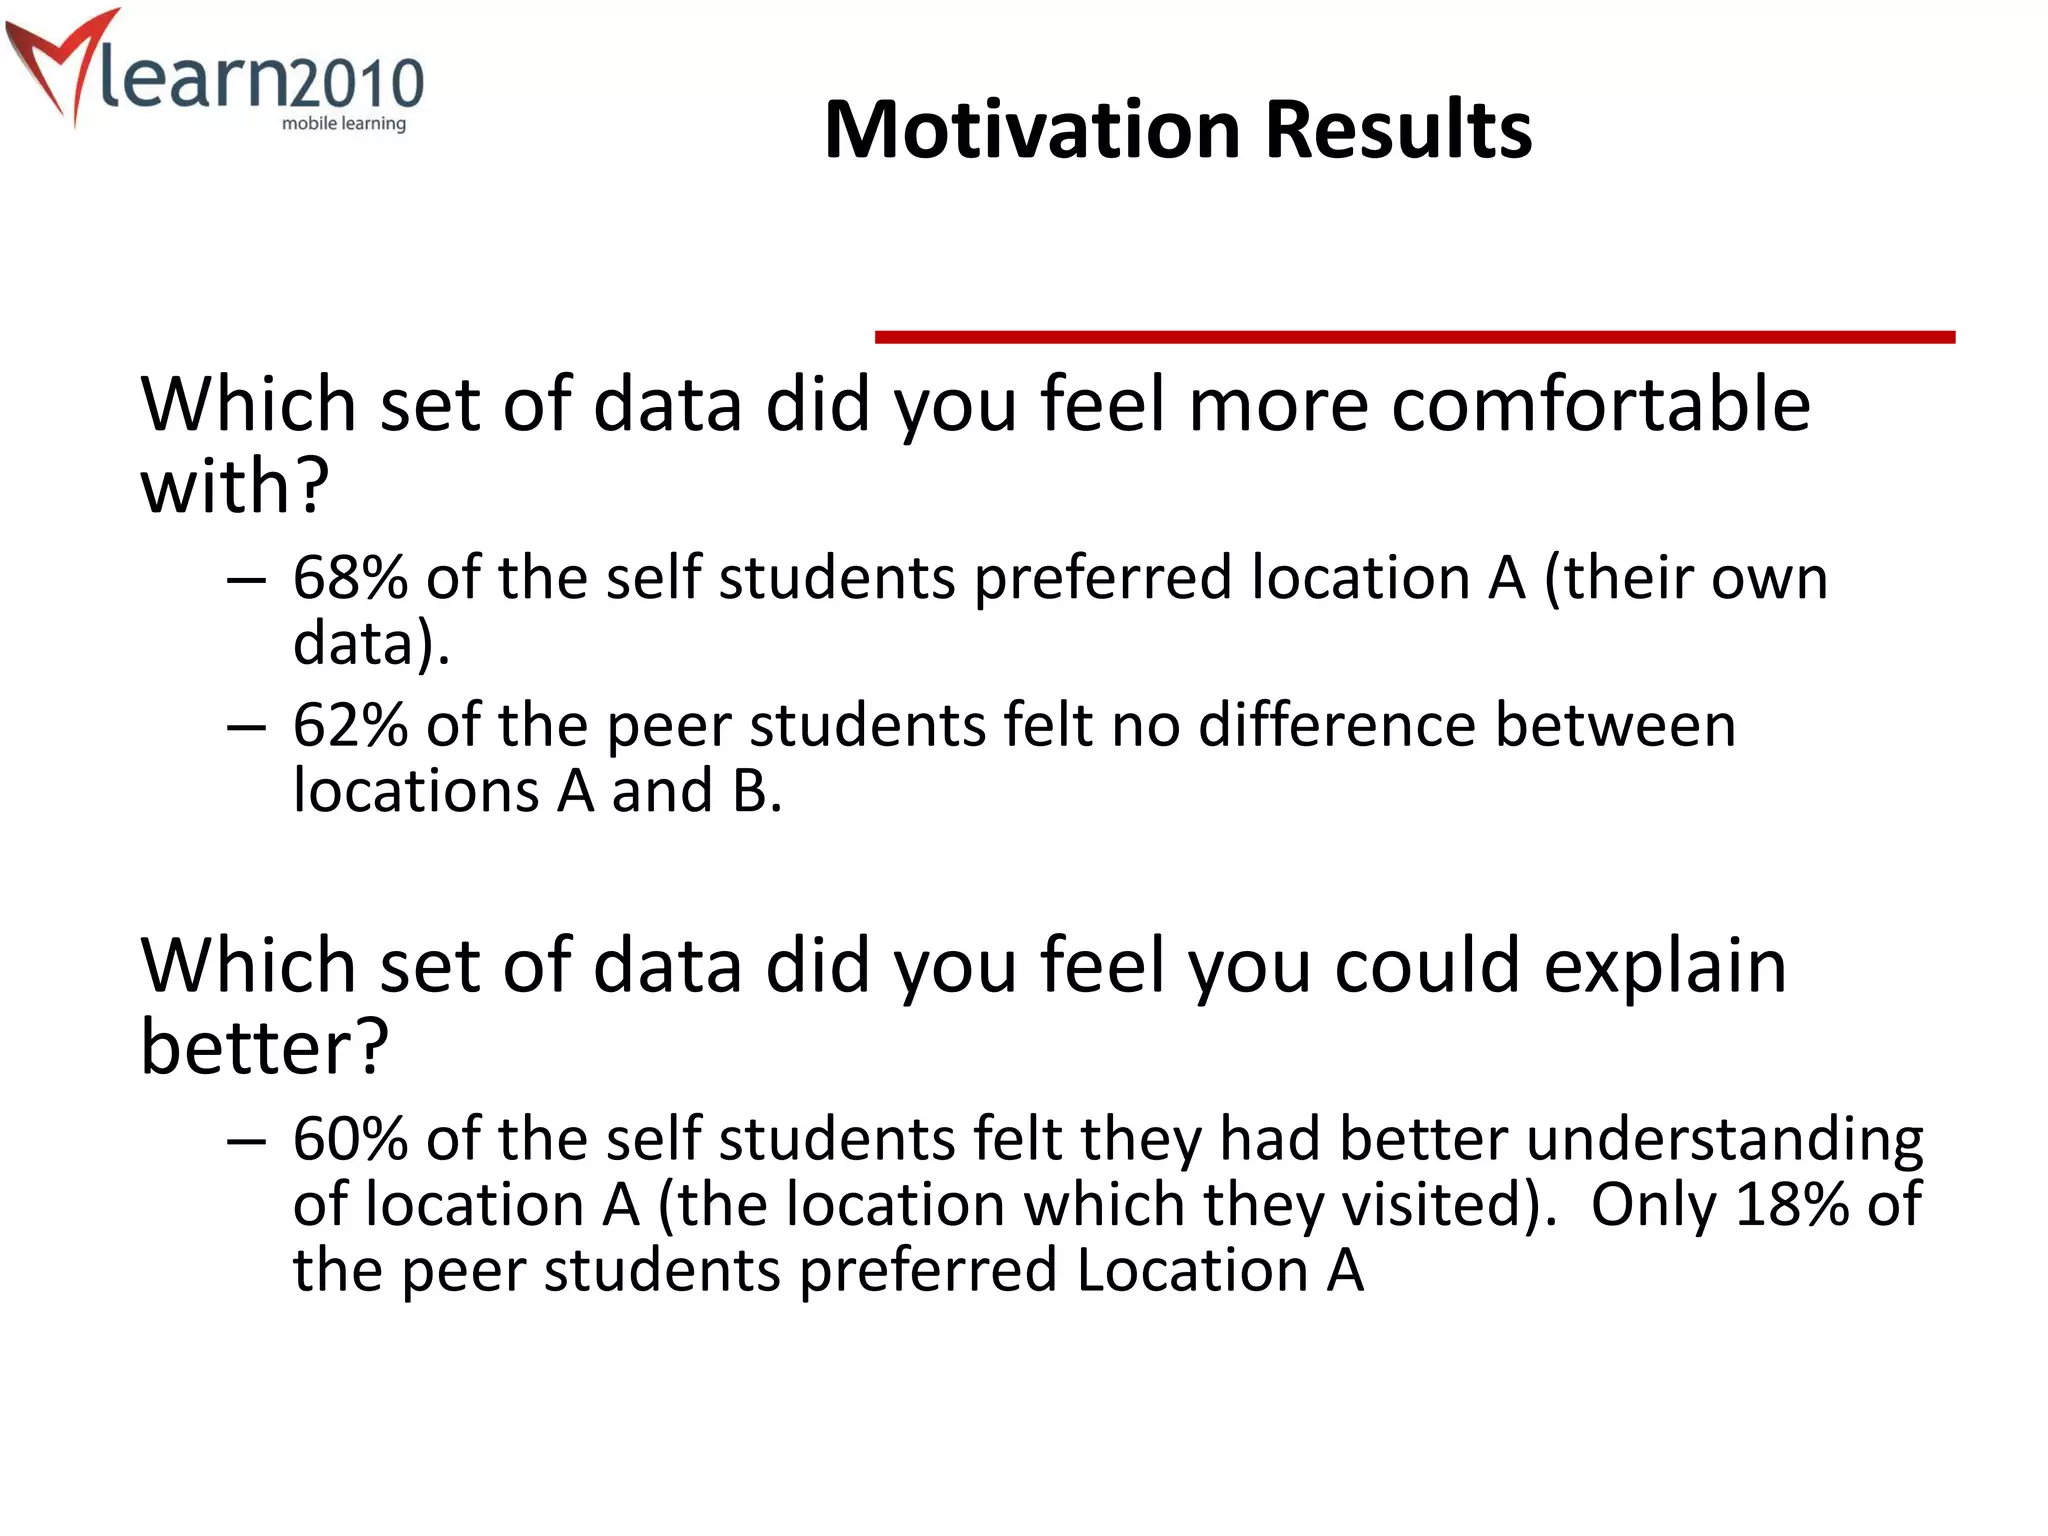
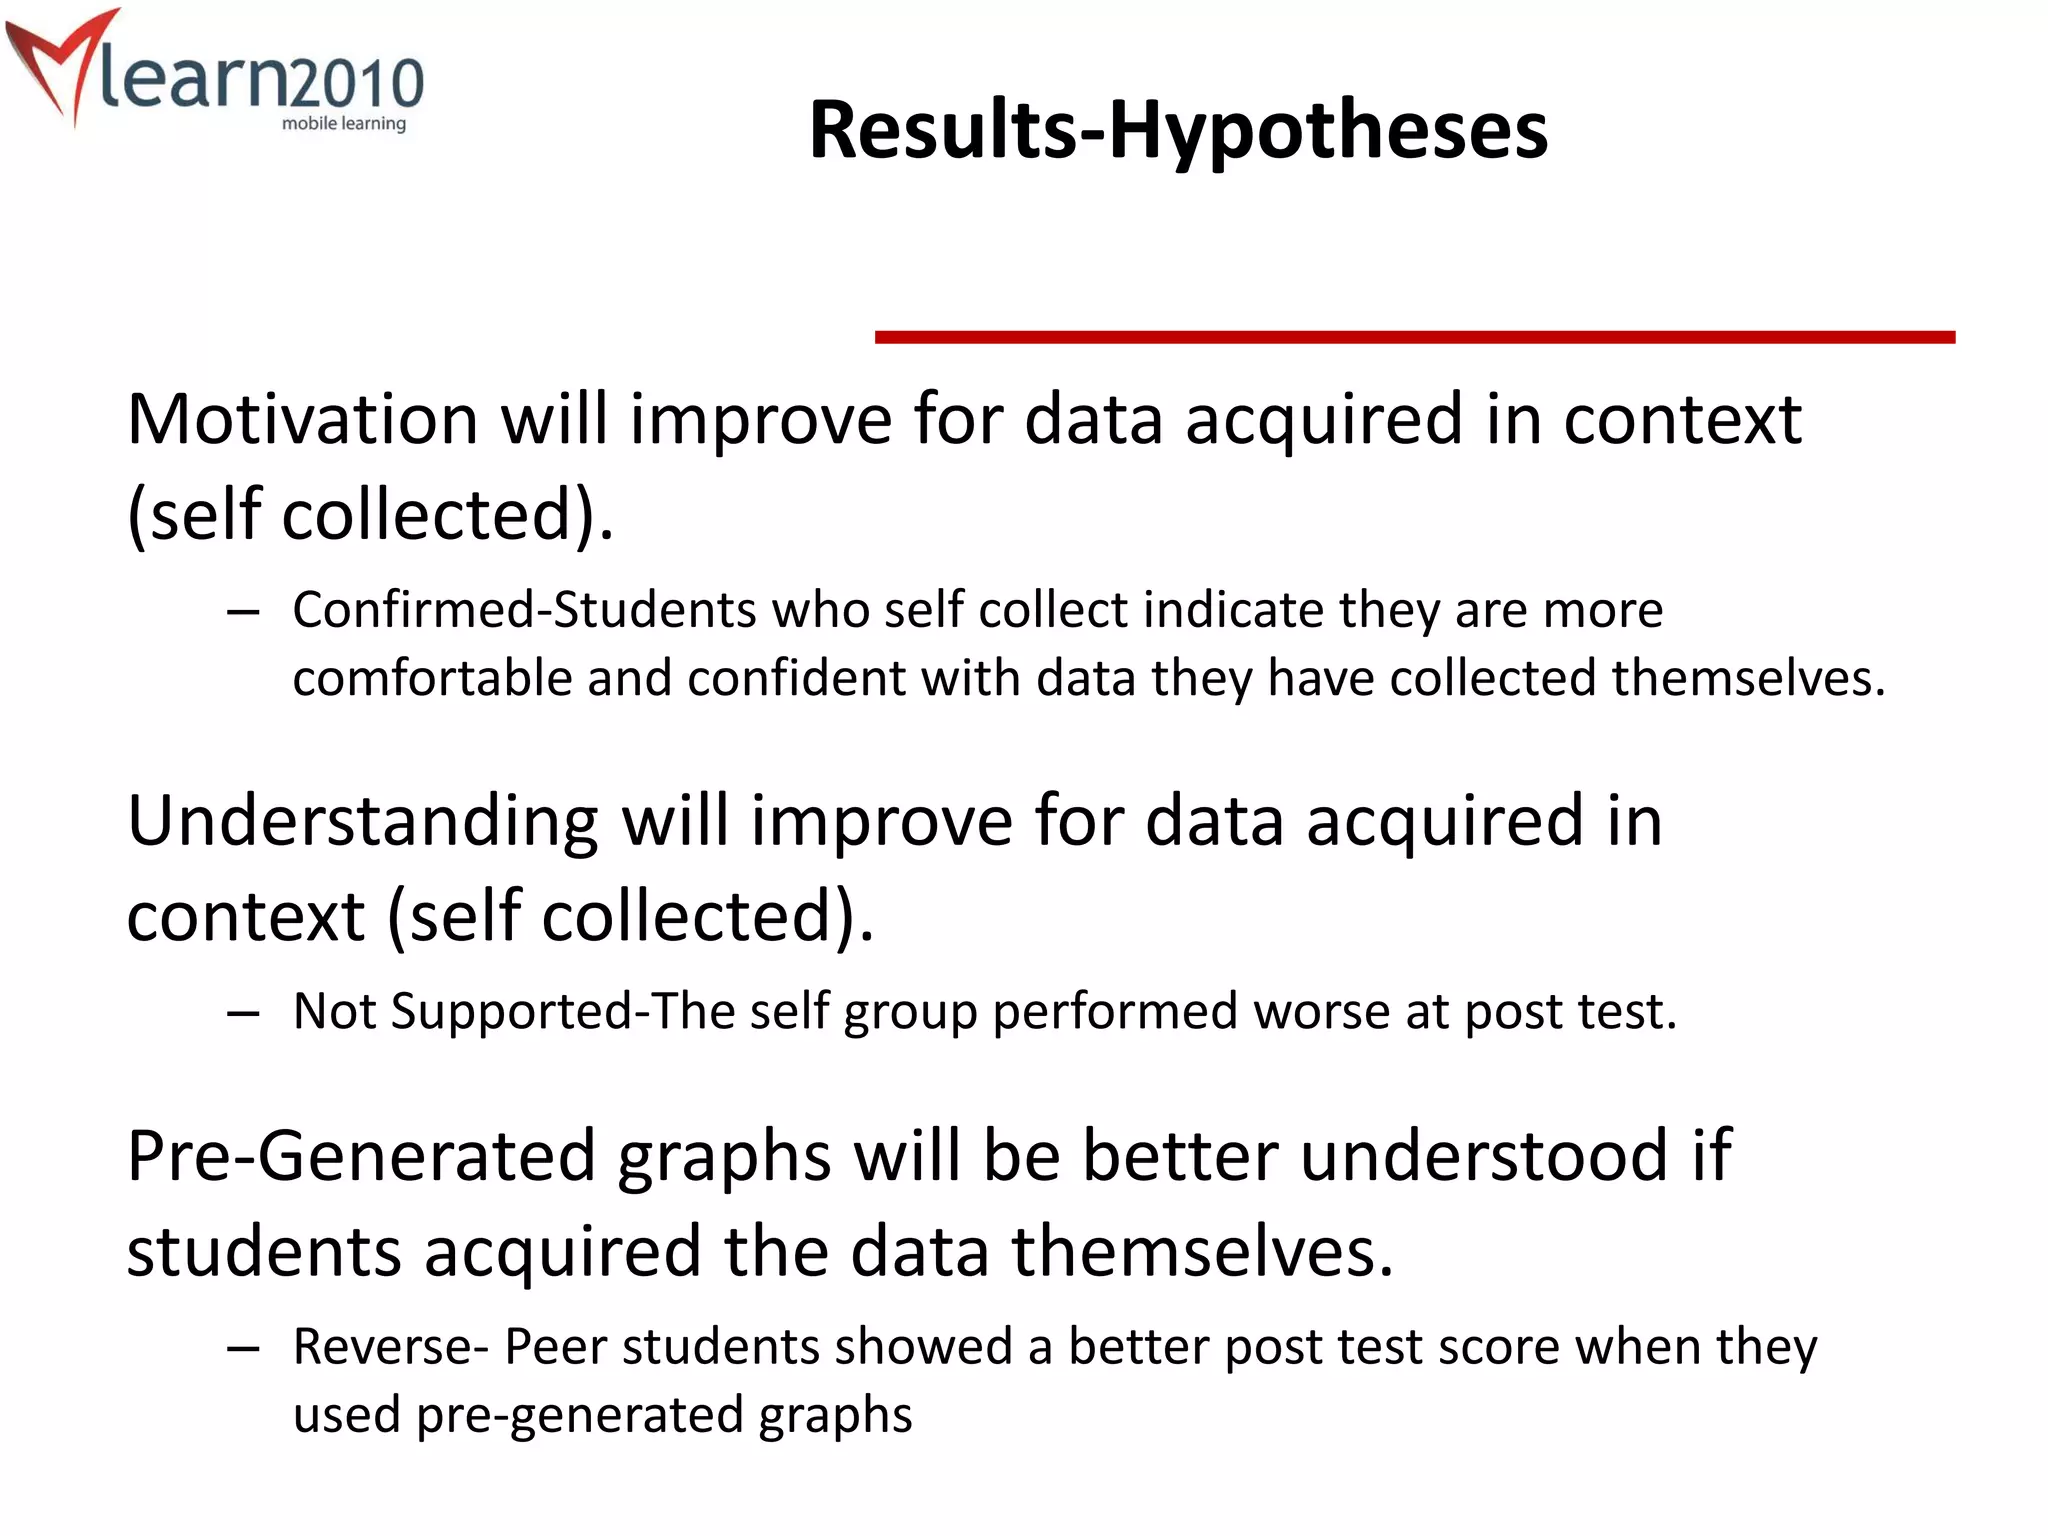
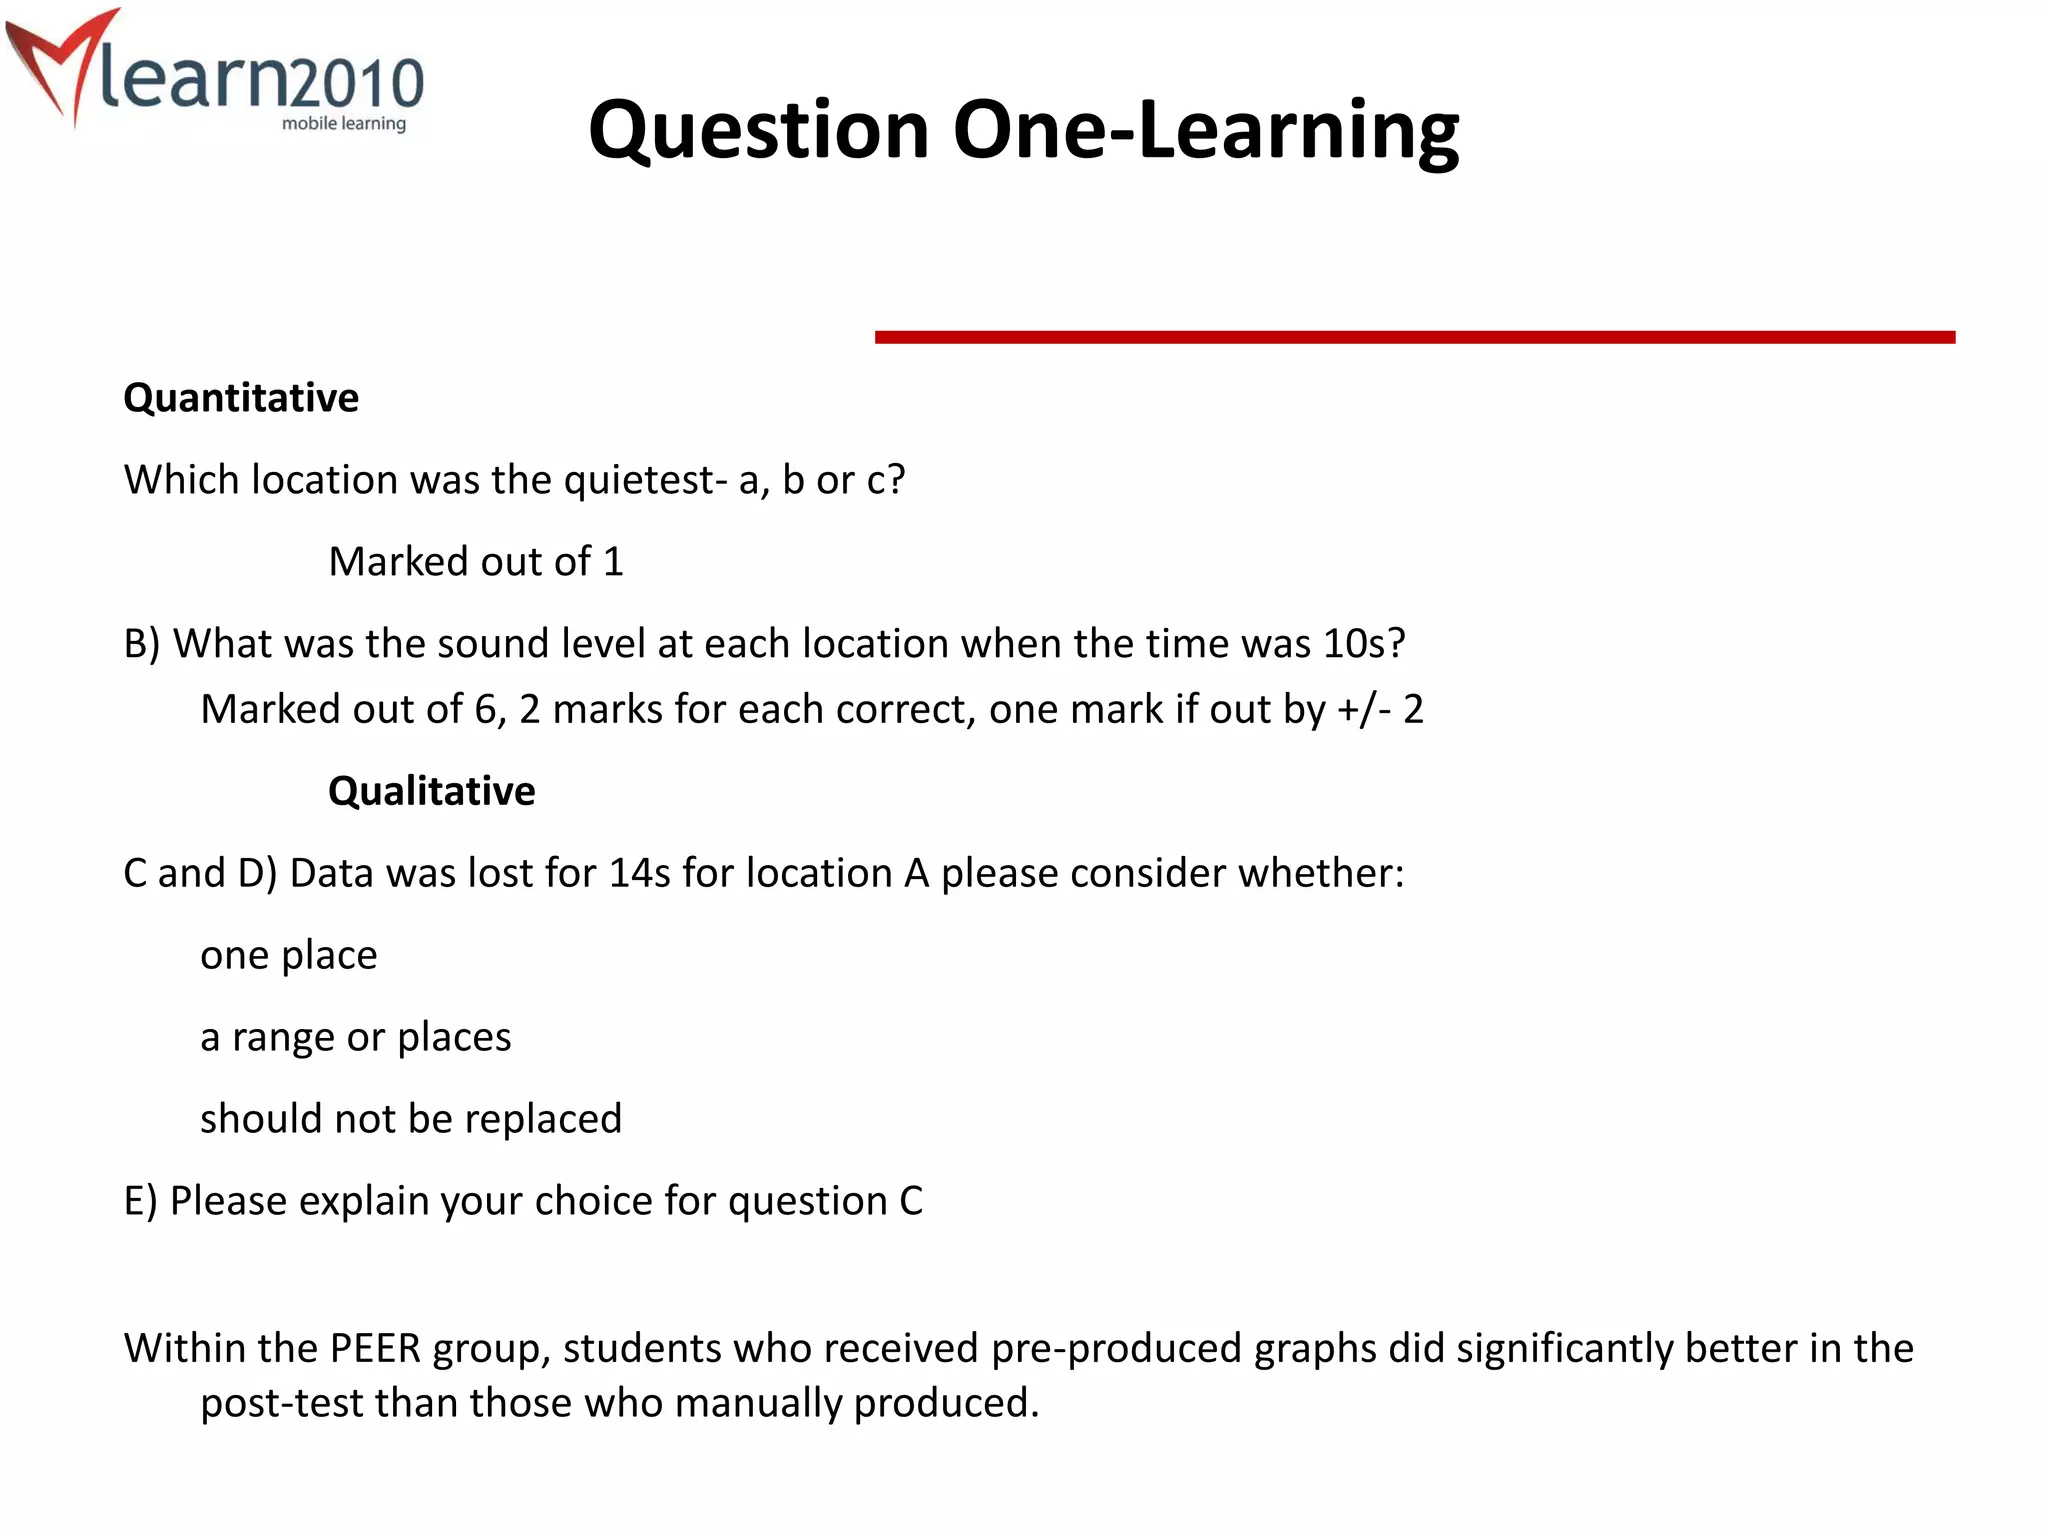
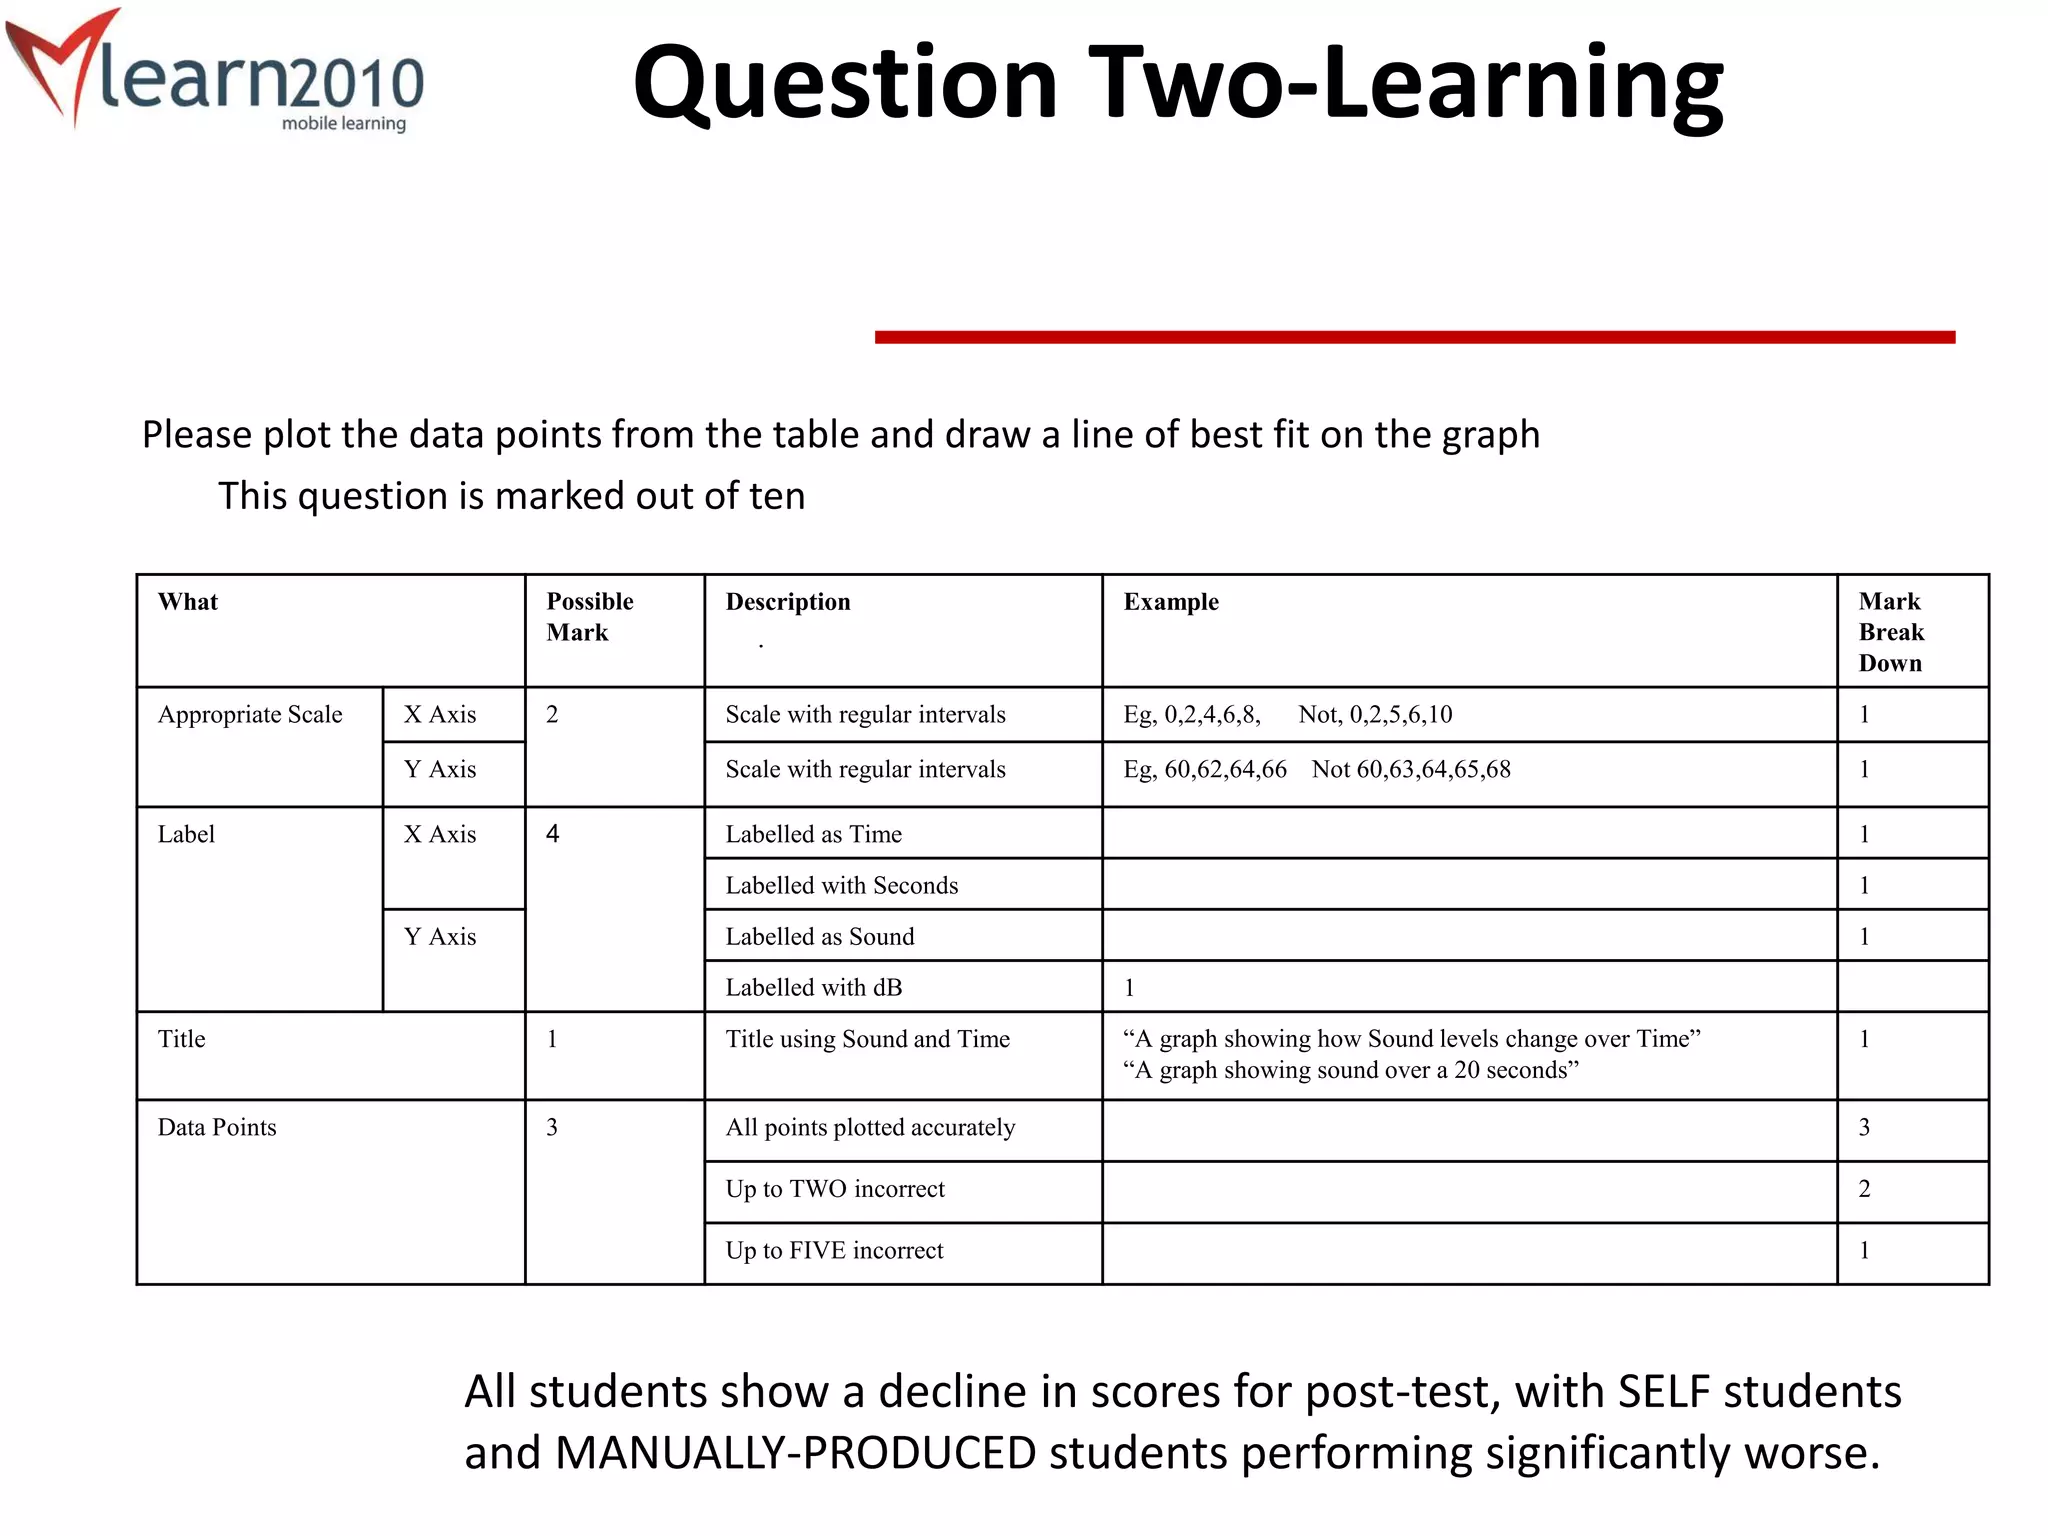
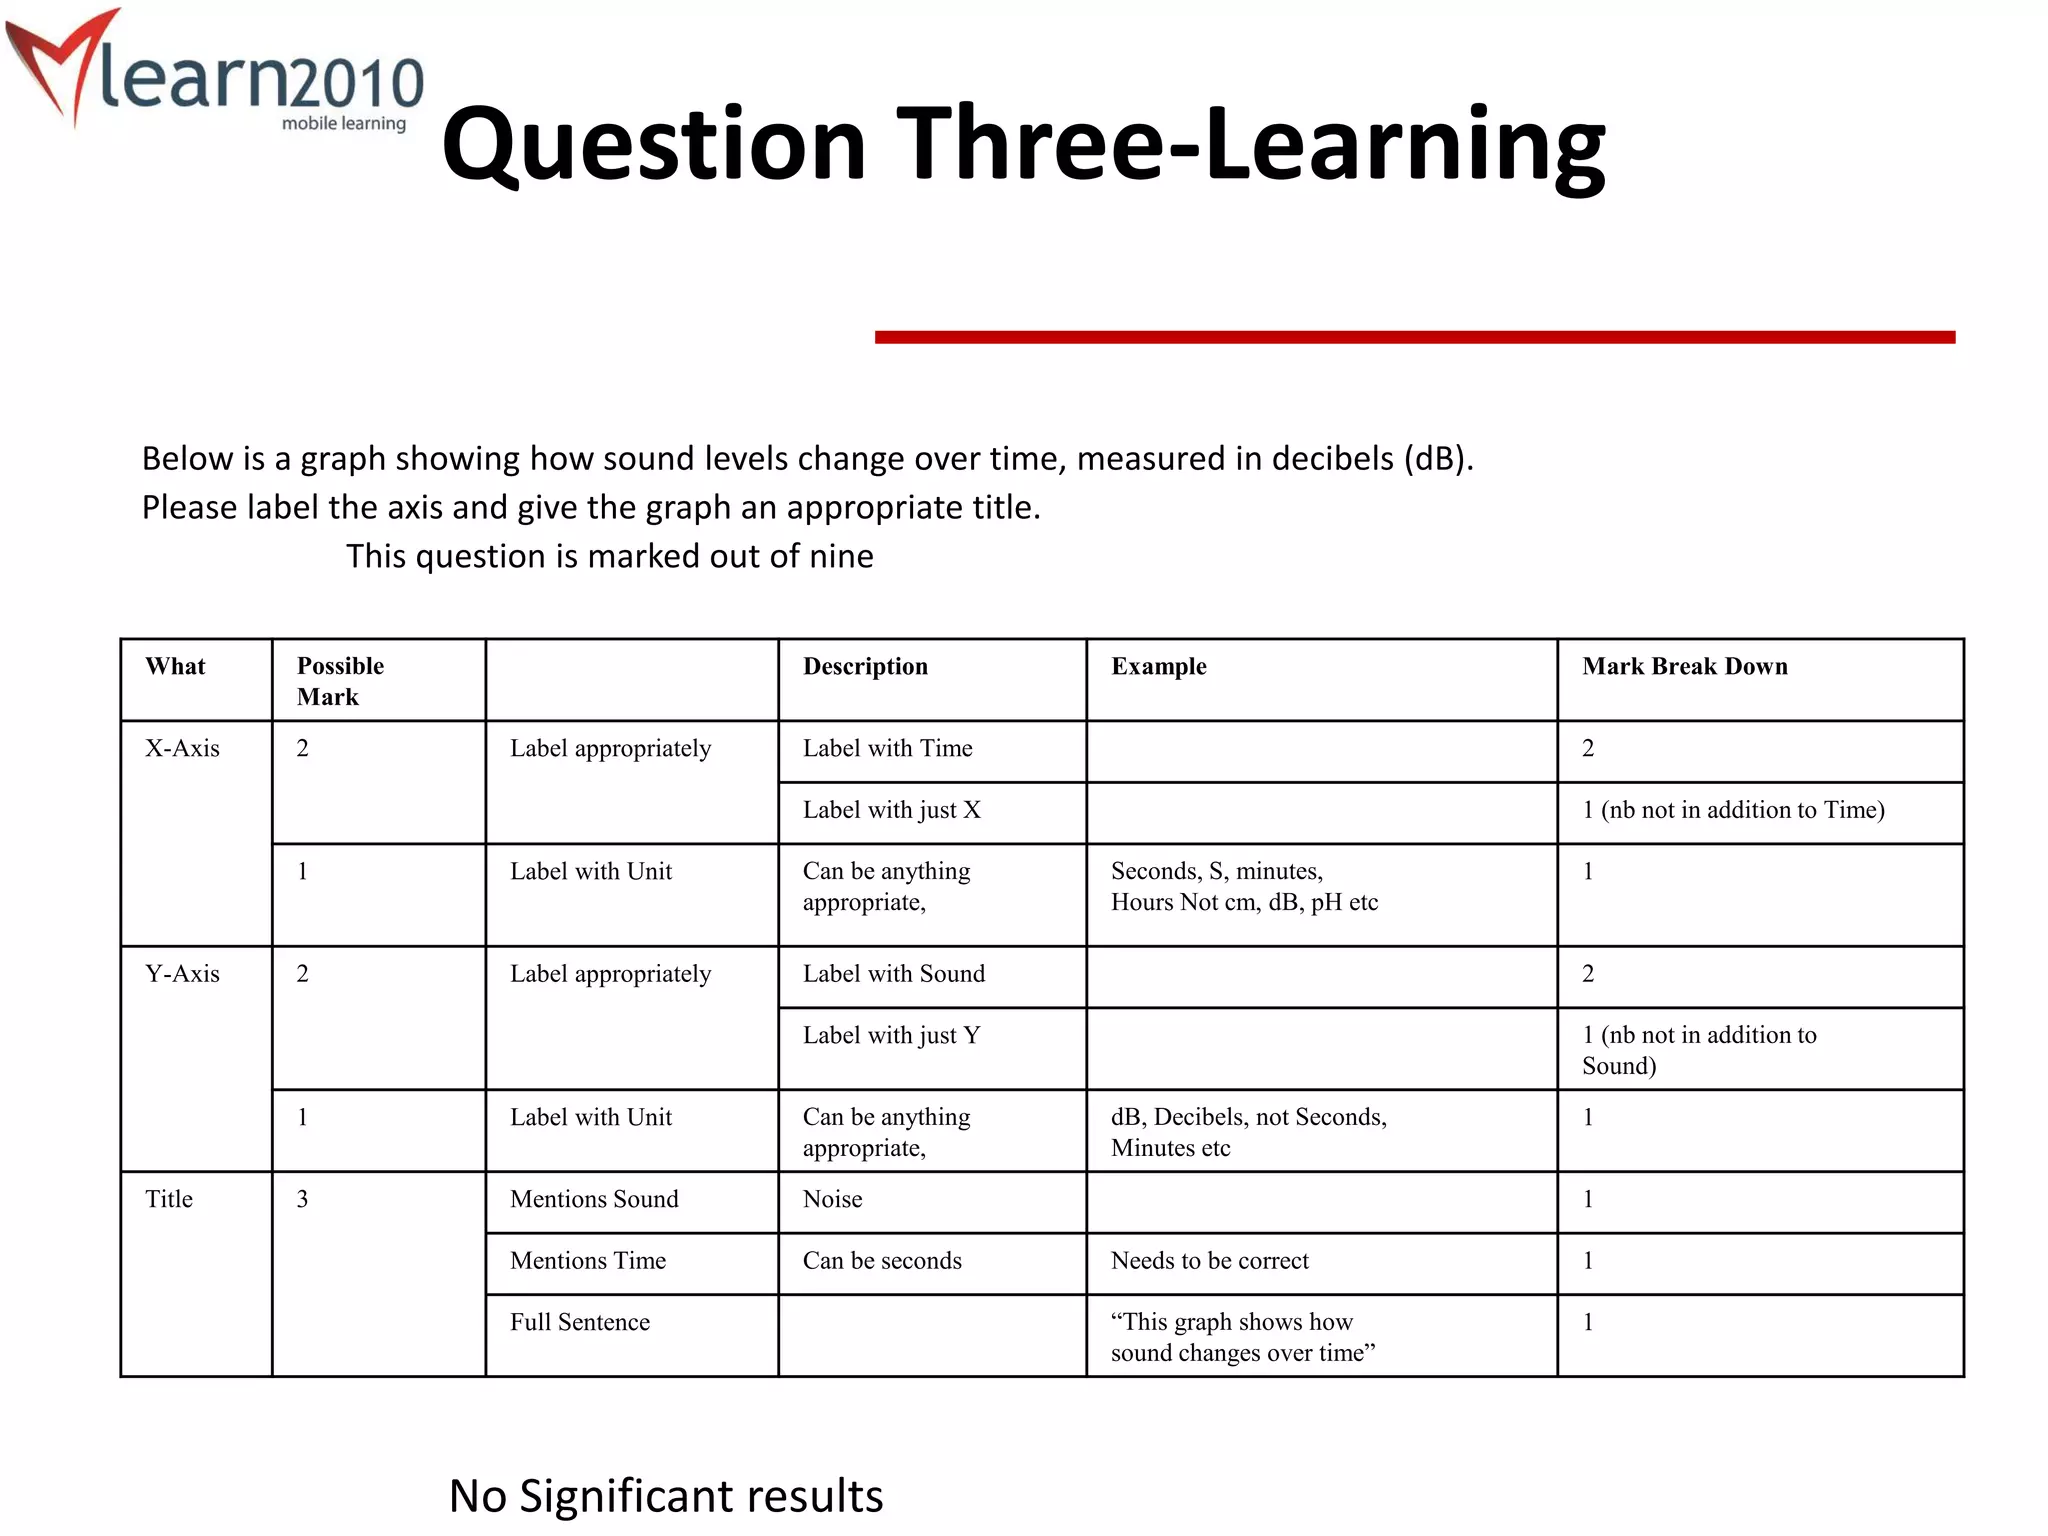
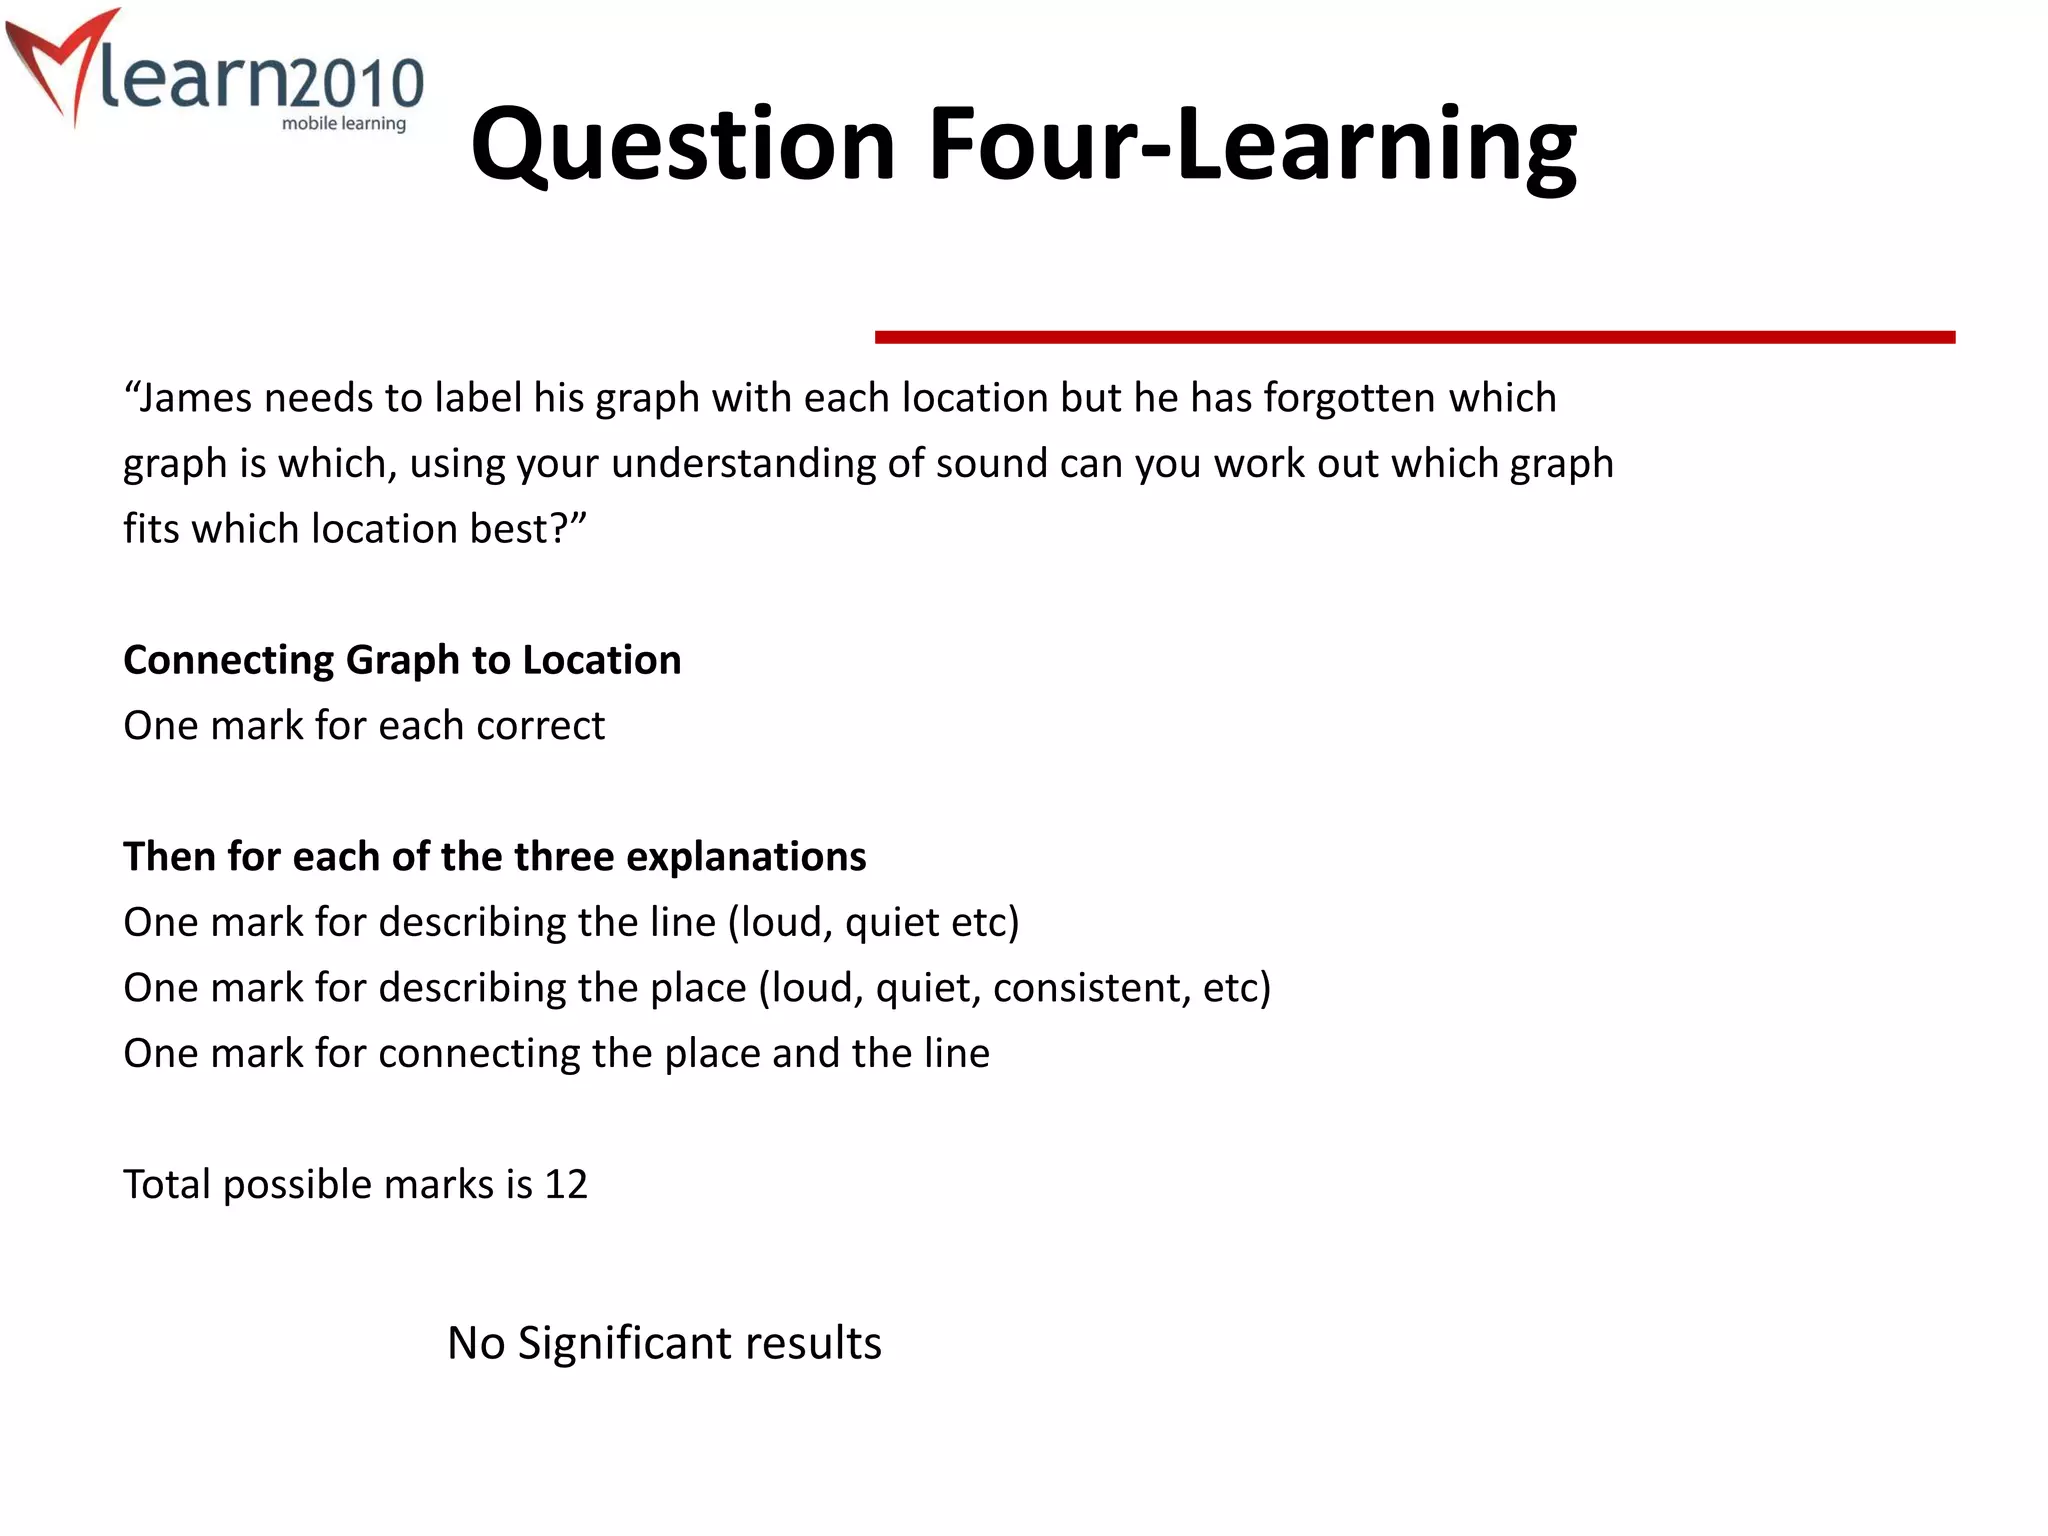
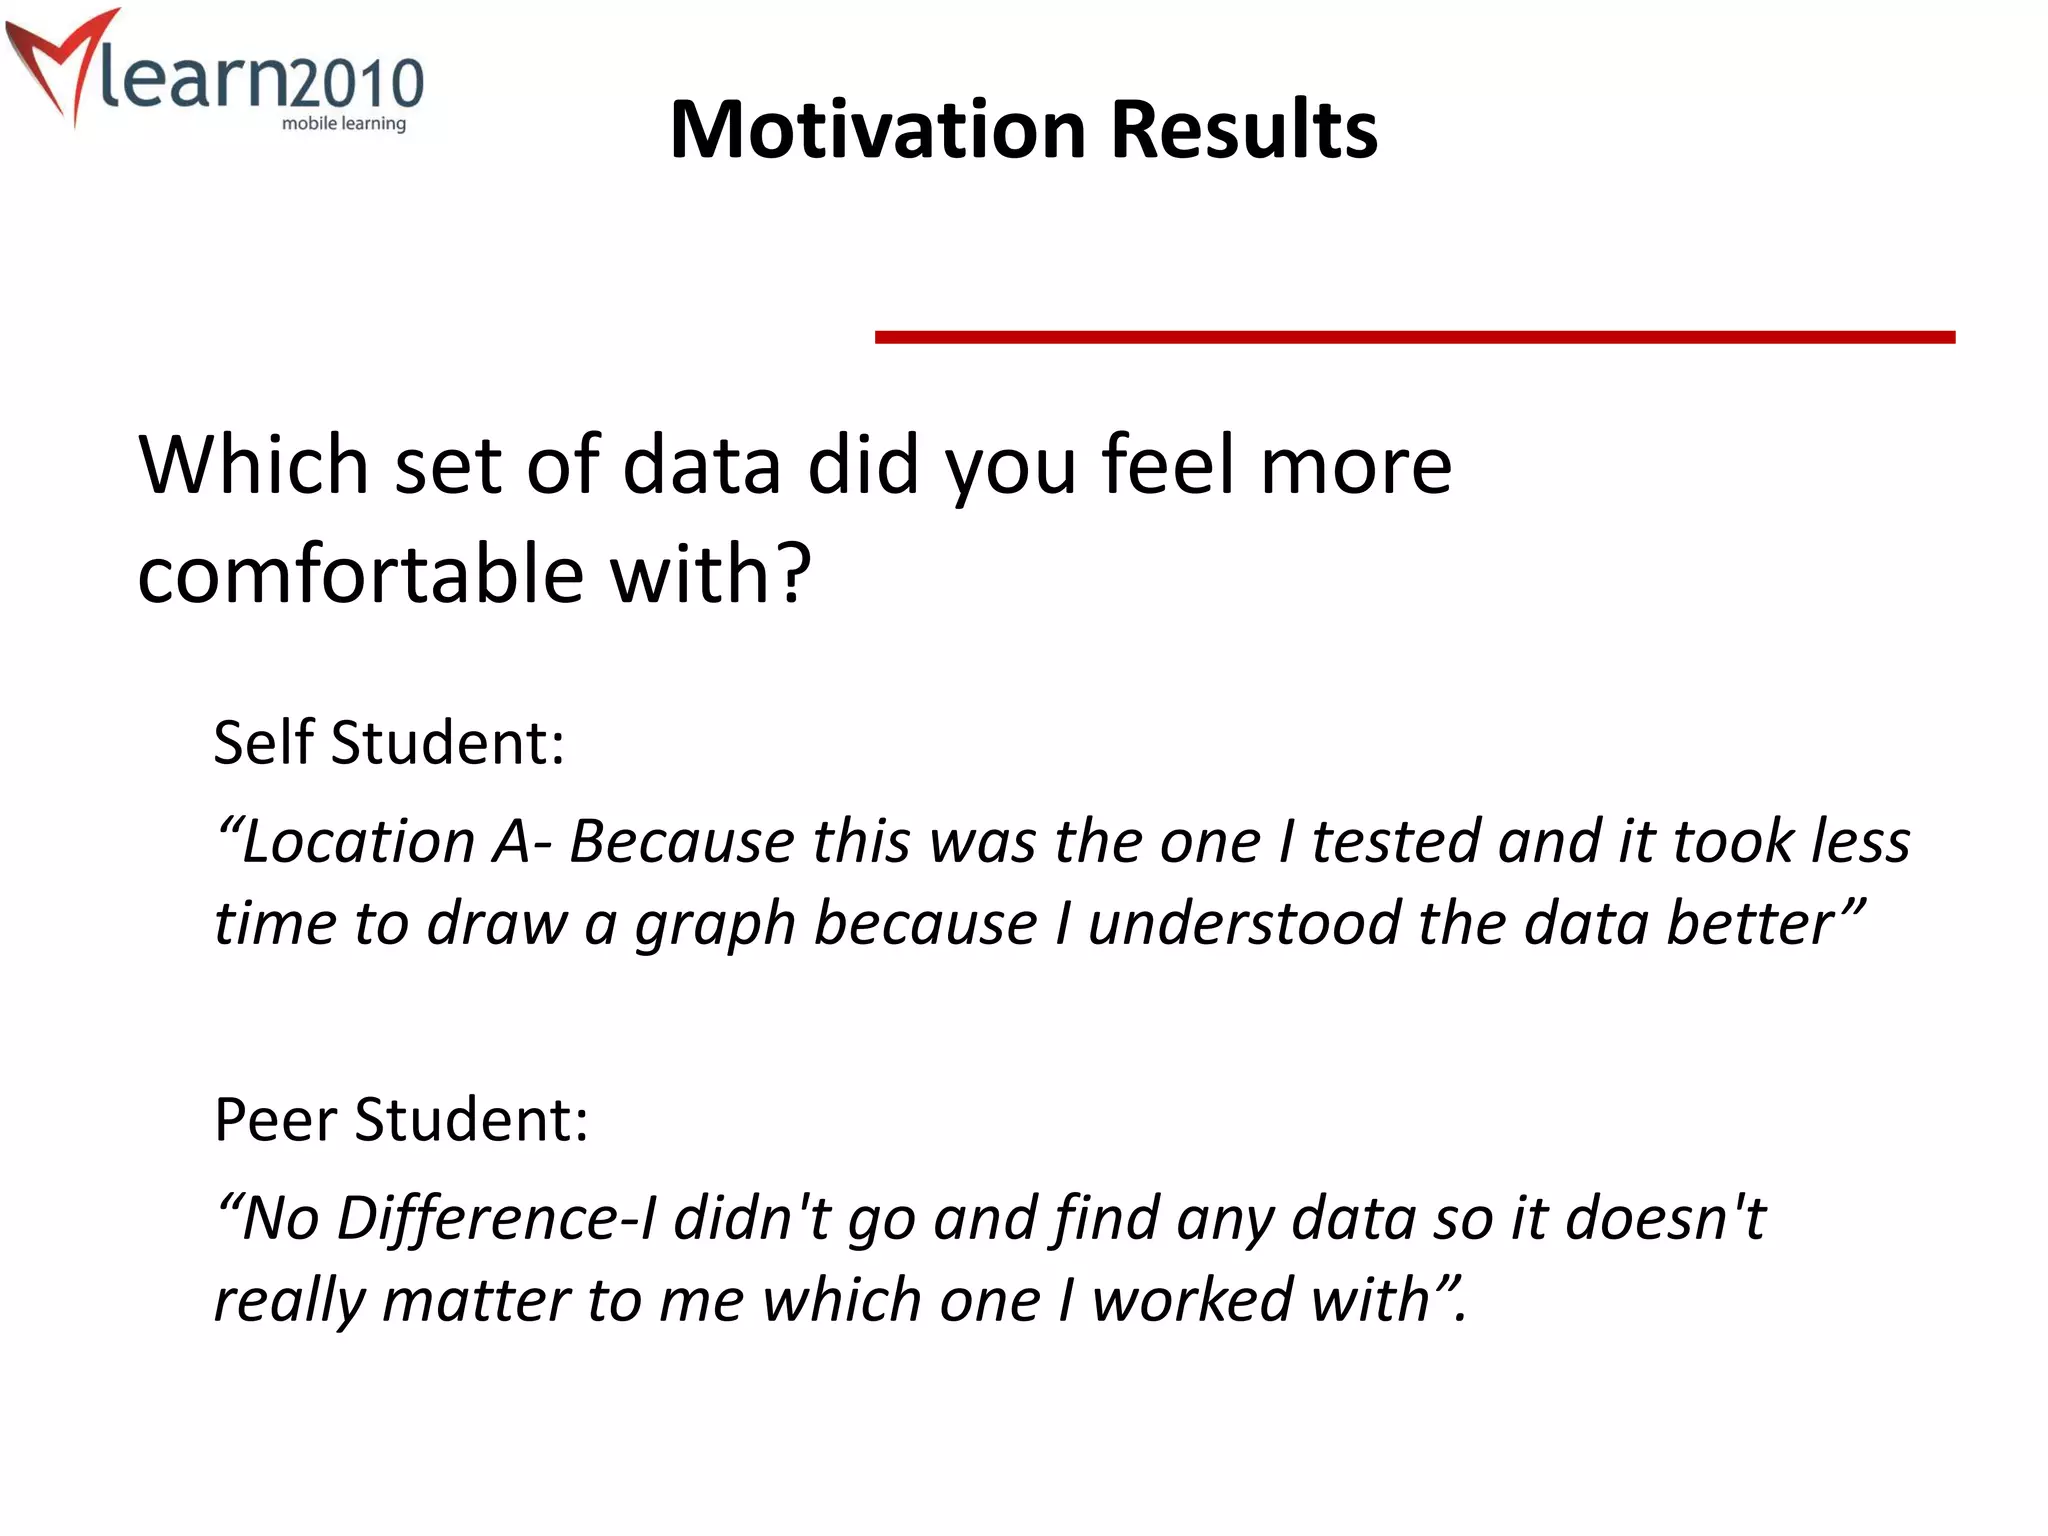
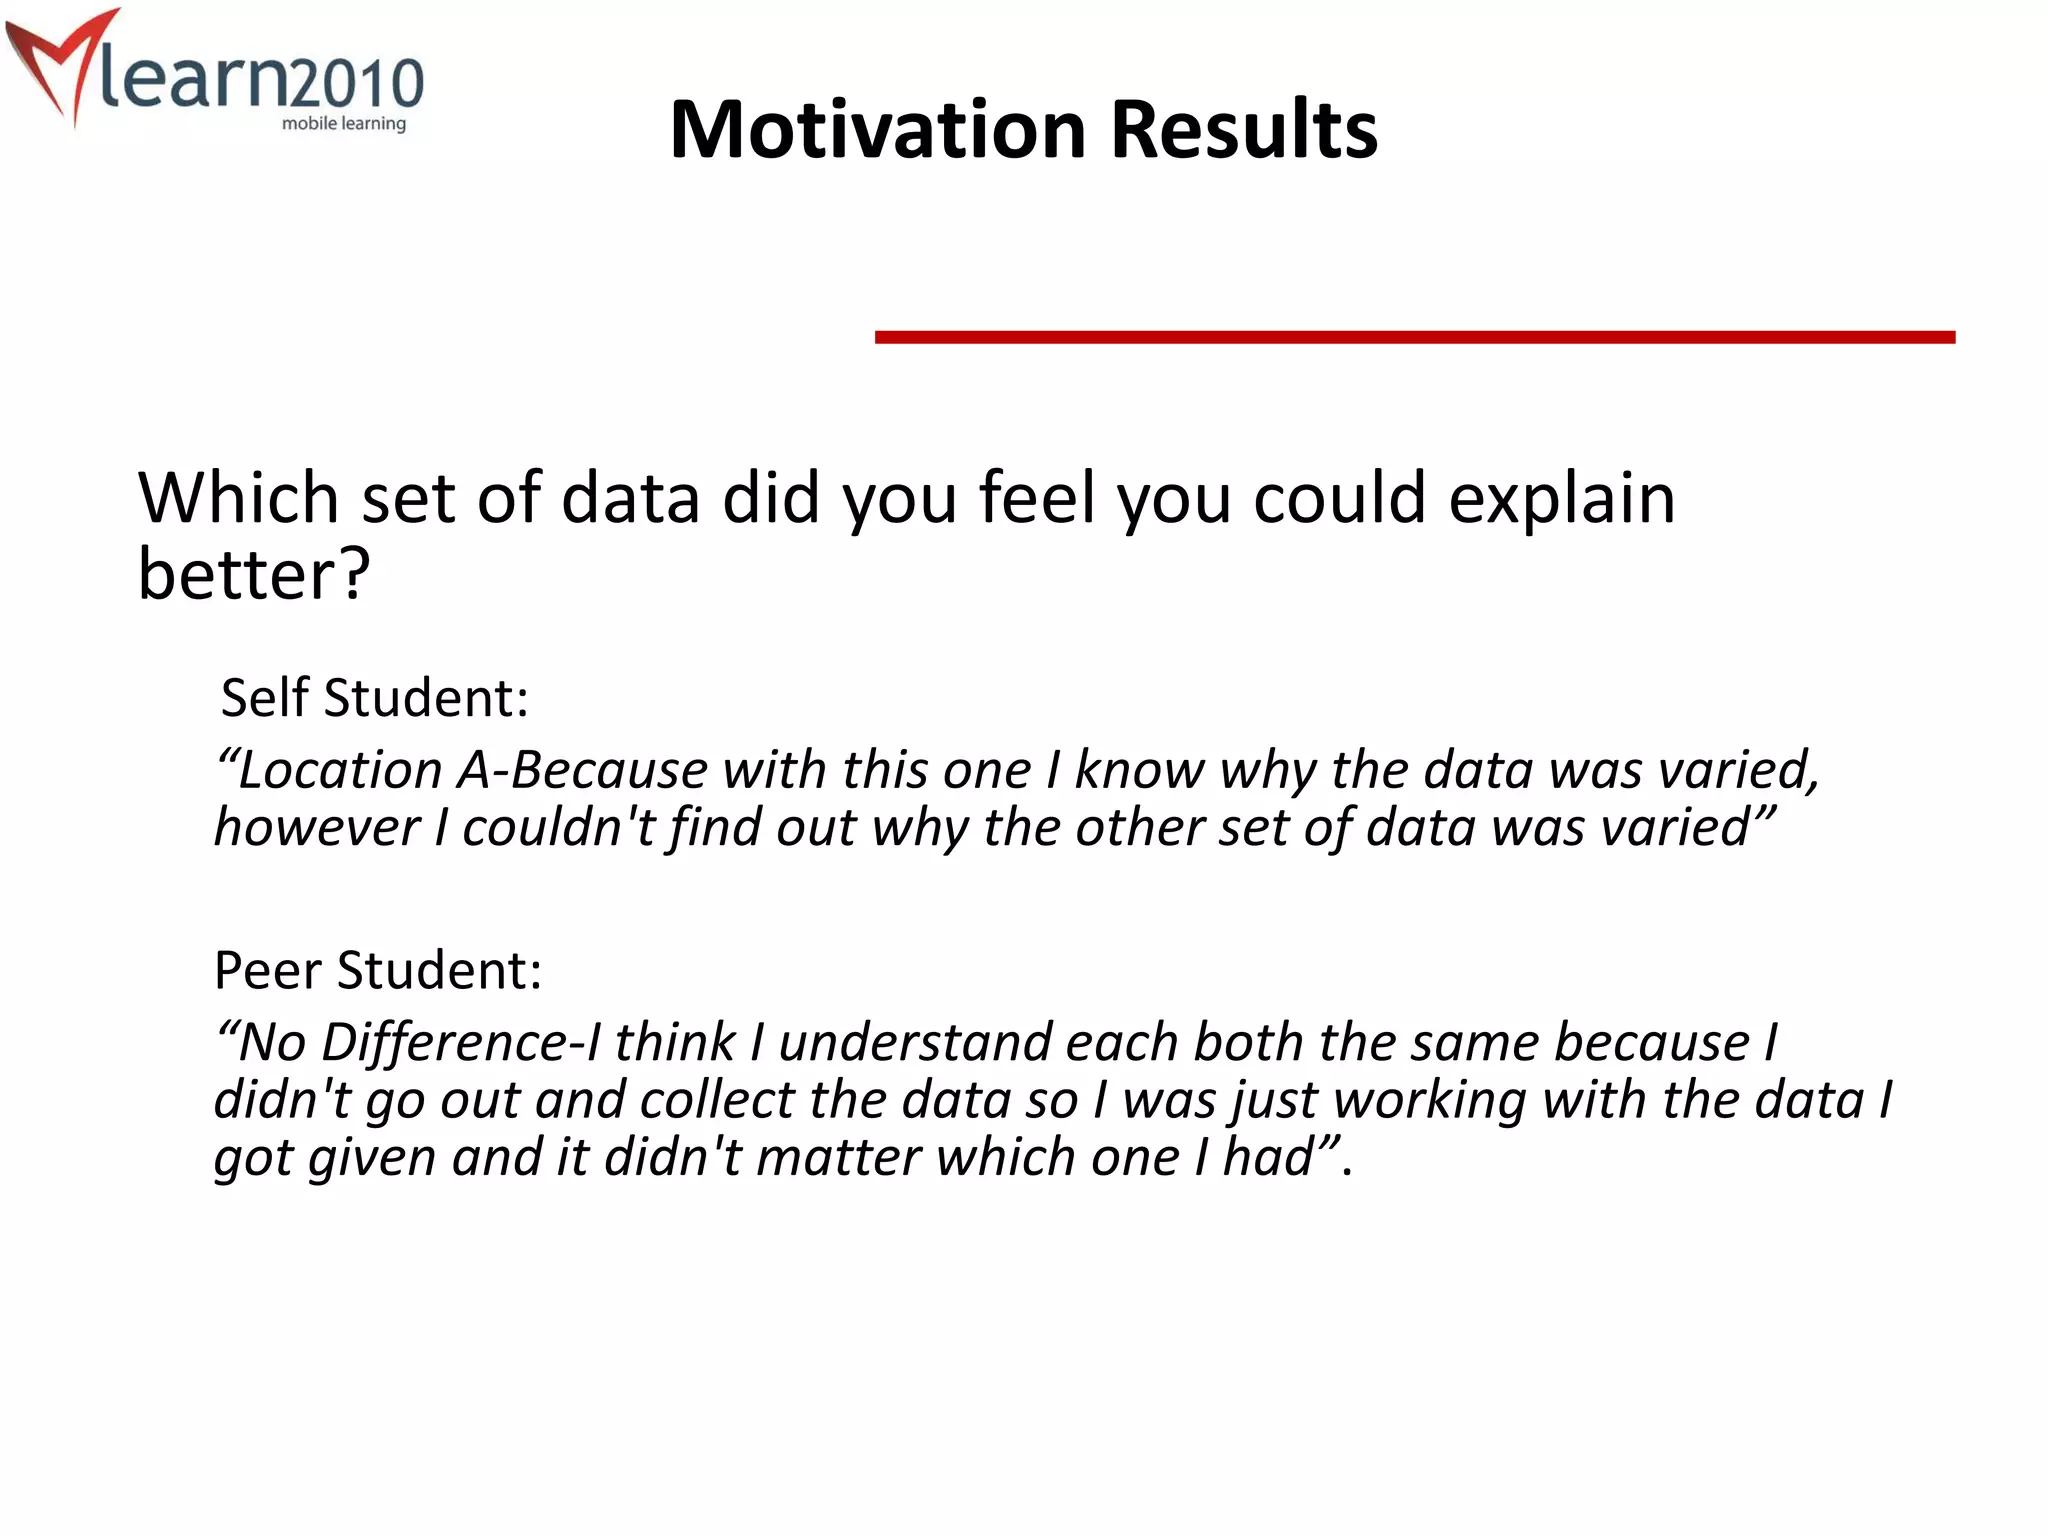
SlideShare a Scribd company logo
1 of 24
The Impact of Hand Held Mobile
Technologies upon Children’s
Motivation and Learning.
Susanna Martin
Department of Psychology, University of Bath
Danaë Stanton Fraser, Mike Fraser, Dawn Woodgate
and David Crellin.
Overview of Presentation
• Background
• Technology
• Hypotheses
• Process
• Results
• Implications
• Future
Background
• Engage children-Barton (1997)
• Ambient Wood-Rogers et al (2004)
• SENSE-Stanton Fraser et al (2005)
• Participate-Woodgate et al (2008)
Technology
Hypotheses
• Motivation will improve for data acquired in
context (self collected).
• Understanding will improve for data acquired in
context (self collected).
• Pre-generated graphs will be better understood if
students acquired the data themselves.
Participants
Three Schools, 46 Students (8 discounted)
– Age 12-14
– 14 Girls, 24 Boys
Grouping
– Collection
• 19 Self
• 19 Peer
– Presentation
• 14 Software
• 12 Pre-Produced
• 12 Manual
Process
Collection
• Self Collect
• 3 Sites
• Peer Collect
• Sound Lesson
Production
• Location A (Student / Partner Visited)
• Location B (Researcher Visited)
Presentation-Software
Presentation-Manual
Presentation-Pre Produced
Learning Results
Four Tests of Learning
– Draw, label, read from and identify data from graphs.
Two had significant results:
– Ability to read from a graph:
• A significant difference within the peer group.
– Students who used the pre-produced graphs had better post test
scores than those who manually produced graphs.
– Ability to draw a graph:
• All students showed decrease in scores.
– The self group showed a significant decrease.
– The manually produced group got significantly worse.
Motivation Results
5 Statements linked to motivation.
– Likert Scale
• I enjoy using computers to draw graphs
• I think collecting data is a waste of time
• I like working with data I have collected
– Three Choice Answer
• Which set of data did you feel more comfortable working with?
• Which set of data do you feel you can explain better?
Motivation Results
I think collecting data is a
waste of time
– Students who used pre-
produced graphs,
changed their view in a
positive direction
0
5
10
15
20
25
30
35
Strongly Agree Agree Neither Agree
nor Disagree
Disagree Strongly
Disagee
Pre-Test
Post-Test
I like working with data I have
collected
– Students who self collected
showed a positive change in
opinion.
0
10
20
30
40
50
60
70
Strongly Agree Agree Neither Agree
nor Disagree
Disagree Strongly
Disagee
Pre-Test
Post-Test
Motivation Results
Which set of data did you feel more comfortable
with?
– 68% of the self students preferred location A (their own
data).
– 62% of the peer students felt no difference between
locations A and B.
Which set of data did you feel you could explain
better?
– 60% of the self students felt they had better understanding
of location A (the location which they visited). Only 18% of
the peer students preferred Location A
Results-Hypotheses
Motivation will improve for data acquired in context
(self collected).
– Confirmed-Students who self collect indicate they are more
comfortable and confident with data they have collected themselves.
Understanding will improve for data acquired in
context (self collected).
– Not Supported-The self group performed worse at post test.
Pre-Generated graphs will be better understood if
students acquired the data themselves.
– Reverse- Peer students showed a better post test score when they
used pre-generated graphs
Implications
Ownership of data
– Has an impact on how students feel about data.
Interpretation
– Students may reflect differently dependent on
how the data is presented
Assessment
– Allowing students to qualify answers provides an
insight into the students reasoning process.
Future
Focus on the role of context
– Investigate further self collection but also the idea
of media contexts (photos, videos, text) to aid a
students concept of the data.
Longitudinal
– To provide a greater intervention period and to
reduce the possibility of novelty effects.
References
Barton, R. (1997) Does data logging change the nature of children’s thinking in experimental
work in science? In B. Somekh & N. Davis (eds.) Using IT effectively in teaching and learning:
studies in pre-service and in-service teacher education. London: Routledge. ISBN 0-415-
12131-0
Barton, R. (1998) Why do we ask pupils to plot graphs? Physics Education 33, 6, 366-367.
Rogers, Y., Price, S., Fitzpatrick, G., Fleck, R., Harris, E., Smith, H., Randell, C., Muller, H.,
O'Malley, C., Stanton, D., Thompson,M. and Weal, M. (2004). Ambient Wood: Designing
new forms of digital augmentation for learning outdoors. In Proc. Interaction Design and
Children. pp. 3-10.
Stanton Fraser, D., Smith, H., Tallyn, E., Kirk, D., Benford, S., Rowland, D., et al. (2005). The SENSE
project: a context-inclusive approach to studying environmental science within and across
schools. In Proc. Computer support for collaborative learning. Taiwan. pp. 155-159, May
2005.
Woodgate, D., Fraser, D., Paxton, M., Crellin, D., Woolard, A., Dillon, T., et al. (2008). Bringing
School Science to Life: Personalization, Contextualization and Reflection of Self-Collected
Data. Fifth IEEE International Conference on Wireless, Mobile, and Ubiquitous Technology in
Education (wmute 2008), 100-104. Ieee. doi: 10.1109/WMUTE.2008.35.
Question One-Learning
Quantitative
Which location was the quietest- a, b or c?
Marked out of 1
B) What was the sound level at each location when the time was 10s?
Marked out of 6, 2 marks for each correct, one mark if out by +/- 2
Qualitative
C and D) Data was lost for 14s for location A please consider whether:
one place
a range or places
should not be replaced
E) Please explain your choice for question C
Within the PEER group, students who received pre-produced graphs did significantly better in the
post-test than those who manually produced.
Question Two-Learning
Please plot the data points from the table and draw a line of best fit on the graph
This question is marked out of ten
What Possible
Mark
Description Example Mark
Break
Down
Appropriate Scale X Axis 2 Scale with regular intervals Eg, 0,2,4,6,8, Not, 0,2,5,6,10 1
Y Axis Scale with regular intervals Eg, 60,62,64,66 Not 60,63,64,65,68 1
Label X Axis 4 Labelled as Time 1
Labelled with Seconds 1
Y Axis Labelled as Sound 1
Labelled with dB 1
Title 1 Title using Sound and Time “A graph showing how Sound levels change over Time”
“A graph showing sound over a 20 seconds”
1
Data Points 3 All points plotted accurately 3
Up to TWO incorrect 2
Up to FIVE incorrect 1
All students show a decline in scores for post-test, with SELF students
and MANUALLY-PRODUCED students performing significantly worse.
Question Three-Learning
What Possible
Mark
Description Example Mark Break Down
X-Axis 2 Label appropriately Label with Time 2
Label with just X 1 (nb not in addition to Time)
1 Label with Unit Can be anything
appropriate,
Seconds, S, minutes,
Hours Not cm, dB, pH etc
1
Y-Axis 2 Label appropriately Label with Sound 2
Label with just Y 1 (nb not in addition to
Sound)
1 Label with Unit Can be anything
appropriate,
dB, Decibels, not Seconds,
Minutes etc
1
Title 3 Mentions Sound Noise 1
Mentions Time Can be seconds Needs to be correct 1
Full Sentence “This graph shows how
sound changes over time”
1
Below is a graph showing how sound levels change over time, measured in decibels (dB).
Please label the axis and give the graph an appropriate title.
This question is marked out of nine
No Significant results
Question Four-Learning
“James needs to label his graph with each location but he has forgotten which
graph is which, using your understanding of sound can you work out which graph
fits which location best?”
Connecting Graph to Location
One mark for each correct
Then for each of the three explanations
One mark for describing the line (loud, quiet etc)
One mark for describing the place (loud, quiet, consistent, etc)
One mark for connecting the place and the line
Total possible marks is 12
No Significant results
Motivation Results
Which set of data did you feel more
comfortable with?
Self Student:
“Location A- Because this was the one I tested and it took less
time to draw a graph because I understood the data better”
Peer Student:
“No Difference-I didn't go and find any data so it doesn't
really matter to me which one I worked with”.
Motivation Results
Which set of data did you feel you could explain
better?
Self Student:
“Location A-Because with this one I know why the data was varied,
however I couldn't find out why the other set of data was varied”
Peer Student:
“No Difference-I think I understand each both the same because I
didn't go out and collect the data so I was just working with the data I
got given and it didn't matter which one I had”.

More Related Content

What's hot

Putting the Mathematical Practices Into Action
Putting the Mathematical Practices Into ActionPutting the Mathematical Practices Into Action
Putting the Mathematical Practices Into Actiondlschulz
 
Assessment & Feedback in Mathematics Colleen Young
Assessment & Feedback in Mathematics Colleen YoungAssessment & Feedback in Mathematics Colleen Young
Assessment & Feedback in Mathematics Colleen YoungColleen Young
 
Designing interactive representations for learning fractions
Designing interactive representations for learning fractionsDesigning interactive representations for learning fractions
Designing interactive representations for learning fractionsitalk2learn
 
Oral Presentstion 1 Andrew
Oral Presentstion 1 AndrewOral Presentstion 1 Andrew
Oral Presentstion 1 Andrewguest19cc722
 
Ma sampletest-hs 2010-13
Ma sampletest-hs 2010-13Ma sampletest-hs 2010-13
Ma sampletest-hs 2010-13Erlinda Rey
 
Qualitative approaches to learning analytics
Qualitative approaches to learning analyticsQualitative approaches to learning analytics
Qualitative approaches to learning analyticsRebecca Ferguson
 
Connect with Maths ~Maths leadership series- Session 3- the right knowledge
Connect with Maths ~Maths leadership series- Session 3- the right knowledgeConnect with Maths ~Maths leadership series- Session 3- the right knowledge
Connect with Maths ~Maths leadership series- Session 3- the right knowledgeRenee Hoareau
 
Birmingham Assessment and Feedback Symposium
Birmingham Assessment and Feedback Symposium Birmingham Assessment and Feedback Symposium
Birmingham Assessment and Feedback Symposium Tansy Jessop
 
Connect with Maths~ Maths Leadership Series-session 2-the right pedagogy
Connect with Maths~ Maths Leadership Series-session 2-the right pedagogyConnect with Maths~ Maths Leadership Series-session 2-the right pedagogy
Connect with Maths~ Maths Leadership Series-session 2-the right pedagogyRenee Hoareau
 
Connect with Maths Leadership Series: Session 1- the right team
Connect with Maths Leadership Series: Session 1- the right teamConnect with Maths Leadership Series: Session 1- the right team
Connect with Maths Leadership Series: Session 1- the right teamRenee Hoareau
 
Problem solving method ppt
Problem solving method pptProblem solving method ppt
Problem solving method pptTHIRUMAGAL K.D
 
IHOTS CONSUMER PRESENTATION
IHOTS CONSUMER PRESENTATIONIHOTS CONSUMER PRESENTATION
IHOTS CONSUMER PRESENTATIONRadhika Gowda
 
Calculation for a new Maths Curriculum
Calculation for a new Maths CurriculumCalculation for a new Maths Curriculum
Calculation for a new Maths CurriculumSt_chris_learning
 
DETECTING AND IMPROVING STUDENT EMOTIONS USING ACTIONABLE PATTERN DISCOVERY I...
DETECTING AND IMPROVING STUDENT EMOTIONS USING ACTIONABLE PATTERN DISCOVERY I...DETECTING AND IMPROVING STUDENT EMOTIONS USING ACTIONABLE PATTERN DISCOVERY I...
DETECTING AND IMPROVING STUDENT EMOTIONS USING ACTIONABLE PATTERN DISCOVERY I...adeij1
 
Physics grading keynote
Physics grading keynotePhysics grading keynote
Physics grading keynoteoccam98
 
Fostering Curriculum Development Through Artesol 2010
Fostering Curriculum Development Through Artesol 2010Fostering Curriculum Development Through Artesol 2010
Fostering Curriculum Development Through Artesol 2010shierl
 

What's hot (20)

Putting the Mathematical Practices Into Action
Putting the Mathematical Practices Into ActionPutting the Mathematical Practices Into Action
Putting the Mathematical Practices Into Action
 
Assessment & Feedback in Mathematics Colleen Young
Assessment & Feedback in Mathematics Colleen YoungAssessment & Feedback in Mathematics Colleen Young
Assessment & Feedback in Mathematics Colleen Young
 
Designing interactive representations for learning fractions
Designing interactive representations for learning fractionsDesigning interactive representations for learning fractions
Designing interactive representations for learning fractions
 
Math difficulties
Math difficultiesMath difficulties
Math difficulties
 
Oral Presentstion 1 Andrew
Oral Presentstion 1 AndrewOral Presentstion 1 Andrew
Oral Presentstion 1 Andrew
 
Rankin VE NBCDI 10-2012
Rankin VE NBCDI 10-2012Rankin VE NBCDI 10-2012
Rankin VE NBCDI 10-2012
 
Ma sampletest-hs 2010-13
Ma sampletest-hs 2010-13Ma sampletest-hs 2010-13
Ma sampletest-hs 2010-13
 
Qualitative approaches to learning analytics
Qualitative approaches to learning analyticsQualitative approaches to learning analytics
Qualitative approaches to learning analytics
 
Connect with Maths ~Maths leadership series- Session 3- the right knowledge
Connect with Maths ~Maths leadership series- Session 3- the right knowledgeConnect with Maths ~Maths leadership series- Session 3- the right knowledge
Connect with Maths ~Maths leadership series- Session 3- the right knowledge
 
Don’t fal out techno in
Don’t fal out techno inDon’t fal out techno in
Don’t fal out techno in
 
Birmingham Assessment and Feedback Symposium
Birmingham Assessment and Feedback Symposium Birmingham Assessment and Feedback Symposium
Birmingham Assessment and Feedback Symposium
 
Connect with Maths~ Maths Leadership Series-session 2-the right pedagogy
Connect with Maths~ Maths Leadership Series-session 2-the right pedagogyConnect with Maths~ Maths Leadership Series-session 2-the right pedagogy
Connect with Maths~ Maths Leadership Series-session 2-the right pedagogy
 
Connect with Maths Leadership Series: Session 1- the right team
Connect with Maths Leadership Series: Session 1- the right teamConnect with Maths Leadership Series: Session 1- the right team
Connect with Maths Leadership Series: Session 1- the right team
 
Problem solving method ppt
Problem solving method pptProblem solving method ppt
Problem solving method ppt
 
IHOTS CONSUMER PRESENTATION
IHOTS CONSUMER PRESENTATIONIHOTS CONSUMER PRESENTATION
IHOTS CONSUMER PRESENTATION
 
2008 06
2008 062008 06
2008 06
 
Calculation for a new Maths Curriculum
Calculation for a new Maths CurriculumCalculation for a new Maths Curriculum
Calculation for a new Maths Curriculum
 
DETECTING AND IMPROVING STUDENT EMOTIONS USING ACTIONABLE PATTERN DISCOVERY I...
DETECTING AND IMPROVING STUDENT EMOTIONS USING ACTIONABLE PATTERN DISCOVERY I...DETECTING AND IMPROVING STUDENT EMOTIONS USING ACTIONABLE PATTERN DISCOVERY I...
DETECTING AND IMPROVING STUDENT EMOTIONS USING ACTIONABLE PATTERN DISCOVERY I...
 
Physics grading keynote
Physics grading keynotePhysics grading keynote
Physics grading keynote
 
Fostering Curriculum Development Through Artesol 2010
Fostering Curriculum Development Through Artesol 2010Fostering Curriculum Development Through Artesol 2010
Fostering Curriculum Development Through Artesol 2010
 

Viewers also liked

New Zealand Franchising Confidence Index | October 2012
New Zealand Franchising Confidence Index | October 2012New Zealand Franchising Confidence Index | October 2012
New Zealand Franchising Confidence Index | October 2012Franchize Consultants
 
Case report of thoracic spine fractures from ied blast in armoured vehicle Y...
Case report of thoracic spine fractures from ied blast in armoured vehicle  Y...Case report of thoracic spine fractures from ied blast in armoured vehicle  Y...
Case report of thoracic spine fractures from ied blast in armoured vehicle Y...Leishman Associates
 
Presentation4site
Presentation4sitePresentation4site
Presentation4siteWord4ward
 
Pitch Perfect: Giving Journalists What they Want
Pitch Perfect: Giving Journalists What they WantPitch Perfect: Giving Journalists What they Want
Pitch Perfect: Giving Journalists What they WantVuelio
 
20161226西日本国際福祉機器展
20161226西日本国際福祉機器展20161226西日本国際福祉機器展
20161226西日本国際福祉機器展Takeshita Kouhei
 
Myeloma conference presentation november 2012
Myeloma conference presentation   november 2012Myeloma conference presentation   november 2012
Myeloma conference presentation november 2012Jason Potts
 
Apouc 4min pitch_biotwang_v2
Apouc 4min pitch_biotwang_v2Apouc 4min pitch_biotwang_v2
Apouc 4min pitch_biotwang_v2maclean liu
 
Mis panas del colegio
Mis panas del colegioMis panas del colegio
Mis panas del colegiojcsalina
 
IIM A _ presentation
IIM A _ presentationIIM A _ presentation
IIM A _ presentationJalaj Saxena
 
Productieproces definitieve maquette
Productieproces definitieve maquetteProductieproces definitieve maquette
Productieproces definitieve maquettelaurenztack
 
为11.2.0.2 grid infrastructure添加节点
为11.2.0.2 grid infrastructure添加节点为11.2.0.2 grid infrastructure添加节点
为11.2.0.2 grid infrastructure添加节点maclean liu
 
Forward Progress Energy Field
Forward Progress Energy FieldForward Progress Energy Field
Forward Progress Energy FieldMario Pinardo
 
黃問_如何問出好問題 _台北市健言社(作大夢的歐吉桑)
黃問_如何問出好問題 _台北市健言社(作大夢的歐吉桑)黃問_如何問出好問題 _台北市健言社(作大夢的歐吉桑)
黃問_如何問出好問題 _台北市健言社(作大夢的歐吉桑)Alan Huang
 
Nomensa iof 110706
Nomensa iof 110706Nomensa iof 110706
Nomensa iof 110706Jason Potts
 
Vision and Planning Energy Field
Vision and Planning Energy FieldVision and Planning Energy Field
Vision and Planning Energy FieldMario Pinardo
 

Viewers also liked (20)

New Zealand Franchising Confidence Index | October 2012
New Zealand Franchising Confidence Index | October 2012New Zealand Franchising Confidence Index | October 2012
New Zealand Franchising Confidence Index | October 2012
 
100 best companies executive summary
100 best companies executive summary100 best companies executive summary
100 best companies executive summary
 
Case report of thoracic spine fractures from ied blast in armoured vehicle Y...
Case report of thoracic spine fractures from ied blast in armoured vehicle  Y...Case report of thoracic spine fractures from ied blast in armoured vehicle  Y...
Case report of thoracic spine fractures from ied blast in armoured vehicle Y...
 
Develop Mobile App
Develop Mobile AppDevelop Mobile App
Develop Mobile App
 
Presentation4site
Presentation4sitePresentation4site
Presentation4site
 
Linee_Guida
Linee_GuidaLinee_Guida
Linee_Guida
 
Pitch Perfect: Giving Journalists What they Want
Pitch Perfect: Giving Journalists What they WantPitch Perfect: Giving Journalists What they Want
Pitch Perfect: Giving Journalists What they Want
 
20161226西日本国際福祉機器展
20161226西日本国際福祉機器展20161226西日本国際福祉機器展
20161226西日本国際福祉機器展
 
Myeloma conference presentation november 2012
Myeloma conference presentation   november 2012Myeloma conference presentation   november 2012
Myeloma conference presentation november 2012
 
Apouc 4min pitch_biotwang_v2
Apouc 4min pitch_biotwang_v2Apouc 4min pitch_biotwang_v2
Apouc 4min pitch_biotwang_v2
 
Mis panas del colegio
Mis panas del colegioMis panas del colegio
Mis panas del colegio
 
Dhs2lab
Dhs2labDhs2lab
Dhs2lab
 
2005 nds 2
2005 nds 22005 nds 2
2005 nds 2
 
IIM A _ presentation
IIM A _ presentationIIM A _ presentation
IIM A _ presentation
 
Productieproces definitieve maquette
Productieproces definitieve maquetteProductieproces definitieve maquette
Productieproces definitieve maquette
 
为11.2.0.2 grid infrastructure添加节点
为11.2.0.2 grid infrastructure添加节点为11.2.0.2 grid infrastructure添加节点
为11.2.0.2 grid infrastructure添加节点
 
Forward Progress Energy Field
Forward Progress Energy FieldForward Progress Energy Field
Forward Progress Energy Field
 
黃問_如何問出好問題 _台北市健言社(作大夢的歐吉桑)
黃問_如何問出好問題 _台北市健言社(作大夢的歐吉桑)黃問_如何問出好問題 _台北市健言社(作大夢的歐吉桑)
黃問_如何問出好問題 _台北市健言社(作大夢的歐吉桑)
 
Nomensa iof 110706
Nomensa iof 110706Nomensa iof 110706
Nomensa iof 110706
 
Vision and Planning Energy Field
Vision and Planning Energy FieldVision and Planning Energy Field
Vision and Planning Energy Field
 

Similar to Impact of Mobile Tech on Children's Motivation and Learning

Tasks & Questions
Tasks & QuestionsTasks & Questions
Tasks & QuestionsReversearp
 
Unit 6 presentation base ten equality form of a number with trainer notes 7.9.08
Unit 6 presentation base ten equality form of a number with trainer notes 7.9.08Unit 6 presentation base ten equality form of a number with trainer notes 7.9.08
Unit 6 presentation base ten equality form of a number with trainer notes 7.9.08jcsmathfoundations
 
The future of hands on learning technologies-no pictures
The future of hands on learning technologies-no picturesThe future of hands on learning technologies-no pictures
The future of hands on learning technologies-no picturesSusanna Martin
 
Weekly Lesson Plan Example
Weekly Lesson Plan ExampleWeekly Lesson Plan Example
Weekly Lesson Plan ExampleCassaundra Hisch
 
Creative Problem Solving Model for Promoting Achievement among Higher Seconda...
Creative Problem Solving Model for Promoting Achievement among Higher Seconda...Creative Problem Solving Model for Promoting Achievement among Higher Seconda...
Creative Problem Solving Model for Promoting Achievement among Higher Seconda...QUESTJOURNAL
 
Data driven ppt_presentation[1]
Data driven ppt_presentation[1]Data driven ppt_presentation[1]
Data driven ppt_presentation[1]Patricia Hutton
 
Task design CMP@CPP Summer 2018
 Task design CMP@CPP Summer 2018 Task design CMP@CPP Summer 2018
Task design CMP@CPP Summer 2018Evan Rushton
 
Barry Ryan_Alternative Laboratories: Near Peer Constructed Technology Enhanc...
Barry Ryan_Alternative Laboratories: Near Peer Constructed Technology Enhanc...Barry Ryan_Alternative Laboratories: Near Peer Constructed Technology Enhanc...
Barry Ryan_Alternative Laboratories: Near Peer Constructed Technology Enhanc...Barry Ryan
 
Carp presentation
Carp   presentationCarp   presentation
Carp presentationMsMatthew
 
CAN Conference TESTA Programme Assessment
CAN Conference TESTA Programme Assessment CAN Conference TESTA Programme Assessment
CAN Conference TESTA Programme Assessment Tansy Jessop
 
Tools To Assess The Quality Of The Curriculum
Tools To  Assess The  Quality Of The  CurriculumTools To  Assess The  Quality Of The  Curriculum
Tools To Assess The Quality Of The Curriculumdbrady3702
 
Exploring classroom interaction with dynamic social network analysis
Exploring classroom interaction with dynamic social network analysisExploring classroom interaction with dynamic social network analysis
Exploring classroom interaction with dynamic social network analysisChristian Bokhove
 
An Intelligent Microworld as an Alternative Way to Learn Algebraic Thinking
An Intelligent Microworld as an Alternative Way to Learn Algebraic ThinkingAn Intelligent Microworld as an Alternative Way to Learn Algebraic Thinking
An Intelligent Microworld as an Alternative Way to Learn Algebraic ThinkingCITE
 
Dr. Harland (STEM Mom) Speaks at South Dakota State University: Workshop Pres...
Dr. Harland (STEM Mom) Speaks at South Dakota State University: Workshop Pres...Dr. Harland (STEM Mom) Speaks at South Dakota State University: Workshop Pres...
Dr. Harland (STEM Mom) Speaks at South Dakota State University: Workshop Pres...Darci the STEM Mom
 

Similar to Impact of Mobile Tech on Children's Motivation and Learning (20)

Jenest poster
Jenest posterJenest poster
Jenest poster
 
Lesson plan (inset demo)
Lesson plan (inset demo)Lesson plan (inset demo)
Lesson plan (inset demo)
 
Tasks & Questions
Tasks & QuestionsTasks & Questions
Tasks & Questions
 
Unit 6 presentation base ten equality form of a number with trainer notes 7.9.08
Unit 6 presentation base ten equality form of a number with trainer notes 7.9.08Unit 6 presentation base ten equality form of a number with trainer notes 7.9.08
Unit 6 presentation base ten equality form of a number with trainer notes 7.9.08
 
The future of hands on learning technologies-no pictures
The future of hands on learning technologies-no picturesThe future of hands on learning technologies-no pictures
The future of hands on learning technologies-no pictures
 
Weekly Lesson Plan Example
Weekly Lesson Plan ExampleWeekly Lesson Plan Example
Weekly Lesson Plan Example
 
Creative Problem Solving Model for Promoting Achievement among Higher Seconda...
Creative Problem Solving Model for Promoting Achievement among Higher Seconda...Creative Problem Solving Model for Promoting Achievement among Higher Seconda...
Creative Problem Solving Model for Promoting Achievement among Higher Seconda...
 
1 why do testa
1 why do testa1 why do testa
1 why do testa
 
Data driven ppt_presentation[1]
Data driven ppt_presentation[1]Data driven ppt_presentation[1]
Data driven ppt_presentation[1]
 
Circle calcs lp
Circle calcs lpCircle calcs lp
Circle calcs lp
 
Task design CMP@CPP Summer 2018
 Task design CMP@CPP Summer 2018 Task design CMP@CPP Summer 2018
Task design CMP@CPP Summer 2018
 
Barry Ryan_Alternative Laboratories: Near Peer Constructed Technology Enhanc...
Barry Ryan_Alternative Laboratories: Near Peer Constructed Technology Enhanc...Barry Ryan_Alternative Laboratories: Near Peer Constructed Technology Enhanc...
Barry Ryan_Alternative Laboratories: Near Peer Constructed Technology Enhanc...
 
Unit 7 jcs md
Unit 7 jcs mdUnit 7 jcs md
Unit 7 jcs md
 
CARP
CARPCARP
CARP
 
Carp presentation
Carp   presentationCarp   presentation
Carp presentation
 
CAN Conference TESTA Programme Assessment
CAN Conference TESTA Programme Assessment CAN Conference TESTA Programme Assessment
CAN Conference TESTA Programme Assessment
 
Tools To Assess The Quality Of The Curriculum
Tools To  Assess The  Quality Of The  CurriculumTools To  Assess The  Quality Of The  Curriculum
Tools To Assess The Quality Of The Curriculum
 
Exploring classroom interaction with dynamic social network analysis
Exploring classroom interaction with dynamic social network analysisExploring classroom interaction with dynamic social network analysis
Exploring classroom interaction with dynamic social network analysis
 
An Intelligent Microworld as an Alternative Way to Learn Algebraic Thinking
An Intelligent Microworld as an Alternative Way to Learn Algebraic ThinkingAn Intelligent Microworld as an Alternative Way to Learn Algebraic Thinking
An Intelligent Microworld as an Alternative Way to Learn Algebraic Thinking
 
Dr. Harland (STEM Mom) Speaks at South Dakota State University: Workshop Pres...
Dr. Harland (STEM Mom) Speaks at South Dakota State University: Workshop Pres...Dr. Harland (STEM Mom) Speaks at South Dakota State University: Workshop Pres...
Dr. Harland (STEM Mom) Speaks at South Dakota State University: Workshop Pres...
 

Recently uploaded

Call Girls in Dwarka Mor Delhi Contact Us 9654467111
Call Girls in Dwarka Mor Delhi Contact Us 9654467111Call Girls in Dwarka Mor Delhi Contact Us 9654467111
Call Girls in Dwarka Mor Delhi Contact Us 9654467111Sapana Sha
 
URLs and Routing in the Odoo 17 Website App
URLs and Routing in the Odoo 17 Website AppURLs and Routing in the Odoo 17 Website App
URLs and Routing in the Odoo 17 Website AppCeline George
 
Kisan Call Centre - To harness potential of ICT in Agriculture by answer farm...
Kisan Call Centre - To harness potential of ICT in Agriculture by answer farm...Kisan Call Centre - To harness potential of ICT in Agriculture by answer farm...
Kisan Call Centre - To harness potential of ICT in Agriculture by answer farm...Krashi Coaching
 
Software Engineering Methodologies (overview)
Software Engineering Methodologies (overview)Software Engineering Methodologies (overview)
Software Engineering Methodologies (overview)eniolaolutunde
 
Paris 2024 Olympic Geographies - an activity
Paris 2024 Olympic Geographies - an activityParis 2024 Olympic Geographies - an activity
Paris 2024 Olympic Geographies - an activityGeoBlogs
 
Organic Name Reactions for the students and aspirants of Chemistry12th.pptx
Organic Name Reactions  for the students and aspirants of Chemistry12th.pptxOrganic Name Reactions  for the students and aspirants of Chemistry12th.pptx
Organic Name Reactions for the students and aspirants of Chemistry12th.pptxVS Mahajan Coaching Centre
 
microwave assisted reaction. General introduction
microwave assisted reaction. General introductionmicrowave assisted reaction. General introduction
microwave assisted reaction. General introductionMaksud Ahmed
 
Sanyam Choudhary Chemistry practical.pdf
Sanyam Choudhary Chemistry practical.pdfSanyam Choudhary Chemistry practical.pdf
Sanyam Choudhary Chemistry practical.pdfsanyamsingh5019
 
KSHARA STURA .pptx---KSHARA KARMA THERAPY (CAUSTIC THERAPY)————IMP.OF KSHARA ...
KSHARA STURA .pptx---KSHARA KARMA THERAPY (CAUSTIC THERAPY)————IMP.OF KSHARA ...KSHARA STURA .pptx---KSHARA KARMA THERAPY (CAUSTIC THERAPY)————IMP.OF KSHARA ...
KSHARA STURA .pptx---KSHARA KARMA THERAPY (CAUSTIC THERAPY)————IMP.OF KSHARA ...M56BOOKSTORE PRODUCT/SERVICE
 
The Most Excellent Way | 1 Corinthians 13
The Most Excellent Way | 1 Corinthians 13The Most Excellent Way | 1 Corinthians 13
The Most Excellent Way | 1 Corinthians 13Steve Thomason
 
How to Configure Email Server in Odoo 17
How to Configure Email Server in Odoo 17How to Configure Email Server in Odoo 17
How to Configure Email Server in Odoo 17Celine George
 
Introduction to ArtificiaI Intelligence in Higher Education
Introduction to ArtificiaI Intelligence in Higher EducationIntroduction to ArtificiaI Intelligence in Higher Education
Introduction to ArtificiaI Intelligence in Higher Educationpboyjonauth
 
Solving Puzzles Benefits Everyone (English).pptx
Solving Puzzles Benefits Everyone (English).pptxSolving Puzzles Benefits Everyone (English).pptx
Solving Puzzles Benefits Everyone (English).pptxOH TEIK BIN
 
How to Make a Pirate ship Primary Education.pptx
How to Make a Pirate ship Primary Education.pptxHow to Make a Pirate ship Primary Education.pptx
How to Make a Pirate ship Primary Education.pptxmanuelaromero2013
 
Class 11 Legal Studies Ch-1 Concept of State .pdf
Class 11 Legal Studies Ch-1 Concept of State .pdfClass 11 Legal Studies Ch-1 Concept of State .pdf
Class 11 Legal Studies Ch-1 Concept of State .pdfakmcokerachita
 
A Critique of the Proposed National Education Policy Reform
A Critique of the Proposed National Education Policy ReformA Critique of the Proposed National Education Policy Reform
A Critique of the Proposed National Education Policy ReformChameera Dedduwage
 

Recently uploaded (20)

Call Girls in Dwarka Mor Delhi Contact Us 9654467111
Call Girls in Dwarka Mor Delhi Contact Us 9654467111Call Girls in Dwarka Mor Delhi Contact Us 9654467111
Call Girls in Dwarka Mor Delhi Contact Us 9654467111
 
URLs and Routing in the Odoo 17 Website App
URLs and Routing in the Odoo 17 Website AppURLs and Routing in the Odoo 17 Website App
URLs and Routing in the Odoo 17 Website App
 
Kisan Call Centre - To harness potential of ICT in Agriculture by answer farm...
Kisan Call Centre - To harness potential of ICT in Agriculture by answer farm...Kisan Call Centre - To harness potential of ICT in Agriculture by answer farm...
Kisan Call Centre - To harness potential of ICT in Agriculture by answer farm...
 
Staff of Color (SOC) Retention Efforts DDSD
Staff of Color (SOC) Retention Efforts DDSDStaff of Color (SOC) Retention Efforts DDSD
Staff of Color (SOC) Retention Efforts DDSD
 
Software Engineering Methodologies (overview)
Software Engineering Methodologies (overview)Software Engineering Methodologies (overview)
Software Engineering Methodologies (overview)
 
Paris 2024 Olympic Geographies - an activity
Paris 2024 Olympic Geographies - an activityParis 2024 Olympic Geographies - an activity
Paris 2024 Olympic Geographies - an activity
 
Organic Name Reactions for the students and aspirants of Chemistry12th.pptx
Organic Name Reactions  for the students and aspirants of Chemistry12th.pptxOrganic Name Reactions  for the students and aspirants of Chemistry12th.pptx
Organic Name Reactions for the students and aspirants of Chemistry12th.pptx
 
microwave assisted reaction. General introduction
microwave assisted reaction. General introductionmicrowave assisted reaction. General introduction
microwave assisted reaction. General introduction
 
Sanyam Choudhary Chemistry practical.pdf
Sanyam Choudhary Chemistry practical.pdfSanyam Choudhary Chemistry practical.pdf
Sanyam Choudhary Chemistry practical.pdf
 
9953330565 Low Rate Call Girls In Rohini Delhi NCR
9953330565 Low Rate Call Girls In Rohini  Delhi NCR9953330565 Low Rate Call Girls In Rohini  Delhi NCR
9953330565 Low Rate Call Girls In Rohini Delhi NCR
 
KSHARA STURA .pptx---KSHARA KARMA THERAPY (CAUSTIC THERAPY)————IMP.OF KSHARA ...
KSHARA STURA .pptx---KSHARA KARMA THERAPY (CAUSTIC THERAPY)————IMP.OF KSHARA ...KSHARA STURA .pptx---KSHARA KARMA THERAPY (CAUSTIC THERAPY)————IMP.OF KSHARA ...
KSHARA STURA .pptx---KSHARA KARMA THERAPY (CAUSTIC THERAPY)————IMP.OF KSHARA ...
 
Model Call Girl in Tilak Nagar Delhi reach out to us at 🔝9953056974🔝
Model Call Girl in Tilak Nagar Delhi reach out to us at 🔝9953056974🔝Model Call Girl in Tilak Nagar Delhi reach out to us at 🔝9953056974🔝
Model Call Girl in Tilak Nagar Delhi reach out to us at 🔝9953056974🔝
 
The Most Excellent Way | 1 Corinthians 13
The Most Excellent Way | 1 Corinthians 13The Most Excellent Way | 1 Corinthians 13
The Most Excellent Way | 1 Corinthians 13
 
How to Configure Email Server in Odoo 17
How to Configure Email Server in Odoo 17How to Configure Email Server in Odoo 17
How to Configure Email Server in Odoo 17
 
Introduction to ArtificiaI Intelligence in Higher Education
Introduction to ArtificiaI Intelligence in Higher EducationIntroduction to ArtificiaI Intelligence in Higher Education
Introduction to ArtificiaI Intelligence in Higher Education
 
Solving Puzzles Benefits Everyone (English).pptx
Solving Puzzles Benefits Everyone (English).pptxSolving Puzzles Benefits Everyone (English).pptx
Solving Puzzles Benefits Everyone (English).pptx
 
How to Make a Pirate ship Primary Education.pptx
How to Make a Pirate ship Primary Education.pptxHow to Make a Pirate ship Primary Education.pptx
How to Make a Pirate ship Primary Education.pptx
 
Class 11 Legal Studies Ch-1 Concept of State .pdf
Class 11 Legal Studies Ch-1 Concept of State .pdfClass 11 Legal Studies Ch-1 Concept of State .pdf
Class 11 Legal Studies Ch-1 Concept of State .pdf
 
TataKelola dan KamSiber Kecerdasan Buatan v022.pdf
TataKelola dan KamSiber Kecerdasan Buatan v022.pdfTataKelola dan KamSiber Kecerdasan Buatan v022.pdf
TataKelola dan KamSiber Kecerdasan Buatan v022.pdf
 
A Critique of the Proposed National Education Policy Reform
A Critique of the Proposed National Education Policy ReformA Critique of the Proposed National Education Policy Reform
A Critique of the Proposed National Education Policy Reform
 

Impact of Mobile Tech on Children's Motivation and Learning

  • 1. The Impact of Hand Held Mobile Technologies upon Children’s Motivation and Learning. Susanna Martin Department of Psychology, University of Bath Danaë Stanton Fraser, Mike Fraser, Dawn Woodgate and David Crellin.
  • 2. Overview of Presentation • Background • Technology • Hypotheses • Process • Results • Implications • Future
  • 3. Background • Engage children-Barton (1997) • Ambient Wood-Rogers et al (2004) • SENSE-Stanton Fraser et al (2005) • Participate-Woodgate et al (2008)
  • 5. Hypotheses • Motivation will improve for data acquired in context (self collected). • Understanding will improve for data acquired in context (self collected). • Pre-generated graphs will be better understood if students acquired the data themselves.
  • 6. Participants Three Schools, 46 Students (8 discounted) – Age 12-14 – 14 Girls, 24 Boys Grouping – Collection • 19 Self • 19 Peer – Presentation • 14 Software • 12 Pre-Produced • 12 Manual
  • 7. Process Collection • Self Collect • 3 Sites • Peer Collect • Sound Lesson Production • Location A (Student / Partner Visited) • Location B (Researcher Visited)
  • 11. Learning Results Four Tests of Learning – Draw, label, read from and identify data from graphs. Two had significant results: – Ability to read from a graph: • A significant difference within the peer group. – Students who used the pre-produced graphs had better post test scores than those who manually produced graphs. – Ability to draw a graph: • All students showed decrease in scores. – The self group showed a significant decrease. – The manually produced group got significantly worse.
  • 12. Motivation Results 5 Statements linked to motivation. – Likert Scale • I enjoy using computers to draw graphs • I think collecting data is a waste of time • I like working with data I have collected – Three Choice Answer • Which set of data did you feel more comfortable working with? • Which set of data do you feel you can explain better?
  • 13. Motivation Results I think collecting data is a waste of time – Students who used pre- produced graphs, changed their view in a positive direction 0 5 10 15 20 25 30 35 Strongly Agree Agree Neither Agree nor Disagree Disagree Strongly Disagee Pre-Test Post-Test I like working with data I have collected – Students who self collected showed a positive change in opinion. 0 10 20 30 40 50 60 70 Strongly Agree Agree Neither Agree nor Disagree Disagree Strongly Disagee Pre-Test Post-Test
  • 14. Motivation Results Which set of data did you feel more comfortable with? – 68% of the self students preferred location A (their own data). – 62% of the peer students felt no difference between locations A and B. Which set of data did you feel you could explain better? – 60% of the self students felt they had better understanding of location A (the location which they visited). Only 18% of the peer students preferred Location A
  • 15. Results-Hypotheses Motivation will improve for data acquired in context (self collected). – Confirmed-Students who self collect indicate they are more comfortable and confident with data they have collected themselves. Understanding will improve for data acquired in context (self collected). – Not Supported-The self group performed worse at post test. Pre-Generated graphs will be better understood if students acquired the data themselves. – Reverse- Peer students showed a better post test score when they used pre-generated graphs
  • 16. Implications Ownership of data – Has an impact on how students feel about data. Interpretation – Students may reflect differently dependent on how the data is presented Assessment – Allowing students to qualify answers provides an insight into the students reasoning process.
  • 17. Future Focus on the role of context – Investigate further self collection but also the idea of media contexts (photos, videos, text) to aid a students concept of the data. Longitudinal – To provide a greater intervention period and to reduce the possibility of novelty effects.
  • 18. References Barton, R. (1997) Does data logging change the nature of children’s thinking in experimental work in science? In B. Somekh & N. Davis (eds.) Using IT effectively in teaching and learning: studies in pre-service and in-service teacher education. London: Routledge. ISBN 0-415- 12131-0 Barton, R. (1998) Why do we ask pupils to plot graphs? Physics Education 33, 6, 366-367. Rogers, Y., Price, S., Fitzpatrick, G., Fleck, R., Harris, E., Smith, H., Randell, C., Muller, H., O'Malley, C., Stanton, D., Thompson,M. and Weal, M. (2004). Ambient Wood: Designing new forms of digital augmentation for learning outdoors. In Proc. Interaction Design and Children. pp. 3-10. Stanton Fraser, D., Smith, H., Tallyn, E., Kirk, D., Benford, S., Rowland, D., et al. (2005). The SENSE project: a context-inclusive approach to studying environmental science within and across schools. In Proc. Computer support for collaborative learning. Taiwan. pp. 155-159, May 2005. Woodgate, D., Fraser, D., Paxton, M., Crellin, D., Woolard, A., Dillon, T., et al. (2008). Bringing School Science to Life: Personalization, Contextualization and Reflection of Self-Collected Data. Fifth IEEE International Conference on Wireless, Mobile, and Ubiquitous Technology in Education (wmute 2008), 100-104. Ieee. doi: 10.1109/WMUTE.2008.35.
  • 19. Question One-Learning Quantitative Which location was the quietest- a, b or c? Marked out of 1 B) What was the sound level at each location when the time was 10s? Marked out of 6, 2 marks for each correct, one mark if out by +/- 2 Qualitative C and D) Data was lost for 14s for location A please consider whether: one place a range or places should not be replaced E) Please explain your choice for question C Within the PEER group, students who received pre-produced graphs did significantly better in the post-test than those who manually produced.
  • 20. Question Two-Learning Please plot the data points from the table and draw a line of best fit on the graph This question is marked out of ten What Possible Mark Description Example Mark Break Down Appropriate Scale X Axis 2 Scale with regular intervals Eg, 0,2,4,6,8, Not, 0,2,5,6,10 1 Y Axis Scale with regular intervals Eg, 60,62,64,66 Not 60,63,64,65,68 1 Label X Axis 4 Labelled as Time 1 Labelled with Seconds 1 Y Axis Labelled as Sound 1 Labelled with dB 1 Title 1 Title using Sound and Time “A graph showing how Sound levels change over Time” “A graph showing sound over a 20 seconds” 1 Data Points 3 All points plotted accurately 3 Up to TWO incorrect 2 Up to FIVE incorrect 1 All students show a decline in scores for post-test, with SELF students and MANUALLY-PRODUCED students performing significantly worse.
  • 21. Question Three-Learning What Possible Mark Description Example Mark Break Down X-Axis 2 Label appropriately Label with Time 2 Label with just X 1 (nb not in addition to Time) 1 Label with Unit Can be anything appropriate, Seconds, S, minutes, Hours Not cm, dB, pH etc 1 Y-Axis 2 Label appropriately Label with Sound 2 Label with just Y 1 (nb not in addition to Sound) 1 Label with Unit Can be anything appropriate, dB, Decibels, not Seconds, Minutes etc 1 Title 3 Mentions Sound Noise 1 Mentions Time Can be seconds Needs to be correct 1 Full Sentence “This graph shows how sound changes over time” 1 Below is a graph showing how sound levels change over time, measured in decibels (dB). Please label the axis and give the graph an appropriate title. This question is marked out of nine No Significant results
  • 22. Question Four-Learning “James needs to label his graph with each location but he has forgotten which graph is which, using your understanding of sound can you work out which graph fits which location best?” Connecting Graph to Location One mark for each correct Then for each of the three explanations One mark for describing the line (loud, quiet etc) One mark for describing the place (loud, quiet, consistent, etc) One mark for connecting the place and the line Total possible marks is 12 No Significant results
  • 23. Motivation Results Which set of data did you feel more comfortable with? Self Student: “Location A- Because this was the one I tested and it took less time to draw a graph because I understood the data better” Peer Student: “No Difference-I didn't go and find any data so it doesn't really matter to me which one I worked with”.
  • 24. Motivation Results Which set of data did you feel you could explain better? Self Student: “Location A-Because with this one I know why the data was varied, however I couldn't find out why the other set of data was varied” Peer Student: “No Difference-I think I understand each both the same because I didn't go out and collect the data so I was just working with the data I got given and it didn't matter which one I had”.

Editor's Notes

  1. In 1997 Barton noted how data logging can change the nature and emphasis of science practical work, enabling the students to become more independent. Since then mobile technology has improved and further research has indicated that engaging students through mobile technology can be highly beneficial. More recently work by Rogers et al in their 2004 Ambient Wood project showed that freedom to explore provides students with the opportunities to interpret and reflect upon their discoveries. Work by Stanton-Fraser et al in 2005 explored the idea of a context inclusive approach to learning, whereby the students recorded their experimentation enabling them to reflect upon their own scientific process. By enabling the students to reflect and compare on their methods the students were able to gain a greater understanding of the scientific process. The Participate Project noted how students are keen to take ownership of their data and that they found it highly motivating to collect their own data. A key factor which arose during the background analysis was that the majority of the research used a qualitative approach, for instance in the Ambient Wood project, data was gathered by analysing video recordings of the students. In the SENSE project the researchers used video recordings of the students analysis and discussion sessions to inform their understanding. This led to our decision to investigate motivation and learning using a primarily quantitative design. We were primarily interested in how manipulating the levels of contact student had with data logging technology during the collection and transformation stages of understanding data. With a key question of whether doing it yourself can give a better conceptual grasp of the data and how it links into the real world.
  2. 3 sites- counterbalanced: pond, field, construction site. Sound Lesson: saw data loggers but didn’t use them. Students were required to either generate or annotate two graphs.
  3. Ability to read from a graph: might be due to them needing to work harder to read the graphs during the trial, (the self students may have been more familiar with their data as a consequence of collecting it).... thus gaining more practice with this skill. Ability to draw and label a graph: Arguably both of these groups had more work to do. Also fatigue, and incomplete booklets.
  4. Likert Scales were assessed using Wilcoxon. Three Choice answer assessed using Chi Square I enjoy using computers to draw graphs –Non Significant I think collecting data is a waste of time- Significant I like working with data I have collected- Significant Three Choice Answer Which set of data did you feel more comfortable working with?-Significant Which set of data do you feel you can explain better?-Significant
  5. I think collecting data is a waste of time This may be due to students realising that when you are analysing data you benefit from having the context of collecting the data yourself.
  6. Both of these indicated that regardless of the actual level of understanding students who self collected believed they could explain their own data better and felt more comfortable in doing so. Suggesting that by collecting your own data you gain a confidence about your ability to understand and interpret it.
  7. This can be further manipulated by changing how the students interact with the data and the opportunities provided Manual group-had to spend too long plotting their graph, leaving them no chance to reflect-links to Barton’s 2008 finding that student difficulties in plotting their own graphs can reinforce misunderstandings. This highlights how many conventional tests of learning might be a little narrow. Our initial work suggests that this would be interesting to investigate further.