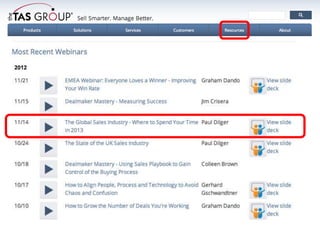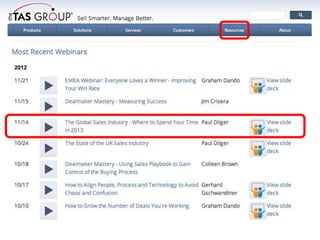
The TAS Group Webinar

The Global Sales Industry –
Part 2: A Regional Perspective
Will Wiegler, CMO, The TAS Group
Today’s Presenter


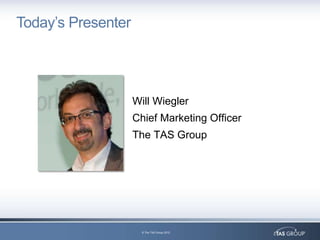
                    Will Wiegler
                    Chief Marketing Officer
                    The TAS Group


                      © The TAS Group 2012
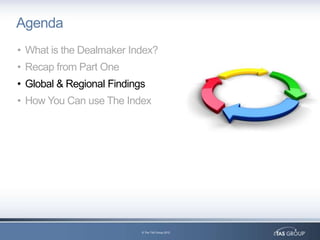
Agenda
• What is the Dealmaker Index?
• Recap from Part One
• Global & Regional Findings
• How You Can Use the Index


                           © The TAS Group 2012
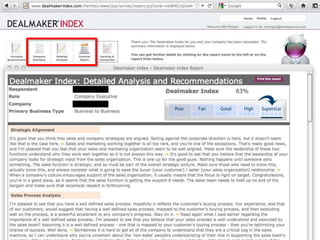
About the Dealmaker Index
Dealmaker Index is a global free service
for sales professionals and their
companies to assess their sales
effectiveness, gain advice on how to
improve, and compare their
performance with their peers.


                            © The TAS Group 2012
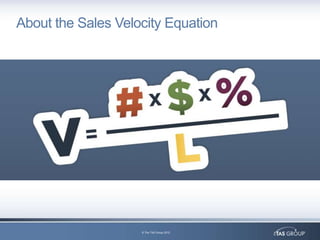
About the Sales Velocity Equation


                    © The TAS Group 2012
© The TAS Group 2012
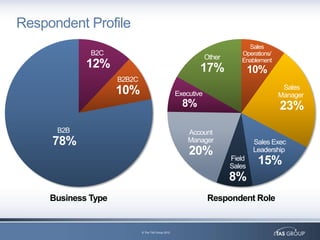
Respondent Profile
                                                                             Sales
              B2C                                                          Operations/
                                                                Other      Enablement
             12%                                            17%                 10%
                     B2B2C
                                                                                          Sales
                     10%                            Executive                            Manager
                                                      8%                                 23%
      B2B                                               Account
     78%                                                Manager                 Sales Exec
                                                        20%                     Leadership
                                                                        Field
                                                                        Sales
                                                                                 15%
                                                                        8%
     Business Type                                              Respondent Role


                             © The TAS Group 2012
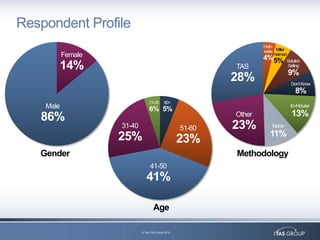
Respondent Profile
                                                                   Huth-
                                                                   waite Miller
           Female                                                  4% 5%
                                                                         Heiman
                                                                                Solution
       14%                                                 TAS                  Selling
                                                                                 9%
                                                           28%                    Don’t Know
                                                                                     8%
                                 21-30     60+
    Male                         6% 5%
                                                                                  In-House

   86%                                                     Other                   13%
                    31-40                          51-60   23%          None

                    25%                                               11%
                                                   23%
   Gender                                                  Methodology
                                 41-50
                               41%

                                    Age

                            © The TAS Group 2012
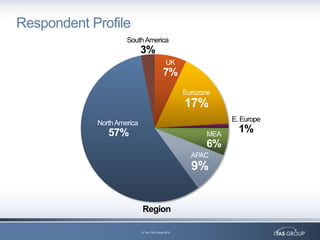
Respondent Profile
                     South America
                            3%
                                            UK
                                           7%
                                                   Eurozone
                                                   17%
                                                               E. Europe
            North America
               57%                                       MEA
                                                                 1%
                                                         6%
                                                     APAC
                                                     9%


                            Region

                            © The TAS Group 2012
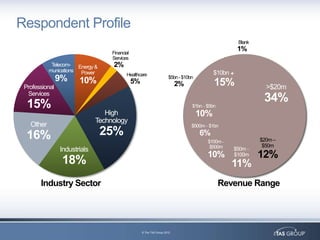
Respondent Profile
                                                                                                     Blank

                                   Financial
                                                                                                     1%
                                   Services
            Telecom- Energy &      2%
           munications Power                                                               $10bn +
                                          Healthcare
                9%     10%                     5%
                                                                      $5bn - $10bn
                                                                                           15%
 Professional                                                              2%                                  >$20m
  Services
                                                                                                              34%
  15%                                                                            $1bn – $5bn
                                 High                                                10%
                              Technology
   Other                                                                         $500m – $1bn

  16%                           25%                                                  6%
                                                                                        $100m –              $20m –
                                                                                         $500m                $50m
                Industrials                                                                       $50m –
                                                                                        10%       $100m      12%
                 18%                                                                              11%
       Industry Sector                                                                         Revenue Range


                                                    © The TAS Group 2012
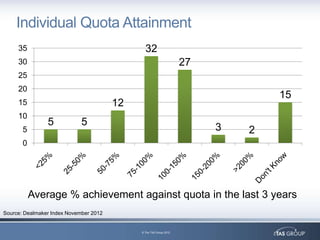
Individual Quota Attainment
     35                                        32
     30                                                             27
     25
     20
                                                                                 15
     15                                 12
     10
                5            5
       5                                                                 3   2
       0


           Average % achievement against quota in the last 3 years
Source: Dealmaker Index November 2012


                                             © The TAS Group 2012
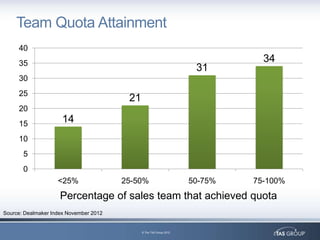
Team Quota Attainment
     40
     35                                                                         34
                                                                      31
     30
     25
                                         21
     20
     15              14
     10
       5
       0
                    <25%                25-50%                       50-75%   75-100%
                     Percentage of sales team that achieved quota
Source: Dealmaker Index November 2012


                                              © The TAS Group 2012
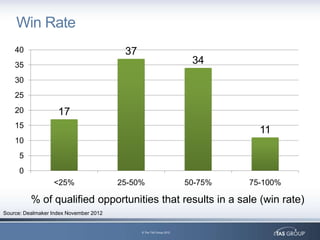
Win Rate
    40                                   37
    35                                                                34
    30
    25
    20              17
    15
                                                                                11
    10
     5
     0
                  <25%                  25-50%                       50-75%   75-100%

          % of qualified opportunities that results in a sale (win rate)
Source: Dealmaker Index November 2012


                                              © The TAS Group 2012
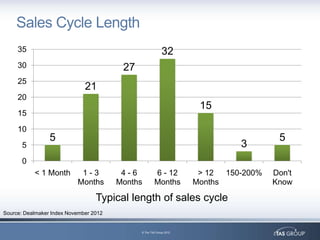
Sales Cycle Length
     35                                                    32
     30                                  27
     25
                              21
     20
                                                                      15
     15
     10
                 5                                                                      5
       5                                                                       3
       0
           < 1 Month        1-3          4-6          6 - 12          > 12  150-200%   Don't
                           Months       Months        Months         Months            Know

                                  Typical length of sales cycle
Source: Dealmaker Index November 2012


                                              © The TAS Group 2012
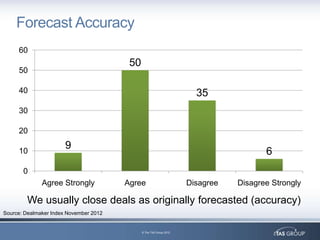
Forecast Accuracy
     60
                                         50
     50

     40                                                                35
     30

     20
                       9
     10                                                                                6
       0
              Agree Strongly            Agree                        Disagree   Disagree Strongly

        We usually close deals as originally forecasted (accuracy)
Source: Dealmaker Index November 2012


                                              © The TAS Group 2012
© The TAS Group 2012
Agenda
• What is the Dealmaker Index?
• Recap from Part One
• Global & Regional Findings
• How You Can use The Index


                           © The TAS Group 2012
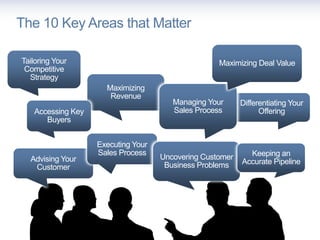
The 10 Key Areas that Matter

Tailoring Your                                                   Maximizing Deal Value
 Competitive
  Strategy
                     Maximizing
                      Revenue
                                                      Managing Your   Differentiating Your
   Accessing Key                                      Sales Process         Offering
      Buyers


                   Executing Your
                   Sales Process                                         Keeping an
  Advising Your                            Uncovering Customer
                                            Business Problems          Accurate Pipeline
   Customer


                               © The TAS Group 2012
Maximizing Revenue

    Globally, reps who are effective at
    maximizing revenue from key
    accounts are 46% more likely to
    make quota.


Source: Dealmaker Index November 2012


                                        © The TAS Group 2012
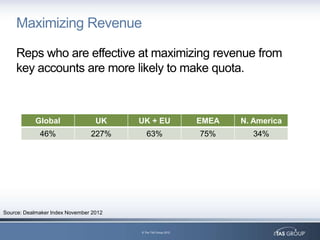
Maximizing Revenue

    Reps who are effective at maximizing revenue from
    key accounts are more likely to make quota.


           Global                 UK    UK + EU                EMEA   N. America
             46%                227%       63%                 75%       34%


Source: Dealmaker Index November 2012


                                        © The TAS Group 2012
Accessing Key Buyers

    Globally, reps who can access
    key buyers are 31% more likely to
    make quota.


Source: Dealmaker Index November 2012


                                        © The TAS Group 2012
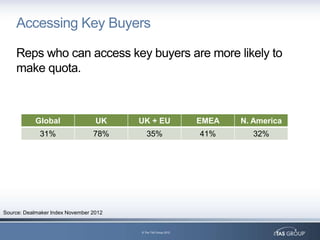
Accessing Key Buyers

    Reps who can access key buyers are more likely to
    make quota.


           Global                 UK    UK + EU                EMEA   N. America
             31%                 78%       35%                 41%       32%


Source: Dealmaker Index November 2012


                                        © The TAS Group 2012
Uncovering Customer’s Business Problems

    Globally, reps who can uncover
    the customer’s business
    problems are 35% more likely to
    make quota.


Source: Dealmaker Index November 2012


                                        © The TAS Group 2012
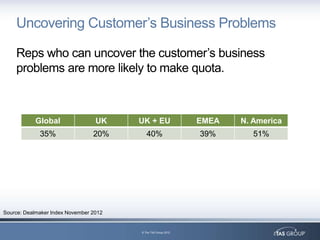
Uncovering Customer’s Business Problems

    Reps who can uncover the customer’s business
    problems are more likely to make quota.


           Global                 UK    UK + EU                EMEA   N. America
             35%                 20%       40%                 39%       51%


Source: Dealmaker Index November 2012


                                        © The TAS Group 2012
Differentiating Your Offering

    Globally, reps who find it easy to
    differentiate their offering are 43%
    more likely to make quota.


Source: Dealmaker Index November 2012


                                        © The TAS Group 2012
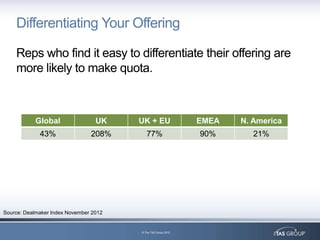
Differentiating Your Offering

    Reps who find it easy to differentiate their offering are
    more likely to make quota.


           Global                 UK    UK + EU                EMEA   N. America
             43%                208%       77%                 90%       21%


Source: Dealmaker Index November 2012


                                        © The TAS Group 2012
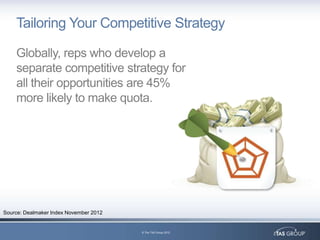
Tailoring Your Competitive Strategy

    Globally, reps who develop a
    separate competitive strategy for
    all their opportunities are 45%
    more likely to make quota.


Source: Dealmaker Index November 2012


                                        © The TAS Group 2012
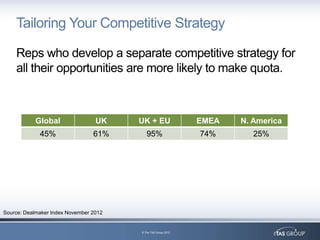
Tailoring Your Competitive Strategy

    Reps who develop a separate competitive strategy for
    all their opportunities are more likely to make quota.


           Global                 UK    UK + EU                EMEA   N. America
             45%                 61%       95%                 74%       25%


Source: Dealmaker Index November 2012


                                        © The TAS Group 2012
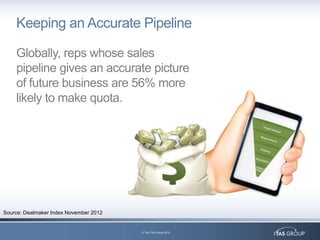
Keeping an Accurate Pipeline

    Globally, reps whose sales
    pipeline gives an accurate picture
    of future business are 56% more
    likely to make quota.


Source: Dealmaker Index November 2012


                                        © The TAS Group 2012
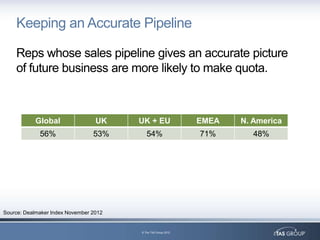
Keeping an Accurate Pipeline

    Reps whose sales pipeline gives an accurate picture
    of future business are more likely to make quota.


           Global                 UK    UK + EU                EMEA   N. America
             56%                 53%       54%                 71%       48%


Source: Dealmaker Index November 2012


                                        © The TAS Group 2012
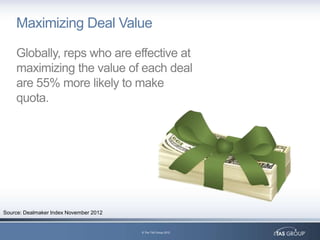
Maximizing Deal Value

    Globally, reps who are effective at
    maximizing the value of each deal
    are 55% more likely to make
    quota.


Source: Dealmaker Index November 2012


                                        © The TAS Group 2012
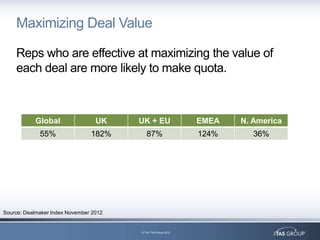
Maximizing Deal Value

    Reps who are effective at maximizing the value of
    each deal are more likely to make quota.


           Global                 UK    UK + EU                EMEA   N. America
             55%                182%       87%                 124%      36%


Source: Dealmaker Index November 2012


                                        © The TAS Group 2012
Advising Your Customer

    Globally, reps who consider it
    their job to advise a customer if
    they are making a bad decision
    are 54% more likely to make
    quota.


Source: Dealmaker Index November 2012


                                        © The TAS Group 2012
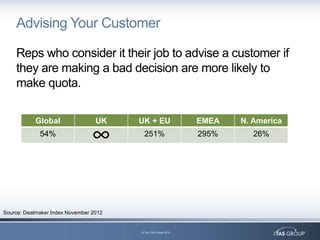
Advising Your Customer

    Reps who consider it their job to advise a customer if
    they are making a bad decision are more likely to
    make quota.

           Global                 UK    UK + EU                EMEA   N. America
             54%                         251%                  295%      26%


Source: Dealmaker Index November 2012


                                        © The TAS Group 2012
Executing Your Sales Process

    Globally, reps who understand
    and execute their sales process
    are 72% more likely to make
    quota.


Source: Dealmaker Index November 2012


                                        © The TAS Group 2012
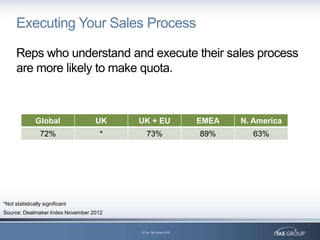
Executing Your Sales Process

      Reps who understand and execute their sales process
      are more likely to make quota.


               Global             UK    UK + EU                EMEA   N. America
                 72%               *       73%                 89%       63%


*Not statistically significant
Source: Dealmaker Index November 2012


                                        © The TAS Group 2012
Managing Your Sales Process

    Globally, reps who have and use
    a defined sales process for
    managing their forecast are 48%
    more likely to make quota.


Source: Dealmaker Index November 2012


                                        © The TAS Group 2012
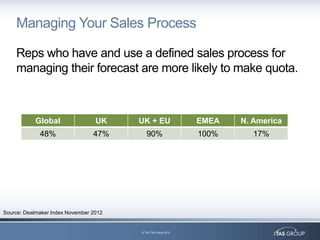
Managing Your Sales Process

    Reps who have and use a defined sales process for
    managing their forecast are more likely to make quota.


           Global                 UK    UK + EU                EMEA   N. America
             48%                 47%       90%                 100%      17%


Source: Dealmaker Index November 2012


                                        © The TAS Group 2012
Agenda
• What is the Dealmaker Index?
• Recap from Part One
• Global and Regional Findings
• How you can use the Index


                           © The TAS Group 2012
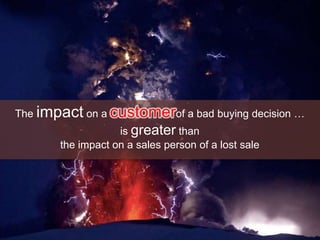
Social
 Media
  impact
The      customer
           on a
           greateris           than
                                              of a bad buying decision …

      the impact on a sales person of a lost sale


 Impact to
 businesses
                       © The TAS Group 2012
© The TAS Group 2012
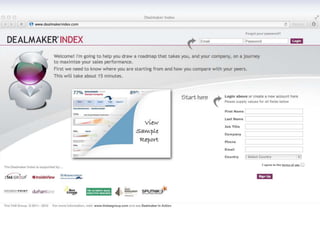
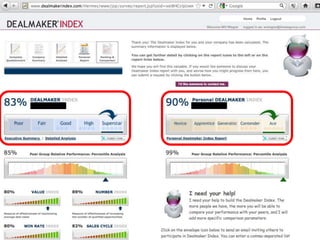
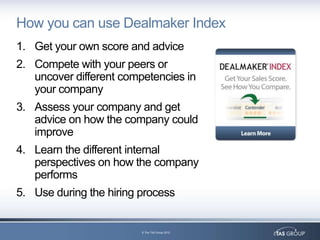
How you can use Dealmaker Index
1. Get your own score and advice
2. Compete with your peers or
   uncover different competencies in
   your company
3. Assess your company and get
   advice on how the company could
   improve
4. Learn the different internal
   perspectives on how the company
   performs
5. Use during the hiring process


                         © The TAS Group 2012
Dealmaker Index Study 2012


                © The TAS Group 2012
Summary


• Alignment, process and methodology
  help you improve quota and win rate
• Specific opportunities exist to improve
  sales performance
• Dealmaker Index will help you improve


                             © The TAS Group 2012
The TAS Group. Sell Smarter. Manage Better.


                    © The TAS Group 2012
© The TAS Group 2012
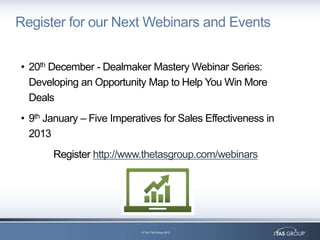
Register for our Next Webinars and Events


• 20th December - Dealmaker Mastery Webinar Series:
  Developing an Opportunity Map to Help You Win More
  Deals
• 9th January – Five Imperatives for Sales Effectiveness in
  2013
       Register http://www.thetasgroup.com/webinars


                            © The TAS Group 2012
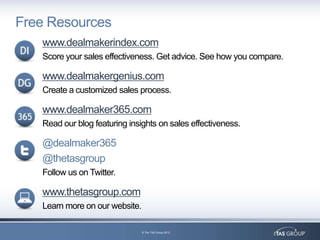
Free Resources
   www.dealmakerindex.com
   Score your sales effectiveness. Get advice. See how you compare.

   www.dealmakergenius.com
   Create a customized sales process.

   www.dealmaker365.com
   Read our blog featuring insights on sales effectiveness.

   @dealmaker365
   @thetasgroup
   Follow us on Twitter.

   www.thetasgroup.com
   Learn more on our website.

                                © The TAS Group 2012
Questions?


             © The TAS Group 2012
Where You Can Find Us


 www.thetasgroup.com
 • US 866.570.3836
 • UK +44(0)1189 880 149
 • International +353(0) 1 6788 900
 • marketing@thetasgroup.com
 • Twitter: @thetasgroup


                                      © The TAS Group 2012
The TAS Group Webinar

The Global Sales Industry –
Part 2: A Regional Perspective
Will Wiegler, CMO, The TAS Group