SlideShare a Scribd company logo
1 of 14
Download to read offline
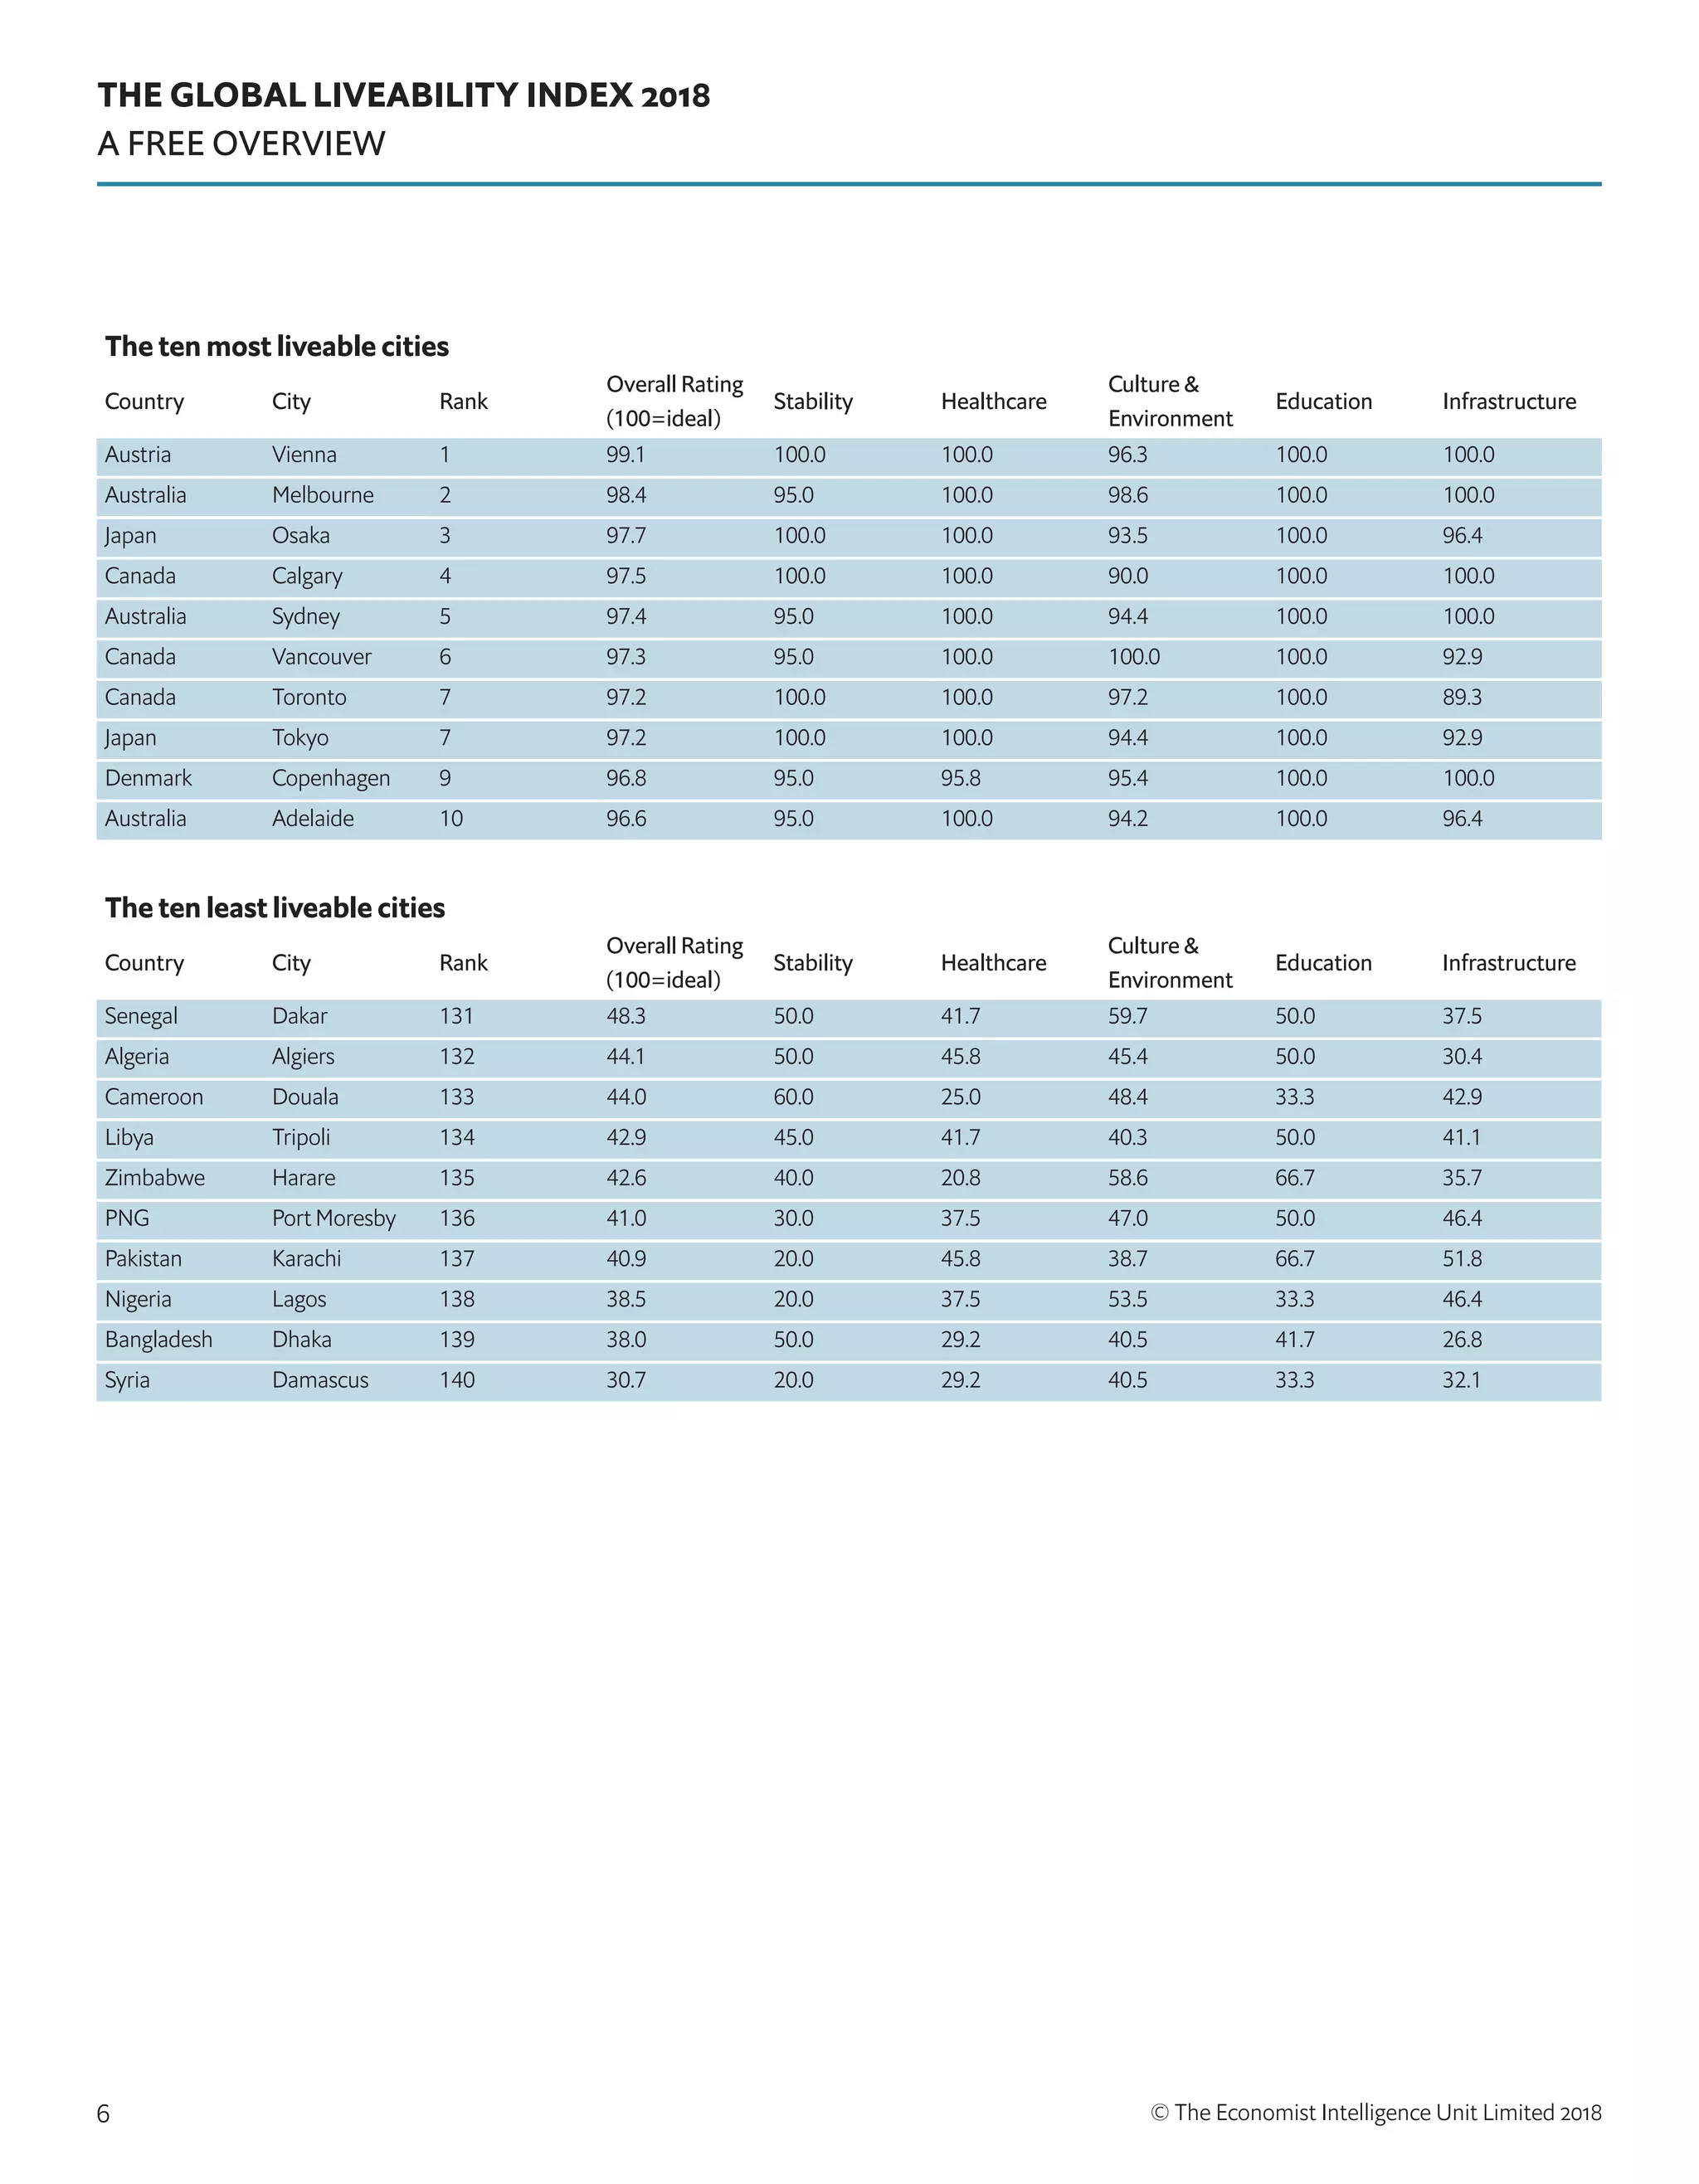
A report by The Economist Intelligence Unit
The Global Liveability Index 2018
A free overview
The world leader in global business intelligence
The Economist Intelligence Unit (The EIU) is the research and analysis division of The Economist Group, the sister company
to The Economist newspaper. Created in 1946, we have over 70 years’ experience in helping businesses, financial firms and
governments to understand how the world is changing and how that creates opportunities to be seized and risks to be managed.
Given that many of the issues facing the world have an international (if not global) dimension, The EIU is ideally positioned to be
commentator, interpreter and forecaster on the phenomenon of globalisation as it gathers pace and impact.
EIU subscription services
The world’s leading organisations rely on our subscription services for data, analysis and forecasts to keep them informed about
what is happening around the world. We specialise in:
‱ Country Analysis: Access to regular, detailed country-specific economic and political forecasts, as well as assessments of
the business and regulatory environments in different markets.
‱ Risk Analysis: Our risk services identify actual and potential threats around the world and help our clients understand the
implications for their organisations.
‱ Industry Analysis: Five year forecasts, analysis of key themes and news analysis for six key industries in 60 major
economies. These forecasts are based on the latest data and in-depth analysis of industry trends.
EIU Consulting
EIU Consulting is a bespoke service designed to provide solutions specific to our customers’ needs. We specialise in these key
sectors:
‱ EIU Consumer: We help consumer-facing companies to enter new markets as well as deliver greater success in current
markets. We work globally, supporting senior management with strategic initiatives, MA due diligence, demand forecasting
and other issues of fundamental importance to their corporations. Find out more at eiu.com/consumer
‱ Healthcare: Together with our two specialised consultancies, Bazian and Clearstate, The EIU helps healthcare organisations
build and maintain successful and sustainable businesses across the healthcare ecosystem. Find out more at: eiu.com/
healthcare
‱ Public Policy: Trusted by the sector’s most influential stakeholders, our global public policy practice provides evidence-
based research for policy-makers and stakeholders seeking clear and measurable outcomes. Find out more at: eiu.com/
publicpolicy
The Economist Corporate Network
The Economist Corporate Network (ECN) is The Economist Group’s advisory service for organisational leaders seeking to better
understand the economic and business environments of global markets. Delivering independent, thought-provoking content,
ECN provides clients with the knowledge, insight, and interaction that support better-informed strategies and decisions.
The Network is part of The Economist Intelligence Unit and is led by experts with in-depth understanding of the geographies and
markets they oversee. The Network’s membership-based operations cover Asia-Pacific, the Middle East, and Africa. Through a
distinctive blend of interactive conferences, specially designed events, C-suite discussions, member briefings, and high-calibre
research, The Economist Corporate Network delivers a range of macro (global, regional, national, and territorial) as well as
industry-focused analysis on prevailing conditions and forecast trends.
THE GLOBAL LIVEABILITY INDEX 2018
A FREE OVERVIEW
© The Economist Intelligence Unit Limited 20181
The findings of the latest liveability survey 2
After years of destabilisation, a return to relative global stability 2
Civil war and terrorism in the worst performing cities have been globally destabilising 5
The top and bottom ten cities 5
About The Economist Intelligence Unit’s liveability survey 7
How the rating works 7
The suggested liveability scale 7
How the rating is calculated 7
Contents
THE GLOBAL LIVEABILITY INDEX 2018
A FREE OVERVIEW
© The Economist Intelligence Unit Limited 20182
The findings of the latest liveability survey
After years of destabilisation, a return to relative global
stability
For the first time in this survey’s history, Austria’s capital, Vienna, ranks as the most liveable of the 140
cities surveyed by The Economist Intelligence Unit. A long-running contender to the title, Vienna has
succeeded in displacing Melbourne from the top spot, ending a record seven consecutive years at
the head of the survey for the Australian city. Although both Melbourne and Vienna have registered
improvements in liveability over the last six months, increases in Vienna’s ratings, particularly in
the stability category, have been enough for the city to overtake Melbourne. The two cities are now
separated by 0.7 of a percentage point, with Vienna scoring a near-ideal 99.1 out of 100 and Melbourne
scoring 98.4.
Two other Australian cities feature in the top-ranked places: Sydney (5th) and Adelaide (10th), while
only one other European city made the top ten. This is Copenhagen in Denmark, in 9th place, after its
score increased by 3.3 percentage points since the last survey cycle. The rest of the top-ranked cities are
split between Japan (Osaka in 3rd place and Tokyo in joint 7th, alongside Toronto) and Canada (Calgary
in 4th, and Vancouver and Toronto in 6th and 7th respectively). Osaka stands out especially, having
climbed six positions, to third place, over the past six months, closing the gap with Melbourne. It is now
separated from the former top-ranked city by a mere 0.7 of a percentage point. Osaka’s improvements in
scores for quality and availability of public transportation, as well as a consistent decline in crime rates,
have contributed to higher ratings in the infrastructure and stability categories respectively.
Upwards movement in the top ranked cities is a reflection of improvements seen in stability and
safety across most regions in the past year. Whereas in the past, cities in Europe have been affected by
the spreading perceived threat of terrorism in the region, which caused heightened security measures,
the past six months have seen a return to normalcy. Yet, during this period, 116 cities of the 140 surveyed
have experienced changes in their ranking position. This rises to 128 cities when looking at changes over
the past year.
It must be noted that ranking movements do not necessarily arise from a change in liveability in the
cities themselves, but reflect how cities compare with one another. Although four cities have fallen from
the top ten over the past year—Auckland (from 8th to 12th), Perth (from 7th to 14th), Helsinki (from 9th
to 16th) and Hamburg (from 10th to 18th)—none of these have seen a fall in their overall scores during
this period. New Zealand’s Auckland has in fact registered a minor improvement. Changes in liveability
elsewhere can therefore have a significant impact on the rankings of individual cities.
Of the 140 surveyed cities, 49% registered negative changes in their overall liveability rank in the past
six months and 34% experienced positive movements (the rest did not record any change). Yet, despite
the total number of negative movements outweighing the positive ones, the rankings show that overall
liveability across all cities surveyed increased by 0.7% in the past six months and 0.9% in the past year.
Improvements were recorded across all five categories measured—infrastructure, stability, education,
healthcare, and culture and environment—but especially in stability, which increased by 2.5% overall.
THE GLOBAL LIVEABILITY INDEX 2018
A FREE OVERVIEW
© The Economist Intelligence Unit Limited 20183
This trend reflects positive developments in this category, despite threats of terrorism and unrest
that cities around the world continue to grapple with. Only ten cities have registered a decline in their
liveability ratings over the past six months, largely reflecting an impact on cultural and environmental
indicators.
The prolonged period of relative stability has resulted in the stabilisation of terrorism threat scores
in several cities, especially in Western Europe. The only cities that have seen a fall in their stability
indicators over the past six months are Abu Dhabi (71st) and Dubai (69th) in the United Arab Emirates
(UAE), Colombo (130th) in Sri Lanka and Warsaw (65th) in Poland. In Abu Dhabi and Dubai, the threat
of military conflict has increased owing to the UAE’s recent interventions extending its military reach
in Yemen and Somalia. The UAE’s deployment of armed forces in Yemen, as well as political hostility
with Iran, continue to pose a threat in the country and the region. Sri Lanka’s declaration of a temporary
nationwide state of emergency in March, following clashes between Sinhalese Buddhist and Tamil
Muslim communities, impacted Colombo’s civil unrest score. The threat of civil unrest also increased
in Warsaw as an estimated 60,000 people joined a nationalist march on the occasion of Poland’s
Independence Day in November 2017. Nevertheless, these changes have caused a decline in the overall
stability rating only in Colombo’s case. Warsaw, for instance, has experienced a decline in the threat of
terrorism to counteract the fall in the civil unrest score, while Abu Dhabi and Dubai saw improvements
in their crime and civil unrest ratings.
The impact of improving stability is most apparent when a five-year view of the global average
scores is taken. Overall, the global average liveability score has increased by 0.15%, to 75.7%, over the
past five years, while the average stability rating has increased by 1.3%. Although the threat of terrorism
has indeed caused a decline in liveability over a longer period—the global average liveability score has
decreased by 0.4% in the past decade—an improvement in scores over the past five years suggests a
gradual return to relative stability.
During this period, 103 of the 140 cities surveyed have seen some change in overall liveability scores.
Of these, 60 have seen improvements in liveability. Four cities in particular—Abidjan in Cîte d’Ivoire,
Hanoi in Vietnam, Belgrade in Serbia and Tehran in Iran—have seen increases of 5 percentage points or
more. Over the past twelve months Kiev has also seen a significant improvement in liveability, reflecting
a pick-up in economic growth and relative political stability despite the Donbas conflict.
Although the cities ranked among the most liveable in the world remain largely unchanged, there has
been pronounced movement within the top tier of liveability. Of the 66 cities with scores of 80 or more,
which are considered as the top tier, 40 have seen a change in score in the past twelve months. Changes
in overall scores have been positive for all cities except Houston, which saw a decline in its infrastructure
rating. An improvement in stability has been the underlying factor affecting movements in the most
liveable cities, with the top tier registering an overall increase of 3.4% in its average stability score. Of
the top-ranked cities, Paris in France and Manchester in the UK recorded the biggest improvements
over the past 12 months, both in overall scores and stability ratings. Although they have been subject to
high-profile terrorist attacks in recent years, which have shaken stability and led to cumbersome security
measures, both cities have shown resilience in the face of adversity. Nevertheless, with such high scores
already in place, the impact of these improvements has not been enough to significantly affect liveability
in any of the top-tier cities. In fact although, 19 percentage points separate Vienna in first place from
Nouméa in New Caledonia in 66th place, all cities in this tier can lay claim to being on an equal footing in
terms of presenting few, if any, challenges to residents’ lifestyles.
THE GLOBAL LIVEABILITY INDEX 2018
A FREE OVERVIEW
© The Economist Intelligence Unit Limited 20184
Nonetheless, there does appear to be a correlation between the types of cities that sit at the very
top of the ranking. Those that score best tend to be mid-sized cities in wealthier countries. Several
cities in the top ten also have relatively low population density. These can foster a range of recreational
activities without leading to high crime levels or overburdened infrastructure. Six of the top ten scoring
cities are in Australia and Canada, which have, respectively, population densities of 3.2 and 4 people
per square kilometre. These densities compare with a global (land) average of 58 and a US average of
35.6, according to the latest World Bank statistics, from 2017. Austria and Japan buck this trend, with
respective densities of 106.7 and 347.8 people per square kilometre. However, Vienna’s city-proper
population of 1.9m and Osaka’s population of 2.7m are relatively small compared with metropolises such
as New York, London and Paris.
It may be argued that violent crime is on an upward trend in the top tier of cities, but these
observations are not always correct. Although crime rates are perceived as rising in Australia and
Europe, cities in these regions continue to boast lower violent and petty crime rates than the rest of the
world. Some of the lowest murder rates in the world were recorded in Austria and Japan. The murder
rate in Austria was just 0.61 per 100,000 people in 2017, and in Japan it was 0.72 per 100,000 people. This
compares with a murder rate of 3 per 100,000 people in New Delhi in 2016 and an estimated homicide
rate of 104 per 100,000 people in Caracas—according to the Venezuelan Observatory of Violence—in
2017.
Global business centres tend to be victims of their own success. The “big city buzz” that they enjoy
can overstretch infrastructure and cause higher crime rates. New York (57th), London (48th) and Paris
(19th) are all prestigious hubs with a wealth of recreational activities, but all suffer from higher levels of
crime, congestion and public transport problems than are deemed comfortable. The question is how
much wages, the cost of living and personal taste for a location can offset liveability factors. Although
many global centres fare less well in the ranking than mid-sized cities, for example, they still sit within
the highest tier of liveability and should therefore be considered broadly comparable, especially when
contrasted with the worst-scoring locations.
Five biggest improvers (last five years)
City Country Rank (out of 140)
Overall Rating
(100=ideal)
five year movement %
Abidjan Cote d’Ivoire 124 52.2 6.3
Hanoi Vietnam 107 59.7 5.5
Belgrade Serbia 82 72.2 5
Tehran Iran 128 50.8 5
Ho Chi Minh City Vietnam 116 57.1 4.4
Five biggest decliners (last five years)
City Country Rank (out of 140)
Overall Rating
(100=ideal)
five year movement %
Kiev Ukraine 118 56.6 -12.6
San Juan Puerto Rico 89 69.8 -8.9
Damascus Syria 140 30.7 -7.7
Caracas Venezuela 126 51.3 -5.1
Asuncion Paraguay 102 64.3 -4.5
THE GLOBAL LIVEABILITY INDEX 2018
A FREE OVERVIEW
© The Economist Intelligence Unit Limited 20185
Civil war and terrorism in the worst performing cities have
been globally destabilising
Of the poorer-scoring cities, eleven occupy the very bottom tier of liveability, where ratings fall below
50% and most aspects of living are severely restricted. Damascus has seen a stabilisation in its dramatic
decline in liveability but remains ranked at the bottom of the 140 cities surveyed, with a liveability score
that is 7.3% lower than the second lowest ranking city in the survey, Dhaka in Bangladesh.
The relatively small number of cities in the bottom tier of liveability partly reflects the intended
scope of the ranking—the survey is designed to address a range of cities or business centres that
people might want to live in or visit. For example, the survey does not include locations such as Kabul
in Afghanistan or Baghdad in Iraq. Although few would argue that Damascus in Syria and Tripoli in
Libya are likely to attract visitors at present, despite them registering recent improvements, their
inclusion in the survey reflects cities that were deemed relatively stable before the 2011 Arab Spring.
With the exception of crisis-hit cities, the low number of cities in the bottom tier also reflects a degree
of convergence, where levels of liveability are generally expected to improve in developing economies
over time. This long-term trend has been upset by the heightened, widespread reach of terrorism over
the past five years.
The rankings of cities like Damascus, Karachi and Tripoli suggest that conflict is responsible for
many of the lowest scores. This is not only because stability indicators have the highest single scores
but also because factors defining stability can spread to have an adverse effect on other categories.
For example, conflict will not just cause disruption in its own right, it will also damage infrastructure,
overburden hospitals and undermine the availability of goods, services and recreational activities.
Unavailability of adequate infrastructure is also responsible for many of the lowest scores. This is
particularly visible in the ranks of cities like Dhaka (Bangladesh, 139th), Harare (Zimbabwe, 135th),
Douala (Cameroon, 133rd) and Dakar (Senegal, 131st). Nevertheless, the impact of stability indicators,
especially those related to crime, cannot be understated for some of these cities. The Middle East,
Africa and Asia account for the ten lowest-scoring cities in the survey where violence, whether through
crime, civil insurgency, terrorism or war, has played a strong role.
The top and bottom ten cities
Below is a ranking of the top and bottom cities surveyed, accompanied by the liveability rating for
every city. The liveability score is the combination of all the factors surveyed across the five main
categories. Scores are also given for each category. The full ranking report can be purchased at
store.eiu.com/product/global-liveability-survey/
THE GLOBAL LIVEABILITY INDEX 2018
A FREE OVERVIEW
© The Economist Intelligence Unit Limited 20186
The ten most liveable cities
Country City Rank
Overall Rating
(100=ideal)
Stability Healthcare
Culture 
Environment
Education Infrastructure
Austria Vienna 1 99.1 100.0 100.0 96.3 100.0 100.0
Australia Melbourne 2 98.4 95.0 100.0 98.6 100.0 100.0
Japan Osaka 3 97.7 100.0 100.0 93.5 100.0 96.4
Canada Calgary 4 97.5 100.0 100.0 90.0 100.0 100.0
Australia Sydney 5 97.4 95.0 100.0 94.4 100.0 100.0
Canada Vancouver 6 97.3 95.0 100.0 100.0 100.0 92.9
Canada Toronto 7 97.2 100.0 100.0 97.2 100.0 89.3
Japan Tokyo 7 97.2 100.0 100.0 94.4 100.0 92.9
Denmark Copenhagen 9 96.8 95.0 95.8 95.4 100.0 100.0
Australia Adelaide 10 96.6 95.0 100.0 94.2 100.0 96.4
The ten least liveable cities
Country City Rank
Overall Rating
(100=ideal)
Stability Healthcare
Culture 
Environment
Education Infrastructure
Senegal Dakar 131 48.3 50.0 41.7 59.7 50.0 37.5
Algeria Algiers 132 44.1 50.0 45.8 45.4 50.0 30.4
Cameroon Douala 133 44.0 60.0 25.0 48.4 33.3 42.9
Libya Tripoli 134 42.9 45.0 41.7 40.3 50.0 41.1
Zimbabwe Harare 135 42.6 40.0 20.8 58.6 66.7 35.7
PNG Port Moresby 136 41.0 30.0 37.5 47.0 50.0 46.4
Pakistan Karachi 137 40.9 20.0 45.8 38.7 66.7 51.8
Nigeria Lagos 138 38.5 20.0 37.5 53.5 33.3 46.4
Bangladesh Dhaka 139 38.0 50.0 29.2 40.5 41.7 26.8
Syria Damascus 140 30.7 20.0 29.2 40.5 33.3 32.1
THE GLOBAL LIVEABILITY INDEX 2018
A FREE OVERVIEW
© The Economist Intelligence Unit Limited 20187
How the rating works
The concept of liveability is simple: it assesses which locations around the world provide the best or the
worst living conditions. Assessing liveability has a broad range of uses, from benchmarking perceptions
of development levels to assigning a hardship allowance as part of expatriate relocation packages.
The Economist Intelligence Unit’s liveability rating quantifies the challenges that might be presented to
an individual’s lifestyle in any given location, and allows for direct comparison between locations.
Every city is assigned a rating of relative comfort for over 30 qualitative and quantitative factors
across five broad categories: stability, healthcare, culture and environment, education, and
infrastructure. Each factor in a city is rated as acceptable, tolerable, uncomfortable, undesirable or
intolerable. For quali­tative indicators, a rating is awarded based on the judgment of in-house analysts
and in-city contributors. For quantitative indicators, a rating is calcul­ated based on the relative
performance of a number of external data points.
The scores are then compiled and weighted to provide a score of 1–100, where 1 is considered
intolerable and 100 is considered ideal. The liveability rating is provided both as an overall score and as a
score for each category. To provide points of reference, the score is also given for each category relative
to New York and an overall position in the ranking of 140 cities is provided.
The suggested liveability scale
Companies pay a premium (usually a percentage of a salary) to employees who move to cities where
living conditions are particularly difficult and there is excessive physical hardship or a notably unhealthy
environment.
We have given a suggested allowance to correspond with the rating. However, the actual level of the
allowance is often a matter of company policy. It is not uncommon, for example, for companies to pay
higher allowances—perhaps up to double our suggested level.
How the rating is calculated
The liveability score is reached through category weights, which are equally divided into relevant
subcategories to ensure that the score covers as many indicators as possible. Indicators are scored as
acceptable, tolerable, uncomfortable, undesirable or intolerable. These are then weighted to produce a
rating, where 100 means that liveability in a city is ideal and 1 means that it is intolerable.
About The Economist Intelligence Unit’s
liveability survey
Rating Description Suggested allowance (%)
80-100 There are few, if any, challenges to living standards 0
70-80 Day–to–day living is fine, in general, but some aspects of life may entail problems 5
60-70 Negative factors have an impact on day-to-day living 10
50-60 Liveability is substantially constrained 15
50 or less Most aspects of living are severely restricted 20
THE GLOBAL LIVEABILITY INDEX 2018
A FREE OVERVIEW
© The Economist Intelligence Unit Limited 20188
Category 1: Stability (weight: 25% of total)
Indicator Source
Prevalence of petty crime EIU rating
Prevalence of violent crime EIU rating
Threat of terror EIU rating
Threat of military conflict EIU rating
Threat of civil unrest/conflict EIU rating
For qualitative variables, an “EIU rating” is awarded based on the judgment of in‑house expert
country analysts and a field correspondent based in each city. For quantitative variables, a rating is
calculated based on the relative performance of a location using external data sources.
Category 4: Education (weight: 10% of total)
Indicator Source
Availability of private education EIU rating
Quality of private education EIU rating
Public education indicators Adapted from World Bank
Category 3: Culture  Environment (weight: 25% of total)
Indicator Source
Humidity/temperature rating Adapted from average weather conditions
Discomfort of climate to travellers EIU rating
Level of corruption Adapted from Transparency International
Social or religious restrictions EIU rating
Level of censorship EIU rating
Sporting availability EIU field rating of 3 sport indicators
Cultural availability EIU field rating of 4 cultural indicators
Food  drink EIU field rating of 4 cultural indicators
Consumer goods  services EIU rating of product availability
Category 2: Healthcare (weight: 20% of total)
Indicator Source
Availability of private healthcare EIU rating
Quality of private healthcare EIU rating
Availability of public healthcare EIU rating
Quality of public healthcare EIU rating
Availability of over-the-counter drugs EIU rating
General healthcare indicators Adapted from World Bank
THE GLOBAL LIVEABILITY INDEX 2018
A FREE OVERVIEW
© The Economist Intelligence Unit Limited 20189
Category 5: Infrastructure (weight: 20% of total)
Indicator Source
Quality of road network EIU rating
Quality of public transport EIU rating
Quality of international links EIU rating
Availability of good quality housing EIU rating
Quality of energy provision EIU rating
Quality of water provision EIU rating
Quality of telecommunications EIU rating
© The Economist Intelligence Unit Limited 201810
TheLiveabilitySurvey
LiveabilitySurveyprovidesafullreportofTheEIU’sliveabilityratingsfor140citiesaroundtheworld.This
includesaone-pageoverviewforeachofthe140citiescoveredaswellasTheEIU’sratingsforeach city on
thefullsetofover30qualitativeandquantitativefactors.Inthisranking:
‱Eachofthe30factorsineachcityisratedasacceptable,tolerable,uncomfortable,undesirable or
intolerable.
‱Thecategoriesarecompiledandweightedtoprovideanoverallratingof1–100,where1isconsidered
intolerableand100isconsideredideal.
‱Theliveabilityrankingconsidersthatanycitywitharatingof80ormorewillhavefew,ifany,
challengestolivingstandards.Anycitywithascoreoflessthan50willseemostaspectsofliving
severelyrestricted.
PurchasetheLiveabilitySurvey.
LiveabilityRankingandOverview
ThisreportprovidesacompleteoverviewofTheEIU’sliveabilityratingsfor140citiesaroundthe world.
Thisincludes:
‱Asummaryoffindingsandadescriptionofthemethodologyused.
‱Tableslistingtherankingposition,overallliveabilityscoreandaveragescoresforallcitiesacross each
ofthefivecategories:stability,healthcare,cultureandenvironment,educationandinfrastructure.
PurchasetheLiveabilityRankingandOverview.
LiveabilityMatrix
TheLiveabilityMatrixisaninteractiveExcelworkbookthatranksall140citiesonover30qualitative and
quantitativefactorsacrossthefivecategories.
PurchasetheLiveabilityMatrix.
Related Reports
WorldwideCostofLiving
TheWorldwideCostofLivingSurveycontainsarankingof133citiesontheirrelativeexpensiveness,based
onasurveywhichcomparesmorethan400individualpricesacross160productsandservices.In addition
totherankingtable,thereportlooksatthekeytrendsaffectingthecostoflivingindifferentcities across
theworld.
Findoutmoreat:eiu.com/wcol
Liveability products available to purchase from The EIU
Cover image - © Mistervlad/Shutterstock
Copyright
© 2018 The Economist Intelligence Unit Limited. All
rights reserved. Neither this publication nor any part
of it may be reproduced, stored in a retrieval system, or
transmitted in any form or by any means, electronic,
mechanical, photocopying, recording or otherwise,
without the prior permission of The Economist
Intelligence Unit Limited.
While every effort has been taken to verify the
accuracy of this information, The Economist
Intelligence Unit Ltd. cannot accept any
responsibility or liability for reliance by any person
on this report or any of the information, opinions
or conclusions set out in this report.
LONDON
20 Cabot Square
London
E14 4QW
United Kingdom
Tel: +44 (0) 20 7576 8181
Email: london@eiu.com
NEW YORK
750 Third Avenue
5th Floor
New York, NY 10017
United States
Tel: + 1 212 698 9717
Email: americas@eiu.com
HONG KONG
1301 Cityplaza Four
12 Taikoo Wan Road
Taikoo Shing
Hong Kong
Tel: + 852 2802 7288
Email: asia@eiu.com

More Related Content

What's hot

The State of the State 2017-2018
The State of the State 2017-2018The State of the State 2017-2018
The State of the State 2017-2018Ipsos UK
 
OECD Government at a Glance 2013
OECD Government at a Glance 2013OECD Government at a Glance 2013
OECD Government at a Glance 2013adamlerouge
 
Trends Shaping Education 2016
Trends Shaping Education 2016Trends Shaping Education 2016
Trends Shaping Education 2016EduSkills OECD
 
Ageing and productivity growth in OECD regions - Federica Daniele, Taku Honid...
Ageing and productivity growth in OECD regions - Federica Daniele, Taku Honid...Ageing and productivity growth in OECD regions - Federica Daniele, Taku Honid...
Ageing and productivity growth in OECD regions - Federica Daniele, Taku Honid...OECD CFE
 
B&A consumer confidence tracker july 2014
B&A consumer confidence tracker july 2014B&A consumer confidence tracker july 2014
B&A consumer confidence tracker july 2014lukereaper
 
Jp ec98 mauro-corruption-and_the_composition_of_government_expenditure
Jp ec98 mauro-corruption-and_the_composition_of_government_expenditureJp ec98 mauro-corruption-and_the_composition_of_government_expenditure
Jp ec98 mauro-corruption-and_the_composition_of_government_expenditureLhiny19
 
Vieslekcija: Globālās ekonomikas tendences
Vieslekcija: Globālās ekonomikas tendencesVieslekcija: Globālās ekonomikas tendences
Vieslekcija: Globālās ekonomikas tendencesLatvijas Banka
 
Anz euriasia asia_s_economy_taking_centre_stage
Anz euriasia asia_s_economy_taking_centre_stageAnz euriasia asia_s_economy_taking_centre_stage
Anz euriasia asia_s_economy_taking_centre_stageRepublikaDigital
 
Building Economics assaignment.
Building Economics assaignment.Building Economics assaignment.
Building Economics assaignment.Integrated Design
 
MitKat India Risk Review 2017
MitKat India Risk Review 2017MitKat India Risk Review 2017
MitKat India Risk Review 2017Malcolm Cooper
 
Global peace-index-2018-2
Global peace-index-2018-2Global peace-index-2018-2
Global peace-index-2018-2tsnua
 

What's hot (12)

The State of the State 2017-2018
The State of the State 2017-2018The State of the State 2017-2018
The State of the State 2017-2018
 
OECD Government at a Glance 2013
OECD Government at a Glance 2013OECD Government at a Glance 2013
OECD Government at a Glance 2013
 
Trends Shaping Education 2016
Trends Shaping Education 2016Trends Shaping Education 2016
Trends Shaping Education 2016
 
Ageing and productivity growth in OECD regions - Federica Daniele, Taku Honid...
Ageing and productivity growth in OECD regions - Federica Daniele, Taku Honid...Ageing and productivity growth in OECD regions - Federica Daniele, Taku Honid...
Ageing and productivity growth in OECD regions - Federica Daniele, Taku Honid...
 
B&A consumer confidence tracker july 2014
B&A consumer confidence tracker july 2014B&A consumer confidence tracker july 2014
B&A consumer confidence tracker july 2014
 
Jp ec98 mauro-corruption-and_the_composition_of_government_expenditure
Jp ec98 mauro-corruption-and_the_composition_of_government_expenditureJp ec98 mauro-corruption-and_the_composition_of_government_expenditure
Jp ec98 mauro-corruption-and_the_composition_of_government_expenditure
 
Vieslekcija: Globālās ekonomikas tendences
Vieslekcija: Globālās ekonomikas tendencesVieslekcija: Globālās ekonomikas tendences
Vieslekcija: Globālās ekonomikas tendences
 
Anz euriasia asia_s_economy_taking_centre_stage
Anz euriasia asia_s_economy_taking_centre_stageAnz euriasia asia_s_economy_taking_centre_stage
Anz euriasia asia_s_economy_taking_centre_stage
 
Building Economics assaignment.
Building Economics assaignment.Building Economics assaignment.
Building Economics assaignment.
 
MitKat India Risk Review 2017
MitKat India Risk Review 2017MitKat India Risk Review 2017
MitKat India Risk Review 2017
 
Global peace-index-2018-2
Global peace-index-2018-2Global peace-index-2018-2
Global peace-index-2018-2
 
Global peace-index-2018-2
Global peace-index-2018-2Global peace-index-2018-2
Global peace-index-2018-2
 

Similar to The global liveability_Index_2018

Global liveability index 2021
Global liveability index 2021 Global liveability index 2021
Global liveability index 2021 David Mora
 
A report by The Economist Intelligence UnitDemocracy Index.docx
A report by The Economist Intelligence UnitDemocracy Index.docxA report by The Economist Intelligence UnitDemocracy Index.docx
A report by The Economist Intelligence UnitDemocracy Index.docxaryan532920
 
A report by The Economist Intelligence UnitDemocracy Index.docx
A report by The Economist Intelligence UnitDemocracy Index.docxA report by The Economist Intelligence UnitDemocracy Index.docx
A report by The Economist Intelligence UnitDemocracy Index.docxevonnehoggarth79783
 
Relatório da Economist distribuído a grandes bancos diz que Brasil tem “alto ...
Relatório da Economist distribuído a grandes bancos diz que Brasil tem “alto ...Relatório da Economist distribuído a grandes bancos diz que Brasil tem “alto ...
Relatório da Economist distribuído a grandes bancos diz que Brasil tem “alto ...diariodocentrodomundo
 
Paper tigers: Chinese and Indian capital markets
Paper tigers: Chinese and Indian capital marketsPaper tigers: Chinese and Indian capital markets
Paper tigers: Chinese and Indian capital marketsThe Economist Media Businesses
 
Democracy Index 2019
Democracy Index 2019Democracy Index 2019
Democracy Index 2019Dody Wijaya
 
Eiu democracy index 2020
Eiu democracy index 2020Eiu democracy index 2020
Eiu democracy index 2020sabrangsabrang
 
Índice da Democracia 2020
Índice da Democracia 2020Índice da Democracia 2020
Índice da Democracia 2020Paulo Dñmaso
 
EIU ASEAN cities - stirring the melting pot - oct 2016
EIU ASEAN cities - stirring the melting pot - oct 2016EIU ASEAN cities - stirring the melting pot - oct 2016
EIU ASEAN cities - stirring the melting pot - oct 2016Karen KM Lim, MPIA, CPP
 
Measuring well being and progress brochure
Measuring well being and progress brochureMeasuring well being and progress brochure
Measuring well being and progress brochureDr Lendy Spires
 
Global peace index 2016 full report
Global peace index 2016 full reportGlobal peace index 2016 full report
Global peace index 2016 full reportAdil Mahmood
 
Â«Đ“Đ»ĐŸĐ±Đ°Đ»ŃŒĐœŃ‹Đč ĐžĐœĐŽĐ”Đșс ĐŒĐžŃ€ĐŸĐ»ŃŽĐ±ĐžŃÂ» 2016
Â«Đ“Đ»ĐŸĐ±Đ°Đ»ŃŒĐœŃ‹Đč ĐžĐœĐŽĐ”Đșс ĐŒĐžŃ€ĐŸĐ»ŃŽĐ±ĐžŃÂ» 2016 Â«Đ“Đ»ĐŸĐ±Đ°Đ»ŃŒĐœŃ‹Đč ĐžĐœĐŽĐ”Đșс ĐŒĐžŃ€ĐŸĐ»ŃŽĐ±ĐžŃÂ» 2016
Â«Đ“Đ»ĐŸĐ±Đ°Đ»ŃŒĐœŃ‹Đč ĐžĐœĐŽĐ”Đșс ĐŒĐžŃ€ĐŸĐ»ŃŽĐ±ĐžŃÂ» 2016 John Connor
 
Informe de Paz global. Chile el mejor de Sudamerica.
Informe de Paz global. Chile el mejor de Sudamerica.Informe de Paz global. Chile el mejor de Sudamerica.
Informe de Paz global. Chile el mejor de Sudamerica.Alexis Diomedi Pacheco
 
Global peace index report 2015
Global peace index report 2015Global peace index report 2015
Global peace index report 2015John Connor
 
Banking finance-and-income-inequality
Banking finance-and-income-inequalityBanking finance-and-income-inequality
Banking finance-and-income-inequalityIFLab
 

Similar to The global liveability_Index_2018 (20)

Global liveability index 2021
Global liveability index 2021 Global liveability index 2021
Global liveability index 2021
 
Worldwide cost of_living_2019_free_report
Worldwide cost of_living_2019_free_reportWorldwide cost of_living_2019_free_report
Worldwide cost of_living_2019_free_report
 
A report by The Economist Intelligence UnitDemocracy Index.docx
A report by The Economist Intelligence UnitDemocracy Index.docxA report by The Economist Intelligence UnitDemocracy Index.docx
A report by The Economist Intelligence UnitDemocracy Index.docx
 
A report by The Economist Intelligence UnitDemocracy Index.docx
A report by The Economist Intelligence UnitDemocracy Index.docxA report by The Economist Intelligence UnitDemocracy Index.docx
A report by The Economist Intelligence UnitDemocracy Index.docx
 
Relatório da Economist distribuído a grandes bancos diz que Brasil tem “alto ...
Relatório da Economist distribuído a grandes bancos diz que Brasil tem “alto ...Relatório da Economist distribuído a grandes bancos diz que Brasil tem “alto ...
Relatório da Economist distribuído a grandes bancos diz que Brasil tem “alto ...
 
Paper tigers: Chinese and Indian capital markets
Paper tigers: Chinese and Indian capital marketsPaper tigers: Chinese and Indian capital markets
Paper tigers: Chinese and Indian capital markets
 
Democracy Index 2019
Democracy Index 2019Democracy Index 2019
Democracy Index 2019
 
Eiu democracy index 2020
Eiu democracy index 2020Eiu democracy index 2020
Eiu democracy index 2020
 
Índice da Democracia 2020
Índice da Democracia 2020Índice da Democracia 2020
Índice da Democracia 2020
 
EIU ASEAN cities - stirring the melting pot - oct 2016
EIU ASEAN cities - stirring the melting pot - oct 2016EIU ASEAN cities - stirring the melting pot - oct 2016
EIU ASEAN cities - stirring the melting pot - oct 2016
 
Measuring well being and progress brochure
Measuring well being and progress brochureMeasuring well being and progress brochure
Measuring well being and progress brochure
 
Global peace index 2016 full report
Global peace index 2016 full reportGlobal peace index 2016 full report
Global peace index 2016 full report
 
Â«Đ“Đ»ĐŸĐ±Đ°Đ»ŃŒĐœŃ‹Đč ĐžĐœĐŽĐ”Đșс ĐŒĐžŃ€ĐŸĐ»ŃŽĐ±ĐžŃÂ» 2016
Â«Đ“Đ»ĐŸĐ±Đ°Đ»ŃŒĐœŃ‹Đč ĐžĐœĐŽĐ”Đșс ĐŒĐžŃ€ĐŸĐ»ŃŽĐ±ĐžŃÂ» 2016 Â«Đ“Đ»ĐŸĐ±Đ°Đ»ŃŒĐœŃ‹Đč ĐžĐœĐŽĐ”Đșс ĐŒĐžŃ€ĐŸĐ»ŃŽĐ±ĐžŃÂ» 2016
Â«Đ“Đ»ĐŸĐ±Đ°Đ»ŃŒĐœŃ‹Đč ĐžĐœĐŽĐ”Đșс ĐŒĐžŃ€ĐŸĐ»ŃŽĐ±ĐžŃÂ» 2016
 
October 2014 Coming Soon
October 2014 Coming SoonOctober 2014 Coming Soon
October 2014 Coming Soon
 
Democracy index 2018
Democracy index 2018Democracy index 2018
Democracy index 2018
 
The new silk road
The new silk road The new silk road
The new silk road
 
Global peace index report 2015
Global peace index report 2015Global peace index report 2015
Global peace index report 2015
 
Informe de Paz global. Chile el mejor de Sudamerica.
Informe de Paz global. Chile el mejor de Sudamerica.Informe de Paz global. Chile el mejor de Sudamerica.
Informe de Paz global. Chile el mejor de Sudamerica.
 
Global peace index report 2015
Global peace index report 2015Global peace index report 2015
Global peace index report 2015
 
Banking finance-and-income-inequality
Banking finance-and-income-inequalityBanking finance-and-income-inequality
Banking finance-and-income-inequality
 

More from tsnua

Ukrnafta.pdf
Ukrnafta.pdfUkrnafta.pdf
Ukrnafta.pdftsnua
 
ĐĄĐżĐžŃĐŸĐș 215 Đ·ĐČŃ–Đ»ŃŒĐœĐ”ĐœĐžŃ… уĐșŃ€Đ°Ń—ĐœŃ†Ń–ĐČ Đ· Ń€ĐŸŃŃ–ĐčсьĐșĐŸĐłĐŸ ĐżĐŸĐ»ĐŸĐœŃƒ
ĐĄĐżĐžŃĐŸĐș 215 Đ·ĐČŃ–Đ»ŃŒĐœĐ”ĐœĐžŃ… уĐșŃ€Đ°Ń—ĐœŃ†Ń–ĐČ Đ· Ń€ĐŸŃŃ–ĐčсьĐșĐŸĐłĐŸ ĐżĐŸĐ»ĐŸĐœŃƒĐĄĐżĐžŃĐŸĐș 215 Đ·ĐČŃ–Đ»ŃŒĐœĐ”ĐœĐžŃ… уĐșŃ€Đ°Ń—ĐœŃ†Ń–ĐČ Đ· Ń€ĐŸŃŃ–ĐčсьĐșĐŸĐłĐŸ ĐżĐŸĐ»ĐŸĐœŃƒ
ĐĄĐżĐžŃĐŸĐș 215 Đ·ĐČŃ–Đ»ŃŒĐœĐ”ĐœĐžŃ… уĐșŃ€Đ°Ń—ĐœŃ†Ń–ĐČ Đ· Ń€ĐŸŃŃ–ĐčсьĐșĐŸĐłĐŸ ĐżĐŸĐ»ĐŸĐœŃƒtsnua
 
Đ›ĐŸĐ¶ĐșŃ–Đœ
Đ›ĐŸĐ¶ĐșŃ–ĐœĐ›ĐŸĐ¶ĐșŃ–Đœ
Đ›ĐŸĐ¶ĐșŃ–Đœtsnua
 
ĐžĐœĐŸĐČĐ»Đ”ĐœĐžĐč пДрДліĐș, ĐœĐ° ĐŸŃĐœĐŸĐČі яĐșĐŸĐłĐŸ ĐČĐœŃƒŃ‚Ń€Ń–ŃˆĐœŃŒĐŸ ĐżĐ”Ń€Đ”ĐŒŃ–Ń‰Đ”ĐœĐžĐŒ ĐŸŃĐŸĐ±Đ°ĐŒ Đ·ĐŽŃ–ĐčŃĐœŃŽĐČĐ°Ń‚ĐžĐŒ...
ĐžĐœĐŸĐČĐ»Đ”ĐœĐžĐč пДрДліĐș, ĐœĐ° ĐŸŃĐœĐŸĐČі яĐșĐŸĐłĐŸ ĐČĐœŃƒŃ‚Ń€Ń–ŃˆĐœŃŒĐŸ ĐżĐ”Ń€Đ”ĐŒŃ–Ń‰Đ”ĐœĐžĐŒ ĐŸŃĐŸĐ±Đ°ĐŒ Đ·ĐŽŃ–ĐčŃĐœŃŽĐČĐ°Ń‚ĐžĐŒ...ĐžĐœĐŸĐČĐ»Đ”ĐœĐžĐč пДрДліĐș, ĐœĐ° ĐŸŃĐœĐŸĐČі яĐșĐŸĐłĐŸ ĐČĐœŃƒŃ‚Ń€Ń–ŃˆĐœŃŒĐŸ ĐżĐ”Ń€Đ”ĐŒŃ–Ń‰Đ”ĐœĐžĐŒ ĐŸŃĐŸĐ±Đ°ĐŒ Đ·ĐŽŃ–ĐčŃĐœŃŽĐČĐ°Ń‚ĐžĐŒ...
ĐžĐœĐŸĐČĐ»Đ”ĐœĐžĐč пДрДліĐș, ĐœĐ° ĐŸŃĐœĐŸĐČі яĐșĐŸĐłĐŸ ĐČĐœŃƒŃ‚Ń€Ń–ŃˆĐœŃŒĐŸ ĐżĐ”Ń€Đ”ĐŒŃ–Ń‰Đ”ĐœĐžĐŒ ĐŸŃĐŸĐ±Đ°ĐŒ Đ·ĐŽŃ–ĐčŃĐœŃŽĐČĐ°Ń‚ĐžĐŒ...tsnua
 
ЗаĐșĐŸĐœ ĐżŃ€ĐŸ Đ·Đ°ĐżŃ€ĐŸĐČĐ°ĐŽĐ¶Đ”ĐœĐœŃ ĐœĐ°ĐŽĐ·ĐČочаĐčĐœĐŸĐłĐŸ ŃŃ‚Đ°ĐœŃƒ ĐČ ĐŁĐșŃ€Đ°Ń—ĐœŃ–
ЗаĐșĐŸĐœ ĐżŃ€ĐŸ Đ·Đ°ĐżŃ€ĐŸĐČĐ°ĐŽĐ¶Đ”ĐœĐœŃ ĐœĐ°ĐŽĐ·ĐČочаĐčĐœĐŸĐłĐŸ ŃŃ‚Đ°ĐœŃƒ ĐČ ĐŁĐșŃ€Đ°Ń—ĐœŃ–Đ—Đ°ĐșĐŸĐœ ĐżŃ€ĐŸ Đ·Đ°ĐżŃ€ĐŸĐČĐ°ĐŽĐ¶Đ”ĐœĐœŃ ĐœĐ°ĐŽĐ·ĐČочаĐčĐœĐŸĐłĐŸ ŃŃ‚Đ°ĐœŃƒ ĐČ ĐŁĐșŃ€Đ°Ń—ĐœŃ–
ЗаĐșĐŸĐœ ĐżŃ€ĐŸ Đ·Đ°ĐżŃ€ĐŸĐČĐ°ĐŽĐ¶Đ”ĐœĐœŃ ĐœĐ°ĐŽĐ·ĐČочаĐčĐœĐŸĐłĐŸ ŃŃ‚Đ°ĐœŃƒ ĐČ ĐŁĐșŃ€Đ°Ń—ĐœŃ–tsnua
 
ĐŸŃ–ĐŽĐŸĐ·Ń€Đ° ĐŸĐ”Ń‚Ń€Ńƒ ĐŸĐŸŃ€ĐŸŃˆĐ”ĐœĐșу
ĐŸŃ–ĐŽĐŸĐ·Ń€Đ° ĐŸĐ”Ń‚Ń€Ńƒ ĐŸĐŸŃ€ĐŸŃˆĐ”ĐœĐșŃƒĐŸŃ–ĐŽĐŸĐ·Ń€Đ° ĐŸĐ”Ń‚Ń€Ńƒ ĐŸĐŸŃ€ĐŸŃˆĐ”ĐœĐșу
ĐŸŃ–ĐŽĐŸĐ·Ń€Đ° ĐŸĐ”Ń‚Ń€Ńƒ ĐŸĐŸŃ€ĐŸŃˆĐ”ĐœĐșуtsnua
 
Đ„Đ°Ń€Ń‚Ń–Ń ŃŃ‚Ń€Đ°Ń‚Đ”ĐłŃ–Ń‡ĐœĐŸĐłĐŸ ĐżĐ°Ń€Ń‚ĐœĐ”Ń€ŃŃ‚ĐČĐ° ХКА – ĐŁĐșŃ€Đ°Ń—ĐœĐ°
Đ„Đ°Ń€Ń‚Ń–Ń ŃŃ‚Ń€Đ°Ń‚Đ”ĐłŃ–Ń‡ĐœĐŸĐłĐŸ ĐżĐ°Ń€Ń‚ĐœĐ”Ń€ŃŃ‚ĐČĐ° ХКА – ĐŁĐșŃ€Đ°Ń—ĐœĐ°Đ„Đ°Ń€Ń‚Ń–Ń ŃŃ‚Ń€Đ°Ń‚Đ”ĐłŃ–Ń‡ĐœĐŸĐłĐŸ ĐżĐ°Ń€Ń‚ĐœĐ”Ń€ŃŃ‚ĐČĐ° ХКА – ĐŁĐșŃ€Đ°Ń—ĐœĐ°
Đ„Đ°Ń€Ń‚Ń–Ń ŃŃ‚Ń€Đ°Ń‚Đ”ĐłŃ–Ń‡ĐœĐŸĐłĐŸ ĐżĐ°Ń€Ń‚ĐœĐ”Ń€ŃŃ‚ĐČĐ° ХКА – ĐŁĐșŃ€Đ°Ń—ĐœĐ°tsnua
 
Weapons of the war in Ukraine
Weapons of the war in UkraineWeapons of the war in Ukraine
Weapons of the war in Ukrainetsnua
 
Лост ĐŽĐŸ ĐżĐ”Ń€ŃˆĐŸĐłĐŸ ĐČŃ–Ń†Đ”ĐżŃ€Đ”ĐŒâ€™Ń”Ń€-ĐŒŃ–ĐœŃ–ŃŃ‚Ń€Đ°, ĐŒŃ–ĐœŃ–ŃŃ‚Ń€Đ° Đ”ĐșĐŸĐœĐŸĐŒŃ–ĐșĐž ОлДĐșсія Đ›ŃŽĐ±Ń‡Đ”ĐœĐșĐ° ĐČіЮ...
Лост ĐŽĐŸ ĐżĐ”Ń€ŃˆĐŸĐłĐŸ ĐČŃ–Ń†Đ”ĐżŃ€Đ”ĐŒâ€™Ń”Ń€-ĐŒŃ–ĐœŃ–ŃŃ‚Ń€Đ°, ĐŒŃ–ĐœŃ–ŃŃ‚Ń€Đ° Đ”ĐșĐŸĐœĐŸĐŒŃ–ĐșĐž ОлДĐșсія Đ›ŃŽĐ±Ń‡Đ”ĐœĐșĐ° ĐČіЮ...Лост ĐŽĐŸ ĐżĐ”Ń€ŃˆĐŸĐłĐŸ ĐČŃ–Ń†Đ”ĐżŃ€Đ”ĐŒâ€™Ń”Ń€-ĐŒŃ–ĐœŃ–ŃŃ‚Ń€Đ°, ĐŒŃ–ĐœŃ–ŃŃ‚Ń€Đ° Đ”ĐșĐŸĐœĐŸĐŒŃ–ĐșĐž ОлДĐșсія Đ›ŃŽĐ±Ń‡Đ”ĐœĐșĐ° ĐČіЮ...
Лост ĐŽĐŸ ĐżĐ”Ń€ŃˆĐŸĐłĐŸ ĐČŃ–Ń†Đ”ĐżŃ€Đ”ĐŒâ€™Ń”Ń€-ĐŒŃ–ĐœŃ–ŃŃ‚Ń€Đ°, ĐŒŃ–ĐœŃ–ŃŃ‚Ń€Đ° Đ”ĐșĐŸĐœĐŸĐŒŃ–ĐșĐž ОлДĐșсія Đ›ŃŽĐ±Ń‡Đ”ĐœĐșĐ° ĐČіЮ...tsnua
 
ЗĐČĐ”Ń€ĐœĐ”ĐœĐœŃ Đ’Đ”Ń€Ń…ĐŸĐČĐœĐŸŃ— Đ Đ°ĐŽĐž Ń‰ĐŸĐŽĐŸ ĐżĐŸŃĐžĐ»Đ”ĐœĐœŃ ĐŒŃ–Đ¶ĐœĐ°Ń€ĐŸĐŽĐœĐŸĐłĐŸ спіĐČŃ€ĐŸĐ±Ń–Ń‚ĐœĐžŃ†Ń‚ĐČĐ° ĐČ Ń€Đ°ĐŒĐșах...
ЗĐČĐ”Ń€ĐœĐ”ĐœĐœŃ Đ’Đ”Ń€Ń…ĐŸĐČĐœĐŸŃ— Đ Đ°ĐŽĐž Ń‰ĐŸĐŽĐŸ ĐżĐŸŃĐžĐ»Đ”ĐœĐœŃ ĐŒŃ–Đ¶ĐœĐ°Ń€ĐŸĐŽĐœĐŸĐłĐŸ спіĐČŃ€ĐŸĐ±Ń–Ń‚ĐœĐžŃ†Ń‚ĐČĐ° ĐČ Ń€Đ°ĐŒĐșах...ЗĐČĐ”Ń€ĐœĐ”ĐœĐœŃ Đ’Đ”Ń€Ń…ĐŸĐČĐœĐŸŃ— Đ Đ°ĐŽĐž Ń‰ĐŸĐŽĐŸ ĐżĐŸŃĐžĐ»Đ”ĐœĐœŃ ĐŒŃ–Đ¶ĐœĐ°Ń€ĐŸĐŽĐœĐŸĐłĐŸ спіĐČŃ€ĐŸĐ±Ń–Ń‚ĐœĐžŃ†Ń‚ĐČĐ° ĐČ Ń€Đ°ĐŒĐșах...
ЗĐČĐ”Ń€ĐœĐ”ĐœĐœŃ Đ’Đ”Ń€Ń…ĐŸĐČĐœĐŸŃ— Đ Đ°ĐŽĐž Ń‰ĐŸĐŽĐŸ ĐżĐŸŃĐžĐ»Đ”ĐœĐœŃ ĐŒŃ–Đ¶ĐœĐ°Ń€ĐŸĐŽĐœĐŸĐłĐŸ спіĐČŃ€ĐŸĐ±Ń–Ń‚ĐœĐžŃ†Ń‚ĐČĐ° ĐČ Ń€Đ°ĐŒĐșах...tsnua
 
ĐŸĐŸŃŃ‚Đ°ĐœĐŸĐČĐ° Đ’Đ”Ń€Ń…ĐŸĐČĐœĐŸŃ— Đ Đ°ĐŽĐž Ń‰ĐŸĐŽĐŸ ĐšŃ€ĐžĐŒŃƒ
ĐŸĐŸŃŃ‚Đ°ĐœĐŸĐČĐ° Đ’Đ”Ń€Ń…ĐŸĐČĐœĐŸŃ— Đ Đ°ĐŽĐž Ń‰ĐŸĐŽĐŸ ĐšŃ€ĐžĐŒŃƒĐŸĐŸŃŃ‚Đ°ĐœĐŸĐČĐ° Đ’Đ”Ń€Ń…ĐŸĐČĐœĐŸŃ— Đ Đ°ĐŽĐž Ń‰ĐŸĐŽĐŸ ĐšŃ€ĐžĐŒŃƒ
ĐŸĐŸŃŃ‚Đ°ĐœĐŸĐČĐ° Đ’Đ”Ń€Ń…ĐŸĐČĐœĐŸŃ— Đ Đ°ĐŽĐž Ń‰ĐŸĐŽĐŸ ĐšŃ€ĐžĐŒŃƒtsnua
 
ЗаяĐČĐ° 1+1 ĐżŃ€ĐŸ ĐșŃ€ĐžĐŒŃ–ĐœĐ°Đ»ŃŒĐœĐ” праĐČĐŸĐżĐŸŃ€ŃƒŃˆĐ”ĐœĐœŃ
ЗаяĐČĐ° 1+1 ĐżŃ€ĐŸ ĐșŃ€ĐžĐŒŃ–ĐœĐ°Đ»ŃŒĐœĐ” праĐČĐŸĐżĐŸŃ€ŃƒŃˆĐ”ĐœĐœŃĐ—Đ°ŃĐČĐ° 1+1 ĐżŃ€ĐŸ ĐșŃ€ĐžĐŒŃ–ĐœĐ°Đ»ŃŒĐœĐ” праĐČĐŸĐżĐŸŃ€ŃƒŃˆĐ”ĐœĐœŃ
ЗаяĐČĐ° 1+1 ĐżŃ€ĐŸ ĐșŃ€ĐžĐŒŃ–ĐœĐ°Đ»ŃŒĐœĐ” праĐČĐŸĐżĐŸŃ€ŃƒŃˆĐ”ĐœĐœŃtsnua
 
ЛотĐČĐ° ĐŸĐłĐŸĐ»ĐŸŃĐžĐ»Đ° ĐĐœĐ°Ń‚ĐŸĐ»Ń–Ń йарія ĐżĐ”Ń€ŃĐŸĐœĐŸŃŽ ĐœĐŸĐœ Ò‘Ń€Đ°Ń‚Đ°
ЛотĐČĐ° ĐŸĐłĐŸĐ»ĐŸŃĐžĐ»Đ° ĐĐœĐ°Ń‚ĐŸĐ»Ń–Ń йарія ĐżĐ”Ń€ŃĐŸĐœĐŸŃŽ ĐœĐŸĐœ Ò‘Ń€Đ°Ń‚Đ°Đ›ĐžŃ‚ĐČĐ° ĐŸĐłĐŸĐ»ĐŸŃĐžĐ»Đ° ĐĐœĐ°Ń‚ĐŸĐ»Ń–Ń йарія ĐżĐ”Ń€ŃĐŸĐœĐŸŃŽ ĐœĐŸĐœ Ò‘Ń€Đ°Ń‚Đ°
ЛотĐČĐ° ĐŸĐłĐŸĐ»ĐŸŃĐžĐ»Đ° ĐĐœĐ°Ń‚ĐŸĐ»Ń–Ń йарія ĐżĐ”Ń€ŃĐŸĐœĐŸŃŽ ĐœĐŸĐœ Ò‘Ń€Đ°Ń‚Đ°tsnua
 
ĐŸĐŸĐČĐœĐžĐč ŃĐżĐžŃĐŸĐș ĐŸĐ±ĐŒĐ”Đ¶Đ”ĐœŃŒ
ĐŸĐŸĐČĐœĐžĐč ŃĐżĐžŃĐŸĐș ĐŸĐ±ĐŒĐ”Đ¶Đ”ĐœŃŒĐŸĐŸĐČĐœĐžĐč ŃĐżĐžŃĐŸĐș ĐŸĐ±ĐŒĐ”Đ¶Đ”ĐœŃŒ
ĐŸĐŸĐČĐœĐžĐč ŃĐżĐžŃĐŸĐș ĐŸĐ±ĐŒĐ”Đ¶Đ”ĐœŃŒtsnua
 
Đ“ĐŸĐ»ĐŸŃŃƒĐČĐ°ĐœĐœŃ Đ·Đ° "харĐșіĐČсьĐșі ŃƒĐłĐŸĐŽĐž" 2010 Ń€ĐŸĐșу
Đ“ĐŸĐ»ĐŸŃŃƒĐČĐ°ĐœĐœŃ Đ·Đ° "харĐșіĐČсьĐșі ŃƒĐłĐŸĐŽĐž" 2010 Ń€ĐŸĐșŃƒĐ“ĐŸĐ»ĐŸŃŃƒĐČĐ°ĐœĐœŃ Đ·Đ° "харĐșіĐČсьĐșі ŃƒĐłĐŸĐŽĐž" 2010 Ń€ĐŸĐșу
Đ“ĐŸĐ»ĐŸŃŃƒĐČĐ°ĐœĐœŃ Đ·Đ° "харĐșіĐČсьĐșі ŃƒĐłĐŸĐŽĐž" 2010 Ń€ĐŸĐșуtsnua
 
ЗĐČĐ”Ń€ĐœĐ”ĐœĐœŃ партії "За ĐŒĐ°ĐčĐ±ŃƒŃ‚ĐœŃ”" ĐŽĐŸ Đ’ĐŸĐ»ĐŸĐŽĐžĐŒĐžŃ€Đ° Đ—Đ”Đ»Đ”ĐœŃŃŒĐșĐŸĐłĐŸ
ЗĐČĐ”Ń€ĐœĐ”ĐœĐœŃ партії "За ĐŒĐ°ĐčĐ±ŃƒŃ‚ĐœŃ”" ĐŽĐŸ Đ’ĐŸĐ»ĐŸĐŽĐžĐŒĐžŃ€Đ° Đ—Đ”Đ»Đ”ĐœŃŃŒĐșĐŸĐłĐŸĐ—ĐČĐ”Ń€ĐœĐ”ĐœĐœŃ партії "За ĐŒĐ°ĐčĐ±ŃƒŃ‚ĐœŃ”" ĐŽĐŸ Đ’ĐŸĐ»ĐŸĐŽĐžĐŒĐžŃ€Đ° Đ—Đ”Đ»Đ”ĐœŃŃŒĐșĐŸĐłĐŸ
ЗĐČĐ”Ń€ĐœĐ”ĐœĐœŃ партії "За ĐŒĐ°ĐčĐ±ŃƒŃ‚ĐœŃ”" ĐŽĐŸ Đ’ĐŸĐ»ĐŸĐŽĐžĐŒĐžŃ€Đ° Đ—Đ”Đ»Đ”ĐœŃŃŒĐșĐŸĐłĐŸtsnua
 
ЗĐČĐ”Ń€ĐœĐ”ĐœĐœŃ партії "За ĐŒĐ°ĐčĐ±ŃƒŃ‚ĐœŃ”" ĐŽĐŸ ĐšĐŒĐžĐłĐ°Đ»Ń
ЗĐČĐ”Ń€ĐœĐ”ĐœĐœŃ партії "За ĐŒĐ°ĐčĐ±ŃƒŃ‚ĐœŃ”" ĐŽĐŸ ĐšĐŒĐžĐłĐ°Đ»ŃĐ—ĐČĐ”Ń€ĐœĐ”ĐœĐœŃ партії "За ĐŒĐ°ĐčĐ±ŃƒŃ‚ĐœŃ”" ĐŽĐŸ ĐšĐŒĐžĐłĐ°Đ»Ń
ЗĐČĐ”Ń€ĐœĐ”ĐœĐœŃ партії "За ĐŒĐ°ĐčĐ±ŃƒŃ‚ĐœŃ”" ĐŽĐŸ ĐšĐŒĐžĐłĐ°Đ»Ńtsnua
 
ĐŁĐșĐ°Đ· ĐżŃ€Đ”Đ·ĐžĐŽĐ”ĐœŃ‚Đ° ĐŁĐșŃ€Đ°Ń—ĐœĐž №64/2021
ĐŁĐșĐ°Đ· ĐżŃ€Đ”Đ·ĐžĐŽĐ”ĐœŃ‚Đ° ĐŁĐșŃ€Đ°Ń—ĐœĐž №64/2021ĐŁĐșĐ°Đ· ĐżŃ€Đ”Đ·ĐžĐŽĐ”ĐœŃ‚Đ° ĐŁĐșŃ€Đ°Ń—ĐœĐž №64/2021
ĐŁĐșĐ°Đ· ĐżŃ€Đ”Đ·ĐžĐŽĐ”ĐœŃ‚Đ° ĐŁĐșŃ€Đ°Ń—ĐœĐž №64/2021tsnua
 
Đ”ĐŸĐŽĐ°Ń‚ĐŸĐș №2 ĐŽĐŸ Ń€Ń–ŃˆĐ”ĐœĐœŃ РНБО ĐżŃ€ĐŸ Đ·Đ°ĐżŃ€ĐŸĐČĐ°ĐŽĐ¶Đ”ĐœĐœŃ ŃĐ°ĐœĐșціĐč ĐżŃ€ĐŸŃ‚Đž ВіĐșŃ‚ĐŸŃ€Đ° ĐœĐ”ĐŽĐČĐ”ĐŽŃ‡ŃƒĐșĐ°...
Đ”ĐŸĐŽĐ°Ń‚ĐŸĐș №2 ĐŽĐŸ Ń€Ń–ŃˆĐ”ĐœĐœŃ РНБО ĐżŃ€ĐŸ Đ·Đ°ĐżŃ€ĐŸĐČĐ°ĐŽĐ¶Đ”ĐœĐœŃ ŃĐ°ĐœĐșціĐč ĐżŃ€ĐŸŃ‚Đž ВіĐșŃ‚ĐŸŃ€Đ° ĐœĐ”ĐŽĐČĐ”ĐŽŃ‡ŃƒĐșĐ°...Đ”ĐŸĐŽĐ°Ń‚ĐŸĐș №2 ĐŽĐŸ Ń€Ń–ŃˆĐ”ĐœĐœŃ РНБО ĐżŃ€ĐŸ Đ·Đ°ĐżŃ€ĐŸĐČĐ°ĐŽĐ¶Đ”ĐœĐœŃ ŃĐ°ĐœĐșціĐč ĐżŃ€ĐŸŃ‚Đž ВіĐșŃ‚ĐŸŃ€Đ° ĐœĐ”ĐŽĐČĐ”ĐŽŃ‡ŃƒĐșĐ°...
Đ”ĐŸĐŽĐ°Ń‚ĐŸĐș №2 ĐŽĐŸ Ń€Ń–ŃˆĐ”ĐœĐœŃ РНБО ĐżŃ€ĐŸ Đ·Đ°ĐżŃ€ĐŸĐČĐ°ĐŽĐ¶Đ”ĐœĐœŃ ŃĐ°ĐœĐșціĐč ĐżŃ€ĐŸŃ‚Đž ВіĐșŃ‚ĐŸŃ€Đ° ĐœĐ”ĐŽĐČĐ”ĐŽŃ‡ŃƒĐșĐ°...tsnua
 
Đ”ĐŸĐŽĐ°Ń‚ĐŸĐș №1 ĐŽĐŸ Ń€Ń–ŃˆĐ”ĐœĐœŃ РНБО ĐżŃ€ĐŸ Đ·Đ°ĐżŃ€ĐŸĐČĐ°ĐŽĐ¶Đ”ĐœĐœŃ ŃĐ°ĐœĐșціĐč ĐżŃ€ĐŸŃ‚Đž ВіĐșŃ‚ĐŸŃ€Đ° ĐœĐ”ĐŽĐČĐ”ĐŽŃ‡ŃƒĐșĐ°...
Đ”ĐŸĐŽĐ°Ń‚ĐŸĐș №1 ĐŽĐŸ Ń€Ń–ŃˆĐ”ĐœĐœŃ РНБО ĐżŃ€ĐŸ Đ·Đ°ĐżŃ€ĐŸĐČĐ°ĐŽĐ¶Đ”ĐœĐœŃ ŃĐ°ĐœĐșціĐč ĐżŃ€ĐŸŃ‚Đž ВіĐșŃ‚ĐŸŃ€Đ° ĐœĐ”ĐŽĐČĐ”ĐŽŃ‡ŃƒĐșĐ°...Đ”ĐŸĐŽĐ°Ń‚ĐŸĐș №1 ĐŽĐŸ Ń€Ń–ŃˆĐ”ĐœĐœŃ РНБО ĐżŃ€ĐŸ Đ·Đ°ĐżŃ€ĐŸĐČĐ°ĐŽĐ¶Đ”ĐœĐœŃ ŃĐ°ĐœĐșціĐč ĐżŃ€ĐŸŃ‚Đž ВіĐșŃ‚ĐŸŃ€Đ° ĐœĐ”ĐŽĐČĐ”ĐŽŃ‡ŃƒĐșĐ°...
Đ”ĐŸĐŽĐ°Ń‚ĐŸĐș №1 ĐŽĐŸ Ń€Ń–ŃˆĐ”ĐœĐœŃ РНБО ĐżŃ€ĐŸ Đ·Đ°ĐżŃ€ĐŸĐČĐ°ĐŽĐ¶Đ”ĐœĐœŃ ŃĐ°ĐœĐșціĐč ĐżŃ€ĐŸŃ‚Đž ВіĐșŃ‚ĐŸŃ€Đ° ĐœĐ”ĐŽĐČĐ”ĐŽŃ‡ŃƒĐșĐ°...tsnua
 

More from tsnua (20)

Ukrnafta.pdf
Ukrnafta.pdfUkrnafta.pdf
Ukrnafta.pdf
 
ĐĄĐżĐžŃĐŸĐș 215 Đ·ĐČŃ–Đ»ŃŒĐœĐ”ĐœĐžŃ… уĐșŃ€Đ°Ń—ĐœŃ†Ń–ĐČ Đ· Ń€ĐŸŃŃ–ĐčсьĐșĐŸĐłĐŸ ĐżĐŸĐ»ĐŸĐœŃƒ
ĐĄĐżĐžŃĐŸĐș 215 Đ·ĐČŃ–Đ»ŃŒĐœĐ”ĐœĐžŃ… уĐșŃ€Đ°Ń—ĐœŃ†Ń–ĐČ Đ· Ń€ĐŸŃŃ–ĐčсьĐșĐŸĐłĐŸ ĐżĐŸĐ»ĐŸĐœŃƒĐĄĐżĐžŃĐŸĐș 215 Đ·ĐČŃ–Đ»ŃŒĐœĐ”ĐœĐžŃ… уĐșŃ€Đ°Ń—ĐœŃ†Ń–ĐČ Đ· Ń€ĐŸŃŃ–ĐčсьĐșĐŸĐłĐŸ ĐżĐŸĐ»ĐŸĐœŃƒ
ĐĄĐżĐžŃĐŸĐș 215 Đ·ĐČŃ–Đ»ŃŒĐœĐ”ĐœĐžŃ… уĐșŃ€Đ°Ń—ĐœŃ†Ń–ĐČ Đ· Ń€ĐŸŃŃ–ĐčсьĐșĐŸĐłĐŸ ĐżĐŸĐ»ĐŸĐœŃƒ
 
Đ›ĐŸĐ¶ĐșŃ–Đœ
Đ›ĐŸĐ¶ĐșŃ–ĐœĐ›ĐŸĐ¶ĐșŃ–Đœ
Đ›ĐŸĐ¶ĐșŃ–Đœ
 
ĐžĐœĐŸĐČĐ»Đ”ĐœĐžĐč пДрДліĐș, ĐœĐ° ĐŸŃĐœĐŸĐČі яĐșĐŸĐłĐŸ ĐČĐœŃƒŃ‚Ń€Ń–ŃˆĐœŃŒĐŸ ĐżĐ”Ń€Đ”ĐŒŃ–Ń‰Đ”ĐœĐžĐŒ ĐŸŃĐŸĐ±Đ°ĐŒ Đ·ĐŽŃ–ĐčŃĐœŃŽĐČĐ°Ń‚ĐžĐŒ...
ĐžĐœĐŸĐČĐ»Đ”ĐœĐžĐč пДрДліĐș, ĐœĐ° ĐŸŃĐœĐŸĐČі яĐșĐŸĐłĐŸ ĐČĐœŃƒŃ‚Ń€Ń–ŃˆĐœŃŒĐŸ ĐżĐ”Ń€Đ”ĐŒŃ–Ń‰Đ”ĐœĐžĐŒ ĐŸŃĐŸĐ±Đ°ĐŒ Đ·ĐŽŃ–ĐčŃĐœŃŽĐČĐ°Ń‚ĐžĐŒ...ĐžĐœĐŸĐČĐ»Đ”ĐœĐžĐč пДрДліĐș, ĐœĐ° ĐŸŃĐœĐŸĐČі яĐșĐŸĐłĐŸ ĐČĐœŃƒŃ‚Ń€Ń–ŃˆĐœŃŒĐŸ ĐżĐ”Ń€Đ”ĐŒŃ–Ń‰Đ”ĐœĐžĐŒ ĐŸŃĐŸĐ±Đ°ĐŒ Đ·ĐŽŃ–ĐčŃĐœŃŽĐČĐ°Ń‚ĐžĐŒ...
ĐžĐœĐŸĐČĐ»Đ”ĐœĐžĐč пДрДліĐș, ĐœĐ° ĐŸŃĐœĐŸĐČі яĐșĐŸĐłĐŸ ĐČĐœŃƒŃ‚Ń€Ń–ŃˆĐœŃŒĐŸ ĐżĐ”Ń€Đ”ĐŒŃ–Ń‰Đ”ĐœĐžĐŒ ĐŸŃĐŸĐ±Đ°ĐŒ Đ·ĐŽŃ–ĐčŃĐœŃŽĐČĐ°Ń‚ĐžĐŒ...
 
ЗаĐșĐŸĐœ ĐżŃ€ĐŸ Đ·Đ°ĐżŃ€ĐŸĐČĐ°ĐŽĐ¶Đ”ĐœĐœŃ ĐœĐ°ĐŽĐ·ĐČочаĐčĐœĐŸĐłĐŸ ŃŃ‚Đ°ĐœŃƒ ĐČ ĐŁĐșŃ€Đ°Ń—ĐœŃ–
ЗаĐșĐŸĐœ ĐżŃ€ĐŸ Đ·Đ°ĐżŃ€ĐŸĐČĐ°ĐŽĐ¶Đ”ĐœĐœŃ ĐœĐ°ĐŽĐ·ĐČочаĐčĐœĐŸĐłĐŸ ŃŃ‚Đ°ĐœŃƒ ĐČ ĐŁĐșŃ€Đ°Ń—ĐœŃ–Đ—Đ°ĐșĐŸĐœ ĐżŃ€ĐŸ Đ·Đ°ĐżŃ€ĐŸĐČĐ°ĐŽĐ¶Đ”ĐœĐœŃ ĐœĐ°ĐŽĐ·ĐČочаĐčĐœĐŸĐłĐŸ ŃŃ‚Đ°ĐœŃƒ ĐČ ĐŁĐșŃ€Đ°Ń—ĐœŃ–
ЗаĐșĐŸĐœ ĐżŃ€ĐŸ Đ·Đ°ĐżŃ€ĐŸĐČĐ°ĐŽĐ¶Đ”ĐœĐœŃ ĐœĐ°ĐŽĐ·ĐČочаĐčĐœĐŸĐłĐŸ ŃŃ‚Đ°ĐœŃƒ ĐČ ĐŁĐșŃ€Đ°Ń—ĐœŃ–
 
ĐŸŃ–ĐŽĐŸĐ·Ń€Đ° ĐŸĐ”Ń‚Ń€Ńƒ ĐŸĐŸŃ€ĐŸŃˆĐ”ĐœĐșу
ĐŸŃ–ĐŽĐŸĐ·Ń€Đ° ĐŸĐ”Ń‚Ń€Ńƒ ĐŸĐŸŃ€ĐŸŃˆĐ”ĐœĐșŃƒĐŸŃ–ĐŽĐŸĐ·Ń€Đ° ĐŸĐ”Ń‚Ń€Ńƒ ĐŸĐŸŃ€ĐŸŃˆĐ”ĐœĐșу
ĐŸŃ–ĐŽĐŸĐ·Ń€Đ° ĐŸĐ”Ń‚Ń€Ńƒ ĐŸĐŸŃ€ĐŸŃˆĐ”ĐœĐșу
 
Đ„Đ°Ń€Ń‚Ń–Ń ŃŃ‚Ń€Đ°Ń‚Đ”ĐłŃ–Ń‡ĐœĐŸĐłĐŸ ĐżĐ°Ń€Ń‚ĐœĐ”Ń€ŃŃ‚ĐČĐ° ХКА – ĐŁĐșŃ€Đ°Ń—ĐœĐ°
Đ„Đ°Ń€Ń‚Ń–Ń ŃŃ‚Ń€Đ°Ń‚Đ”ĐłŃ–Ń‡ĐœĐŸĐłĐŸ ĐżĐ°Ń€Ń‚ĐœĐ”Ń€ŃŃ‚ĐČĐ° ХКА – ĐŁĐșŃ€Đ°Ń—ĐœĐ°Đ„Đ°Ń€Ń‚Ń–Ń ŃŃ‚Ń€Đ°Ń‚Đ”ĐłŃ–Ń‡ĐœĐŸĐłĐŸ ĐżĐ°Ń€Ń‚ĐœĐ”Ń€ŃŃ‚ĐČĐ° ХКА – ĐŁĐșŃ€Đ°Ń—ĐœĐ°
Đ„Đ°Ń€Ń‚Ń–Ń ŃŃ‚Ń€Đ°Ń‚Đ”ĐłŃ–Ń‡ĐœĐŸĐłĐŸ ĐżĐ°Ń€Ń‚ĐœĐ”Ń€ŃŃ‚ĐČĐ° ХКА – ĐŁĐșŃ€Đ°Ń—ĐœĐ°
 
Weapons of the war in Ukraine
Weapons of the war in UkraineWeapons of the war in Ukraine
Weapons of the war in Ukraine
 
Лост ĐŽĐŸ ĐżĐ”Ń€ŃˆĐŸĐłĐŸ ĐČŃ–Ń†Đ”ĐżŃ€Đ”ĐŒâ€™Ń”Ń€-ĐŒŃ–ĐœŃ–ŃŃ‚Ń€Đ°, ĐŒŃ–ĐœŃ–ŃŃ‚Ń€Đ° Đ”ĐșĐŸĐœĐŸĐŒŃ–ĐșĐž ОлДĐșсія Đ›ŃŽĐ±Ń‡Đ”ĐœĐșĐ° ĐČіЮ...
Лост ĐŽĐŸ ĐżĐ”Ń€ŃˆĐŸĐłĐŸ ĐČŃ–Ń†Đ”ĐżŃ€Đ”ĐŒâ€™Ń”Ń€-ĐŒŃ–ĐœŃ–ŃŃ‚Ń€Đ°, ĐŒŃ–ĐœŃ–ŃŃ‚Ń€Đ° Đ”ĐșĐŸĐœĐŸĐŒŃ–ĐșĐž ОлДĐșсія Đ›ŃŽĐ±Ń‡Đ”ĐœĐșĐ° ĐČіЮ...Лост ĐŽĐŸ ĐżĐ”Ń€ŃˆĐŸĐłĐŸ ĐČŃ–Ń†Đ”ĐżŃ€Đ”ĐŒâ€™Ń”Ń€-ĐŒŃ–ĐœŃ–ŃŃ‚Ń€Đ°, ĐŒŃ–ĐœŃ–ŃŃ‚Ń€Đ° Đ”ĐșĐŸĐœĐŸĐŒŃ–ĐșĐž ОлДĐșсія Đ›ŃŽĐ±Ń‡Đ”ĐœĐșĐ° ĐČіЮ...
Лост ĐŽĐŸ ĐżĐ”Ń€ŃˆĐŸĐłĐŸ ĐČŃ–Ń†Đ”ĐżŃ€Đ”ĐŒâ€™Ń”Ń€-ĐŒŃ–ĐœŃ–ŃŃ‚Ń€Đ°, ĐŒŃ–ĐœŃ–ŃŃ‚Ń€Đ° Đ”ĐșĐŸĐœĐŸĐŒŃ–ĐșĐž ОлДĐșсія Đ›ŃŽĐ±Ń‡Đ”ĐœĐșĐ° ĐČіЮ...
 
ЗĐČĐ”Ń€ĐœĐ”ĐœĐœŃ Đ’Đ”Ń€Ń…ĐŸĐČĐœĐŸŃ— Đ Đ°ĐŽĐž Ń‰ĐŸĐŽĐŸ ĐżĐŸŃĐžĐ»Đ”ĐœĐœŃ ĐŒŃ–Đ¶ĐœĐ°Ń€ĐŸĐŽĐœĐŸĐłĐŸ спіĐČŃ€ĐŸĐ±Ń–Ń‚ĐœĐžŃ†Ń‚ĐČĐ° ĐČ Ń€Đ°ĐŒĐșах...
ЗĐČĐ”Ń€ĐœĐ”ĐœĐœŃ Đ’Đ”Ń€Ń…ĐŸĐČĐœĐŸŃ— Đ Đ°ĐŽĐž Ń‰ĐŸĐŽĐŸ ĐżĐŸŃĐžĐ»Đ”ĐœĐœŃ ĐŒŃ–Đ¶ĐœĐ°Ń€ĐŸĐŽĐœĐŸĐłĐŸ спіĐČŃ€ĐŸĐ±Ń–Ń‚ĐœĐžŃ†Ń‚ĐČĐ° ĐČ Ń€Đ°ĐŒĐșах...ЗĐČĐ”Ń€ĐœĐ”ĐœĐœŃ Đ’Đ”Ń€Ń…ĐŸĐČĐœĐŸŃ— Đ Đ°ĐŽĐž Ń‰ĐŸĐŽĐŸ ĐżĐŸŃĐžĐ»Đ”ĐœĐœŃ ĐŒŃ–Đ¶ĐœĐ°Ń€ĐŸĐŽĐœĐŸĐłĐŸ спіĐČŃ€ĐŸĐ±Ń–Ń‚ĐœĐžŃ†Ń‚ĐČĐ° ĐČ Ń€Đ°ĐŒĐșах...
ЗĐČĐ”Ń€ĐœĐ”ĐœĐœŃ Đ’Đ”Ń€Ń…ĐŸĐČĐœĐŸŃ— Đ Đ°ĐŽĐž Ń‰ĐŸĐŽĐŸ ĐżĐŸŃĐžĐ»Đ”ĐœĐœŃ ĐŒŃ–Đ¶ĐœĐ°Ń€ĐŸĐŽĐœĐŸĐłĐŸ спіĐČŃ€ĐŸĐ±Ń–Ń‚ĐœĐžŃ†Ń‚ĐČĐ° ĐČ Ń€Đ°ĐŒĐșах...
 
ĐŸĐŸŃŃ‚Đ°ĐœĐŸĐČĐ° Đ’Đ”Ń€Ń…ĐŸĐČĐœĐŸŃ— Đ Đ°ĐŽĐž Ń‰ĐŸĐŽĐŸ ĐšŃ€ĐžĐŒŃƒ
ĐŸĐŸŃŃ‚Đ°ĐœĐŸĐČĐ° Đ’Đ”Ń€Ń…ĐŸĐČĐœĐŸŃ— Đ Đ°ĐŽĐž Ń‰ĐŸĐŽĐŸ ĐšŃ€ĐžĐŒŃƒĐŸĐŸŃŃ‚Đ°ĐœĐŸĐČĐ° Đ’Đ”Ń€Ń…ĐŸĐČĐœĐŸŃ— Đ Đ°ĐŽĐž Ń‰ĐŸĐŽĐŸ ĐšŃ€ĐžĐŒŃƒ
ĐŸĐŸŃŃ‚Đ°ĐœĐŸĐČĐ° Đ’Đ”Ń€Ń…ĐŸĐČĐœĐŸŃ— Đ Đ°ĐŽĐž Ń‰ĐŸĐŽĐŸ ĐšŃ€ĐžĐŒŃƒ
 
ЗаяĐČĐ° 1+1 ĐżŃ€ĐŸ ĐșŃ€ĐžĐŒŃ–ĐœĐ°Đ»ŃŒĐœĐ” праĐČĐŸĐżĐŸŃ€ŃƒŃˆĐ”ĐœĐœŃ
ЗаяĐČĐ° 1+1 ĐżŃ€ĐŸ ĐșŃ€ĐžĐŒŃ–ĐœĐ°Đ»ŃŒĐœĐ” праĐČĐŸĐżĐŸŃ€ŃƒŃˆĐ”ĐœĐœŃĐ—Đ°ŃĐČĐ° 1+1 ĐżŃ€ĐŸ ĐșŃ€ĐžĐŒŃ–ĐœĐ°Đ»ŃŒĐœĐ” праĐČĐŸĐżĐŸŃ€ŃƒŃˆĐ”ĐœĐœŃ
ЗаяĐČĐ° 1+1 ĐżŃ€ĐŸ ĐșŃ€ĐžĐŒŃ–ĐœĐ°Đ»ŃŒĐœĐ” праĐČĐŸĐżĐŸŃ€ŃƒŃˆĐ”ĐœĐœŃ
 
ЛотĐČĐ° ĐŸĐłĐŸĐ»ĐŸŃĐžĐ»Đ° ĐĐœĐ°Ń‚ĐŸĐ»Ń–Ń йарія ĐżĐ”Ń€ŃĐŸĐœĐŸŃŽ ĐœĐŸĐœ Ò‘Ń€Đ°Ń‚Đ°
ЛотĐČĐ° ĐŸĐłĐŸĐ»ĐŸŃĐžĐ»Đ° ĐĐœĐ°Ń‚ĐŸĐ»Ń–Ń йарія ĐżĐ”Ń€ŃĐŸĐœĐŸŃŽ ĐœĐŸĐœ Ò‘Ń€Đ°Ń‚Đ°Đ›ĐžŃ‚ĐČĐ° ĐŸĐłĐŸĐ»ĐŸŃĐžĐ»Đ° ĐĐœĐ°Ń‚ĐŸĐ»Ń–Ń йарія ĐżĐ”Ń€ŃĐŸĐœĐŸŃŽ ĐœĐŸĐœ Ò‘Ń€Đ°Ń‚Đ°
ЛотĐČĐ° ĐŸĐłĐŸĐ»ĐŸŃĐžĐ»Đ° ĐĐœĐ°Ń‚ĐŸĐ»Ń–Ń йарія ĐżĐ”Ń€ŃĐŸĐœĐŸŃŽ ĐœĐŸĐœ Ò‘Ń€Đ°Ń‚Đ°
 
ĐŸĐŸĐČĐœĐžĐč ŃĐżĐžŃĐŸĐș ĐŸĐ±ĐŒĐ”Đ¶Đ”ĐœŃŒ
ĐŸĐŸĐČĐœĐžĐč ŃĐżĐžŃĐŸĐș ĐŸĐ±ĐŒĐ”Đ¶Đ”ĐœŃŒĐŸĐŸĐČĐœĐžĐč ŃĐżĐžŃĐŸĐș ĐŸĐ±ĐŒĐ”Đ¶Đ”ĐœŃŒ
ĐŸĐŸĐČĐœĐžĐč ŃĐżĐžŃĐŸĐș ĐŸĐ±ĐŒĐ”Đ¶Đ”ĐœŃŒ
 
Đ“ĐŸĐ»ĐŸŃŃƒĐČĐ°ĐœĐœŃ Đ·Đ° "харĐșіĐČсьĐșі ŃƒĐłĐŸĐŽĐž" 2010 Ń€ĐŸĐșу
Đ“ĐŸĐ»ĐŸŃŃƒĐČĐ°ĐœĐœŃ Đ·Đ° "харĐșіĐČсьĐșі ŃƒĐłĐŸĐŽĐž" 2010 Ń€ĐŸĐșŃƒĐ“ĐŸĐ»ĐŸŃŃƒĐČĐ°ĐœĐœŃ Đ·Đ° "харĐșіĐČсьĐșі ŃƒĐłĐŸĐŽĐž" 2010 Ń€ĐŸĐșу
Đ“ĐŸĐ»ĐŸŃŃƒĐČĐ°ĐœĐœŃ Đ·Đ° "харĐșіĐČсьĐșі ŃƒĐłĐŸĐŽĐž" 2010 Ń€ĐŸĐșу
 
ЗĐČĐ”Ń€ĐœĐ”ĐœĐœŃ партії "За ĐŒĐ°ĐčĐ±ŃƒŃ‚ĐœŃ”" ĐŽĐŸ Đ’ĐŸĐ»ĐŸĐŽĐžĐŒĐžŃ€Đ° Đ—Đ”Đ»Đ”ĐœŃŃŒĐșĐŸĐłĐŸ
ЗĐČĐ”Ń€ĐœĐ”ĐœĐœŃ партії "За ĐŒĐ°ĐčĐ±ŃƒŃ‚ĐœŃ”" ĐŽĐŸ Đ’ĐŸĐ»ĐŸĐŽĐžĐŒĐžŃ€Đ° Đ—Đ”Đ»Đ”ĐœŃŃŒĐșĐŸĐłĐŸĐ—ĐČĐ”Ń€ĐœĐ”ĐœĐœŃ партії "За ĐŒĐ°ĐčĐ±ŃƒŃ‚ĐœŃ”" ĐŽĐŸ Đ’ĐŸĐ»ĐŸĐŽĐžĐŒĐžŃ€Đ° Đ—Đ”Đ»Đ”ĐœŃŃŒĐșĐŸĐłĐŸ
ЗĐČĐ”Ń€ĐœĐ”ĐœĐœŃ партії "За ĐŒĐ°ĐčĐ±ŃƒŃ‚ĐœŃ”" ĐŽĐŸ Đ’ĐŸĐ»ĐŸĐŽĐžĐŒĐžŃ€Đ° Đ—Đ”Đ»Đ”ĐœŃŃŒĐșĐŸĐłĐŸ
 
ЗĐČĐ”Ń€ĐœĐ”ĐœĐœŃ партії "За ĐŒĐ°ĐčĐ±ŃƒŃ‚ĐœŃ”" ĐŽĐŸ ĐšĐŒĐžĐłĐ°Đ»Ń
ЗĐČĐ”Ń€ĐœĐ”ĐœĐœŃ партії "За ĐŒĐ°ĐčĐ±ŃƒŃ‚ĐœŃ”" ĐŽĐŸ ĐšĐŒĐžĐłĐ°Đ»ŃĐ—ĐČĐ”Ń€ĐœĐ”ĐœĐœŃ партії "За ĐŒĐ°ĐčĐ±ŃƒŃ‚ĐœŃ”" ĐŽĐŸ ĐšĐŒĐžĐłĐ°Đ»Ń
ЗĐČĐ”Ń€ĐœĐ”ĐœĐœŃ партії "За ĐŒĐ°ĐčĐ±ŃƒŃ‚ĐœŃ”" ĐŽĐŸ ĐšĐŒĐžĐłĐ°Đ»Ń
 
ĐŁĐșĐ°Đ· ĐżŃ€Đ”Đ·ĐžĐŽĐ”ĐœŃ‚Đ° ĐŁĐșŃ€Đ°Ń—ĐœĐž №64/2021
ĐŁĐșĐ°Đ· ĐżŃ€Đ”Đ·ĐžĐŽĐ”ĐœŃ‚Đ° ĐŁĐșŃ€Đ°Ń—ĐœĐž №64/2021ĐŁĐșĐ°Đ· ĐżŃ€Đ”Đ·ĐžĐŽĐ”ĐœŃ‚Đ° ĐŁĐșŃ€Đ°Ń—ĐœĐž №64/2021
ĐŁĐșĐ°Đ· ĐżŃ€Đ”Đ·ĐžĐŽĐ”ĐœŃ‚Đ° ĐŁĐșŃ€Đ°Ń—ĐœĐž №64/2021
 
Đ”ĐŸĐŽĐ°Ń‚ĐŸĐș №2 ĐŽĐŸ Ń€Ń–ŃˆĐ”ĐœĐœŃ РНБО ĐżŃ€ĐŸ Đ·Đ°ĐżŃ€ĐŸĐČĐ°ĐŽĐ¶Đ”ĐœĐœŃ ŃĐ°ĐœĐșціĐč ĐżŃ€ĐŸŃ‚Đž ВіĐșŃ‚ĐŸŃ€Đ° ĐœĐ”ĐŽĐČĐ”ĐŽŃ‡ŃƒĐșĐ°...
Đ”ĐŸĐŽĐ°Ń‚ĐŸĐș №2 ĐŽĐŸ Ń€Ń–ŃˆĐ”ĐœĐœŃ РНБО ĐżŃ€ĐŸ Đ·Đ°ĐżŃ€ĐŸĐČĐ°ĐŽĐ¶Đ”ĐœĐœŃ ŃĐ°ĐœĐșціĐč ĐżŃ€ĐŸŃ‚Đž ВіĐșŃ‚ĐŸŃ€Đ° ĐœĐ”ĐŽĐČĐ”ĐŽŃ‡ŃƒĐșĐ°...Đ”ĐŸĐŽĐ°Ń‚ĐŸĐș №2 ĐŽĐŸ Ń€Ń–ŃˆĐ”ĐœĐœŃ РНБО ĐżŃ€ĐŸ Đ·Đ°ĐżŃ€ĐŸĐČĐ°ĐŽĐ¶Đ”ĐœĐœŃ ŃĐ°ĐœĐșціĐč ĐżŃ€ĐŸŃ‚Đž ВіĐșŃ‚ĐŸŃ€Đ° ĐœĐ”ĐŽĐČĐ”ĐŽŃ‡ŃƒĐșĐ°...
Đ”ĐŸĐŽĐ°Ń‚ĐŸĐș №2 ĐŽĐŸ Ń€Ń–ŃˆĐ”ĐœĐœŃ РНБО ĐżŃ€ĐŸ Đ·Đ°ĐżŃ€ĐŸĐČĐ°ĐŽĐ¶Đ”ĐœĐœŃ ŃĐ°ĐœĐșціĐč ĐżŃ€ĐŸŃ‚Đž ВіĐșŃ‚ĐŸŃ€Đ° ĐœĐ”ĐŽĐČĐ”ĐŽŃ‡ŃƒĐșĐ°...
 
Đ”ĐŸĐŽĐ°Ń‚ĐŸĐș №1 ĐŽĐŸ Ń€Ń–ŃˆĐ”ĐœĐœŃ РНБО ĐżŃ€ĐŸ Đ·Đ°ĐżŃ€ĐŸĐČĐ°ĐŽĐ¶Đ”ĐœĐœŃ ŃĐ°ĐœĐșціĐč ĐżŃ€ĐŸŃ‚Đž ВіĐșŃ‚ĐŸŃ€Đ° ĐœĐ”ĐŽĐČĐ”ĐŽŃ‡ŃƒĐșĐ°...
Đ”ĐŸĐŽĐ°Ń‚ĐŸĐș №1 ĐŽĐŸ Ń€Ń–ŃˆĐ”ĐœĐœŃ РНБО ĐżŃ€ĐŸ Đ·Đ°ĐżŃ€ĐŸĐČĐ°ĐŽĐ¶Đ”ĐœĐœŃ ŃĐ°ĐœĐșціĐč ĐżŃ€ĐŸŃ‚Đž ВіĐșŃ‚ĐŸŃ€Đ° ĐœĐ”ĐŽĐČĐ”ĐŽŃ‡ŃƒĐșĐ°...Đ”ĐŸĐŽĐ°Ń‚ĐŸĐș №1 ĐŽĐŸ Ń€Ń–ŃˆĐ”ĐœĐœŃ РНБО ĐżŃ€ĐŸ Đ·Đ°ĐżŃ€ĐŸĐČĐ°ĐŽĐ¶Đ”ĐœĐœŃ ŃĐ°ĐœĐșціĐč ĐżŃ€ĐŸŃ‚Đž ВіĐșŃ‚ĐŸŃ€Đ° ĐœĐ”ĐŽĐČĐ”ĐŽŃ‡ŃƒĐșĐ°...
Đ”ĐŸĐŽĐ°Ń‚ĐŸĐș №1 ĐŽĐŸ Ń€Ń–ŃˆĐ”ĐœĐœŃ РНБО ĐżŃ€ĐŸ Đ·Đ°ĐżŃ€ĐŸĐČĐ°ĐŽĐ¶Đ”ĐœĐœŃ ŃĐ°ĐœĐșціĐč ĐżŃ€ĐŸŃ‚Đž ВіĐșŃ‚ĐŸŃ€Đ° ĐœĐ”ĐŽĐČĐ”ĐŽŃ‡ŃƒĐșĐ°...
 

Recently uploaded

declarationleaders_sd_re_greens_theleft_5.pdf
declarationleaders_sd_re_greens_theleft_5.pdfdeclarationleaders_sd_re_greens_theleft_5.pdf
declarationleaders_sd_re_greens_theleft_5.pdfssuser5750e1
 
call girls inMahavir Nagar (delhi) call me [🔝9953056974🔝] escort service 24X7
call girls inMahavir Nagar  (delhi) call me [🔝9953056974🔝] escort service 24X7call girls inMahavir Nagar  (delhi) call me [🔝9953056974🔝] escort service 24X7
call girls inMahavir Nagar (delhi) call me [🔝9953056974🔝] escort service 24X79953056974 Low Rate Call Girls In Saket, Delhi NCR
 
China's soft power in 21st century .pptx
China's soft power in 21st century   .pptxChina's soft power in 21st century   .pptx
China's soft power in 21st century .pptxYasinAhmad20
 
The political system of the united kingdom
The political system of the united kingdomThe political system of the united kingdom
The political system of the united kingdomlunadelior
 
06052024_First India Newspaper Jaipur.pdf
06052024_First India Newspaper Jaipur.pdf06052024_First India Newspaper Jaipur.pdf
06052024_First India Newspaper Jaipur.pdfFIRST INDIA
 
04052024_First India Newspaper Jaipur.pdf
04052024_First India Newspaper Jaipur.pdf04052024_First India Newspaper Jaipur.pdf
04052024_First India Newspaper Jaipur.pdfFIRST INDIA
 
KING VISHNU BHAGWANON KA BHAGWAN PARAMATMONKA PARATOMIC PARAMANU KASARVAMANVA...
KING VISHNU BHAGWANON KA BHAGWAN PARAMATMONKA PARATOMIC PARAMANU KASARVAMANVA...KING VISHNU BHAGWANON KA BHAGWAN PARAMATMONKA PARATOMIC PARAMANU KASARVAMANVA...
KING VISHNU BHAGWANON KA BHAGWAN PARAMATMONKA PARATOMIC PARAMANU KASARVAMANVA...IT Industry
 
*Navigating Electoral Terrain: TDP's Performance under N Chandrababu Naidu's ...
*Navigating Electoral Terrain: TDP's Performance under N Chandrababu Naidu's ...*Navigating Electoral Terrain: TDP's Performance under N Chandrababu Naidu's ...
*Navigating Electoral Terrain: TDP's Performance under N Chandrababu Naidu's ...anjanibaddipudi1
 
10052024_First India Newspaper Jaipur.pdf
10052024_First India Newspaper Jaipur.pdf10052024_First India Newspaper Jaipur.pdf
10052024_First India Newspaper Jaipur.pdfFIRST INDIA
 
Transformative Leadership: N Chandrababu Naidu and TDP's Vision for Innovatio...
Transformative Leadership: N Chandrababu Naidu and TDP's Vision for Innovatio...Transformative Leadership: N Chandrababu Naidu and TDP's Vision for Innovatio...
Transformative Leadership: N Chandrababu Naidu and TDP's Vision for Innovatio...srinuseo15
 
Dubai Call Girls Pinky O525547819 Call Girl's In Dubai
Dubai Call Girls Pinky O525547819 Call Girl's In DubaiDubai Call Girls Pinky O525547819 Call Girl's In Dubai
Dubai Call Girls Pinky O525547819 Call Girl's In Dubaikojalkojal131
 
Unveiling the Characteristics of Political Institutions_ A Comprehensive Anal...
Unveiling the Characteristics of Political Institutions_ A Comprehensive Anal...Unveiling the Characteristics of Political Institutions_ A Comprehensive Anal...
Unveiling the Characteristics of Political Institutions_ A Comprehensive Anal...tewhimanshu23
 
422524114-Patriarchy-Kamla-Bhasin gg.pdf
422524114-Patriarchy-Kamla-Bhasin gg.pdf422524114-Patriarchy-Kamla-Bhasin gg.pdf
422524114-Patriarchy-Kamla-Bhasin gg.pdflambardar420420
 
America Is the Target; Israel Is the Front Line _ Andy Blumenthal _ The Blogs...
America Is the Target; Israel Is the Front Line _ Andy Blumenthal _ The Blogs...America Is the Target; Israel Is the Front Line _ Andy Blumenthal _ The Blogs...
America Is the Target; Israel Is the Front Line _ Andy Blumenthal _ The Blogs...Andy (Avraham) Blumenthal
 
{Qatar{^🚀^(+971558539980**}})Abortion Pills for Sale in Dubai. .abu dhabi, sh...
{Qatar{^🚀^(+971558539980**}})Abortion Pills for Sale in Dubai. .abu dhabi, sh...{Qatar{^🚀^(+971558539980**}})Abortion Pills for Sale in Dubai. .abu dhabi, sh...
{Qatar{^🚀^(+971558539980**}})Abortion Pills for Sale in Dubai. .abu dhabi, sh...hyt3577
 
Job-OriДntДd Courses That Will Boost Your Career in 2024
Job-OriДntДd Courses That Will Boost Your Career in 2024Job-OriДntДd Courses That Will Boost Your Career in 2024
Job-OriДntДd Courses That Will Boost Your Career in 2024Insiger
 
Politician uddhav thackeray biography- Full Details
Politician uddhav thackeray biography- Full DetailsPolitician uddhav thackeray biography- Full Details
Politician uddhav thackeray biography- Full DetailsVoterMood
 
THE OBSTACLES THAT IMPEDE THE DEVELOPMENT OF BRAZIL IN THE CONTEMPORARY ERA A...
THE OBSTACLES THAT IMPEDE THE DEVELOPMENT OF BRAZIL IN THE CONTEMPORARY ERA A...THE OBSTACLES THAT IMPEDE THE DEVELOPMENT OF BRAZIL IN THE CONTEMPORARY ERA A...
THE OBSTACLES THAT IMPEDE THE DEVELOPMENT OF BRAZIL IN THE CONTEMPORARY ERA A...Faga1939
 
05052024_First India Newspaper Jaipur.pdf
05052024_First India Newspaper Jaipur.pdf05052024_First India Newspaper Jaipur.pdf
05052024_First India Newspaper Jaipur.pdfFIRST INDIA
 

Recently uploaded (20)

declarationleaders_sd_re_greens_theleft_5.pdf
declarationleaders_sd_re_greens_theleft_5.pdfdeclarationleaders_sd_re_greens_theleft_5.pdf
declarationleaders_sd_re_greens_theleft_5.pdf
 
call girls inMahavir Nagar (delhi) call me [🔝9953056974🔝] escort service 24X7
call girls inMahavir Nagar  (delhi) call me [🔝9953056974🔝] escort service 24X7call girls inMahavir Nagar  (delhi) call me [🔝9953056974🔝] escort service 24X7
call girls inMahavir Nagar (delhi) call me [🔝9953056974🔝] escort service 24X7
 
China's soft power in 21st century .pptx
China's soft power in 21st century   .pptxChina's soft power in 21st century   .pptx
China's soft power in 21st century .pptx
 
9953056974 Call Girls In Pratap Nagar, Escorts (Delhi) NCR
9953056974 Call Girls In Pratap Nagar, Escorts (Delhi) NCR9953056974 Call Girls In Pratap Nagar, Escorts (Delhi) NCR
9953056974 Call Girls In Pratap Nagar, Escorts (Delhi) NCR
 
The political system of the united kingdom
The political system of the united kingdomThe political system of the united kingdom
The political system of the united kingdom
 
06052024_First India Newspaper Jaipur.pdf
06052024_First India Newspaper Jaipur.pdf06052024_First India Newspaper Jaipur.pdf
06052024_First India Newspaper Jaipur.pdf
 
04052024_First India Newspaper Jaipur.pdf
04052024_First India Newspaper Jaipur.pdf04052024_First India Newspaper Jaipur.pdf
04052024_First India Newspaper Jaipur.pdf
 
KING VISHNU BHAGWANON KA BHAGWAN PARAMATMONKA PARATOMIC PARAMANU KASARVAMANVA...
KING VISHNU BHAGWANON KA BHAGWAN PARAMATMONKA PARATOMIC PARAMANU KASARVAMANVA...KING VISHNU BHAGWANON KA BHAGWAN PARAMATMONKA PARATOMIC PARAMANU KASARVAMANVA...
KING VISHNU BHAGWANON KA BHAGWAN PARAMATMONKA PARATOMIC PARAMANU KASARVAMANVA...
 
*Navigating Electoral Terrain: TDP's Performance under N Chandrababu Naidu's ...
*Navigating Electoral Terrain: TDP's Performance under N Chandrababu Naidu's ...*Navigating Electoral Terrain: TDP's Performance under N Chandrababu Naidu's ...
*Navigating Electoral Terrain: TDP's Performance under N Chandrababu Naidu's ...
 
10052024_First India Newspaper Jaipur.pdf
10052024_First India Newspaper Jaipur.pdf10052024_First India Newspaper Jaipur.pdf
10052024_First India Newspaper Jaipur.pdf
 
Transformative Leadership: N Chandrababu Naidu and TDP's Vision for Innovatio...
Transformative Leadership: N Chandrababu Naidu and TDP's Vision for Innovatio...Transformative Leadership: N Chandrababu Naidu and TDP's Vision for Innovatio...
Transformative Leadership: N Chandrababu Naidu and TDP's Vision for Innovatio...
 
Dubai Call Girls Pinky O525547819 Call Girl's In Dubai
Dubai Call Girls Pinky O525547819 Call Girl's In DubaiDubai Call Girls Pinky O525547819 Call Girl's In Dubai
Dubai Call Girls Pinky O525547819 Call Girl's In Dubai
 
Unveiling the Characteristics of Political Institutions_ A Comprehensive Anal...
Unveiling the Characteristics of Political Institutions_ A Comprehensive Anal...Unveiling the Characteristics of Political Institutions_ A Comprehensive Anal...
Unveiling the Characteristics of Political Institutions_ A Comprehensive Anal...
 
422524114-Patriarchy-Kamla-Bhasin gg.pdf
422524114-Patriarchy-Kamla-Bhasin gg.pdf422524114-Patriarchy-Kamla-Bhasin gg.pdf
422524114-Patriarchy-Kamla-Bhasin gg.pdf
 
America Is the Target; Israel Is the Front Line _ Andy Blumenthal _ The Blogs...
America Is the Target; Israel Is the Front Line _ Andy Blumenthal _ The Blogs...America Is the Target; Israel Is the Front Line _ Andy Blumenthal _ The Blogs...
America Is the Target; Israel Is the Front Line _ Andy Blumenthal _ The Blogs...
 
{Qatar{^🚀^(+971558539980**}})Abortion Pills for Sale in Dubai. .abu dhabi, sh...
{Qatar{^🚀^(+971558539980**}})Abortion Pills for Sale in Dubai. .abu dhabi, sh...{Qatar{^🚀^(+971558539980**}})Abortion Pills for Sale in Dubai. .abu dhabi, sh...
{Qatar{^🚀^(+971558539980**}})Abortion Pills for Sale in Dubai. .abu dhabi, sh...
 
Job-OriДntДd Courses That Will Boost Your Career in 2024
Job-OriДntДd Courses That Will Boost Your Career in 2024Job-OriДntДd Courses That Will Boost Your Career in 2024
Job-OriДntДd Courses That Will Boost Your Career in 2024
 
Politician uddhav thackeray biography- Full Details
Politician uddhav thackeray biography- Full DetailsPolitician uddhav thackeray biography- Full Details
Politician uddhav thackeray biography- Full Details
 
THE OBSTACLES THAT IMPEDE THE DEVELOPMENT OF BRAZIL IN THE CONTEMPORARY ERA A...
THE OBSTACLES THAT IMPEDE THE DEVELOPMENT OF BRAZIL IN THE CONTEMPORARY ERA A...THE OBSTACLES THAT IMPEDE THE DEVELOPMENT OF BRAZIL IN THE CONTEMPORARY ERA A...
THE OBSTACLES THAT IMPEDE THE DEVELOPMENT OF BRAZIL IN THE CONTEMPORARY ERA A...
 
05052024_First India Newspaper Jaipur.pdf
05052024_First India Newspaper Jaipur.pdf05052024_First India Newspaper Jaipur.pdf
05052024_First India Newspaper Jaipur.pdf
 

The global liveability_Index_2018

  • 1. A report by The Economist Intelligence Unit The Global Liveability Index 2018 A free overview
  • 2. The world leader in global business intelligence The Economist Intelligence Unit (The EIU) is the research and analysis division of The Economist Group, the sister company to The Economist newspaper. Created in 1946, we have over 70 years’ experience in helping businesses, financial firms and governments to understand how the world is changing and how that creates opportunities to be seized and risks to be managed. Given that many of the issues facing the world have an international (if not global) dimension, The EIU is ideally positioned to be commentator, interpreter and forecaster on the phenomenon of globalisation as it gathers pace and impact. EIU subscription services The world’s leading organisations rely on our subscription services for data, analysis and forecasts to keep them informed about what is happening around the world. We specialise in: ‱ Country Analysis: Access to regular, detailed country-specific economic and political forecasts, as well as assessments of the business and regulatory environments in different markets. ‱ Risk Analysis: Our risk services identify actual and potential threats around the world and help our clients understand the implications for their organisations. ‱ Industry Analysis: Five year forecasts, analysis of key themes and news analysis for six key industries in 60 major economies. These forecasts are based on the latest data and in-depth analysis of industry trends. EIU Consulting EIU Consulting is a bespoke service designed to provide solutions specific to our customers’ needs. We specialise in these key sectors: ‱ EIU Consumer: We help consumer-facing companies to enter new markets as well as deliver greater success in current markets. We work globally, supporting senior management with strategic initiatives, MA due diligence, demand forecasting and other issues of fundamental importance to their corporations. Find out more at eiu.com/consumer ‱ Healthcare: Together with our two specialised consultancies, Bazian and Clearstate, The EIU helps healthcare organisations build and maintain successful and sustainable businesses across the healthcare ecosystem. Find out more at: eiu.com/ healthcare ‱ Public Policy: Trusted by the sector’s most influential stakeholders, our global public policy practice provides evidence- based research for policy-makers and stakeholders seeking clear and measurable outcomes. Find out more at: eiu.com/ publicpolicy The Economist Corporate Network The Economist Corporate Network (ECN) is The Economist Group’s advisory service for organisational leaders seeking to better understand the economic and business environments of global markets. Delivering independent, thought-provoking content, ECN provides clients with the knowledge, insight, and interaction that support better-informed strategies and decisions. The Network is part of The Economist Intelligence Unit and is led by experts with in-depth understanding of the geographies and markets they oversee. The Network’s membership-based operations cover Asia-Pacific, the Middle East, and Africa. Through a distinctive blend of interactive conferences, specially designed events, C-suite discussions, member briefings, and high-calibre research, The Economist Corporate Network delivers a range of macro (global, regional, national, and territorial) as well as industry-focused analysis on prevailing conditions and forecast trends.
  • 3. THE GLOBAL LIVEABILITY INDEX 2018 A FREE OVERVIEW © The Economist Intelligence Unit Limited 20181 The findings of the latest liveability survey 2 After years of destabilisation, a return to relative global stability 2 Civil war and terrorism in the worst performing cities have been globally destabilising 5 The top and bottom ten cities 5 About The Economist Intelligence Unit’s liveability survey 7 How the rating works 7 The suggested liveability scale 7 How the rating is calculated 7 Contents
  • 4. THE GLOBAL LIVEABILITY INDEX 2018 A FREE OVERVIEW © The Economist Intelligence Unit Limited 20182 The findings of the latest liveability survey After years of destabilisation, a return to relative global stability For the first time in this survey’s history, Austria’s capital, Vienna, ranks as the most liveable of the 140 cities surveyed by The Economist Intelligence Unit. A long-running contender to the title, Vienna has succeeded in displacing Melbourne from the top spot, ending a record seven consecutive years at the head of the survey for the Australian city. Although both Melbourne and Vienna have registered improvements in liveability over the last six months, increases in Vienna’s ratings, particularly in the stability category, have been enough for the city to overtake Melbourne. The two cities are now separated by 0.7 of a percentage point, with Vienna scoring a near-ideal 99.1 out of 100 and Melbourne scoring 98.4. Two other Australian cities feature in the top-ranked places: Sydney (5th) and Adelaide (10th), while only one other European city made the top ten. This is Copenhagen in Denmark, in 9th place, after its score increased by 3.3 percentage points since the last survey cycle. The rest of the top-ranked cities are split between Japan (Osaka in 3rd place and Tokyo in joint 7th, alongside Toronto) and Canada (Calgary in 4th, and Vancouver and Toronto in 6th and 7th respectively). Osaka stands out especially, having climbed six positions, to third place, over the past six months, closing the gap with Melbourne. It is now separated from the former top-ranked city by a mere 0.7 of a percentage point. Osaka’s improvements in scores for quality and availability of public transportation, as well as a consistent decline in crime rates, have contributed to higher ratings in the infrastructure and stability categories respectively. Upwards movement in the top ranked cities is a reflection of improvements seen in stability and safety across most regions in the past year. Whereas in the past, cities in Europe have been affected by the spreading perceived threat of terrorism in the region, which caused heightened security measures, the past six months have seen a return to normalcy. Yet, during this period, 116 cities of the 140 surveyed have experienced changes in their ranking position. This rises to 128 cities when looking at changes over the past year. It must be noted that ranking movements do not necessarily arise from a change in liveability in the cities themselves, but reflect how cities compare with one another. Although four cities have fallen from the top ten over the past year—Auckland (from 8th to 12th), Perth (from 7th to 14th), Helsinki (from 9th to 16th) and Hamburg (from 10th to 18th)—none of these have seen a fall in their overall scores during this period. New Zealand’s Auckland has in fact registered a minor improvement. Changes in liveability elsewhere can therefore have a significant impact on the rankings of individual cities. Of the 140 surveyed cities, 49% registered negative changes in their overall liveability rank in the past six months and 34% experienced positive movements (the rest did not record any change). Yet, despite the total number of negative movements outweighing the positive ones, the rankings show that overall liveability across all cities surveyed increased by 0.7% in the past six months and 0.9% in the past year. Improvements were recorded across all five categories measured—infrastructure, stability, education, healthcare, and culture and environment—but especially in stability, which increased by 2.5% overall.
  • 5. THE GLOBAL LIVEABILITY INDEX 2018 A FREE OVERVIEW © The Economist Intelligence Unit Limited 20183 This trend reflects positive developments in this category, despite threats of terrorism and unrest that cities around the world continue to grapple with. Only ten cities have registered a decline in their liveability ratings over the past six months, largely reflecting an impact on cultural and environmental indicators. The prolonged period of relative stability has resulted in the stabilisation of terrorism threat scores in several cities, especially in Western Europe. The only cities that have seen a fall in their stability indicators over the past six months are Abu Dhabi (71st) and Dubai (69th) in the United Arab Emirates (UAE), Colombo (130th) in Sri Lanka and Warsaw (65th) in Poland. In Abu Dhabi and Dubai, the threat of military conflict has increased owing to the UAE’s recent interventions extending its military reach in Yemen and Somalia. The UAE’s deployment of armed forces in Yemen, as well as political hostility with Iran, continue to pose a threat in the country and the region. Sri Lanka’s declaration of a temporary nationwide state of emergency in March, following clashes between Sinhalese Buddhist and Tamil Muslim communities, impacted Colombo’s civil unrest score. The threat of civil unrest also increased in Warsaw as an estimated 60,000 people joined a nationalist march on the occasion of Poland’s Independence Day in November 2017. Nevertheless, these changes have caused a decline in the overall stability rating only in Colombo’s case. Warsaw, for instance, has experienced a decline in the threat of terrorism to counteract the fall in the civil unrest score, while Abu Dhabi and Dubai saw improvements in their crime and civil unrest ratings. The impact of improving stability is most apparent when a five-year view of the global average scores is taken. Overall, the global average liveability score has increased by 0.15%, to 75.7%, over the past five years, while the average stability rating has increased by 1.3%. Although the threat of terrorism has indeed caused a decline in liveability over a longer period—the global average liveability score has decreased by 0.4% in the past decade—an improvement in scores over the past five years suggests a gradual return to relative stability. During this period, 103 of the 140 cities surveyed have seen some change in overall liveability scores. Of these, 60 have seen improvements in liveability. Four cities in particular—Abidjan in CĂŽte d’Ivoire, Hanoi in Vietnam, Belgrade in Serbia and Tehran in Iran—have seen increases of 5 percentage points or more. Over the past twelve months Kiev has also seen a significant improvement in liveability, reflecting a pick-up in economic growth and relative political stability despite the Donbas conflict. Although the cities ranked among the most liveable in the world remain largely unchanged, there has been pronounced movement within the top tier of liveability. Of the 66 cities with scores of 80 or more, which are considered as the top tier, 40 have seen a change in score in the past twelve months. Changes in overall scores have been positive for all cities except Houston, which saw a decline in its infrastructure rating. An improvement in stability has been the underlying factor affecting movements in the most liveable cities, with the top tier registering an overall increase of 3.4% in its average stability score. Of the top-ranked cities, Paris in France and Manchester in the UK recorded the biggest improvements over the past 12 months, both in overall scores and stability ratings. Although they have been subject to high-profile terrorist attacks in recent years, which have shaken stability and led to cumbersome security measures, both cities have shown resilience in the face of adversity. Nevertheless, with such high scores already in place, the impact of these improvements has not been enough to significantly affect liveability in any of the top-tier cities. In fact although, 19 percentage points separate Vienna in first place from NoumĂ©a in New Caledonia in 66th place, all cities in this tier can lay claim to being on an equal footing in terms of presenting few, if any, challenges to residents’ lifestyles.
  • 6. THE GLOBAL LIVEABILITY INDEX 2018 A FREE OVERVIEW © The Economist Intelligence Unit Limited 20184 Nonetheless, there does appear to be a correlation between the types of cities that sit at the very top of the ranking. Those that score best tend to be mid-sized cities in wealthier countries. Several cities in the top ten also have relatively low population density. These can foster a range of recreational activities without leading to high crime levels or overburdened infrastructure. Six of the top ten scoring cities are in Australia and Canada, which have, respectively, population densities of 3.2 and 4 people per square kilometre. These densities compare with a global (land) average of 58 and a US average of 35.6, according to the latest World Bank statistics, from 2017. Austria and Japan buck this trend, with respective densities of 106.7 and 347.8 people per square kilometre. However, Vienna’s city-proper population of 1.9m and Osaka’s population of 2.7m are relatively small compared with metropolises such as New York, London and Paris. It may be argued that violent crime is on an upward trend in the top tier of cities, but these observations are not always correct. Although crime rates are perceived as rising in Australia and Europe, cities in these regions continue to boast lower violent and petty crime rates than the rest of the world. Some of the lowest murder rates in the world were recorded in Austria and Japan. The murder rate in Austria was just 0.61 per 100,000 people in 2017, and in Japan it was 0.72 per 100,000 people. This compares with a murder rate of 3 per 100,000 people in New Delhi in 2016 and an estimated homicide rate of 104 per 100,000 people in Caracas—according to the Venezuelan Observatory of Violence—in 2017. Global business centres tend to be victims of their own success. The “big city buzz” that they enjoy can overstretch infrastructure and cause higher crime rates. New York (57th), London (48th) and Paris (19th) are all prestigious hubs with a wealth of recreational activities, but all suffer from higher levels of crime, congestion and public transport problems than are deemed comfortable. The question is how much wages, the cost of living and personal taste for a location can offset liveability factors. Although many global centres fare less well in the ranking than mid-sized cities, for example, they still sit within the highest tier of liveability and should therefore be considered broadly comparable, especially when contrasted with the worst-scoring locations. Five biggest improvers (last five years) City Country Rank (out of 140) Overall Rating (100=ideal) five year movement % Abidjan Cote d’Ivoire 124 52.2 6.3 Hanoi Vietnam 107 59.7 5.5 Belgrade Serbia 82 72.2 5 Tehran Iran 128 50.8 5 Ho Chi Minh City Vietnam 116 57.1 4.4 Five biggest decliners (last five years) City Country Rank (out of 140) Overall Rating (100=ideal) five year movement % Kiev Ukraine 118 56.6 -12.6 San Juan Puerto Rico 89 69.8 -8.9 Damascus Syria 140 30.7 -7.7 Caracas Venezuela 126 51.3 -5.1 Asuncion Paraguay 102 64.3 -4.5
  • 7. THE GLOBAL LIVEABILITY INDEX 2018 A FREE OVERVIEW © The Economist Intelligence Unit Limited 20185 Civil war and terrorism in the worst performing cities have been globally destabilising Of the poorer-scoring cities, eleven occupy the very bottom tier of liveability, where ratings fall below 50% and most aspects of living are severely restricted. Damascus has seen a stabilisation in its dramatic decline in liveability but remains ranked at the bottom of the 140 cities surveyed, with a liveability score that is 7.3% lower than the second lowest ranking city in the survey, Dhaka in Bangladesh. The relatively small number of cities in the bottom tier of liveability partly reflects the intended scope of the ranking—the survey is designed to address a range of cities or business centres that people might want to live in or visit. For example, the survey does not include locations such as Kabul in Afghanistan or Baghdad in Iraq. Although few would argue that Damascus in Syria and Tripoli in Libya are likely to attract visitors at present, despite them registering recent improvements, their inclusion in the survey reflects cities that were deemed relatively stable before the 2011 Arab Spring. With the exception of crisis-hit cities, the low number of cities in the bottom tier also reflects a degree of convergence, where levels of liveability are generally expected to improve in developing economies over time. This long-term trend has been upset by the heightened, widespread reach of terrorism over the past five years. The rankings of cities like Damascus, Karachi and Tripoli suggest that conflict is responsible for many of the lowest scores. This is not only because stability indicators have the highest single scores but also because factors defining stability can spread to have an adverse effect on other categories. For example, conflict will not just cause disruption in its own right, it will also damage infrastructure, overburden hospitals and undermine the availability of goods, services and recreational activities. Unavailability of adequate infrastructure is also responsible for many of the lowest scores. This is particularly visible in the ranks of cities like Dhaka (Bangladesh, 139th), Harare (Zimbabwe, 135th), Douala (Cameroon, 133rd) and Dakar (Senegal, 131st). Nevertheless, the impact of stability indicators, especially those related to crime, cannot be understated for some of these cities. The Middle East, Africa and Asia account for the ten lowest-scoring cities in the survey where violence, whether through crime, civil insurgency, terrorism or war, has played a strong role. The top and bottom ten cities Below is a ranking of the top and bottom cities surveyed, accompanied by the liveability rating for every city. The liveability score is the combination of all the factors surveyed across the five main categories. Scores are also given for each category. The full ranking report can be purchased at store.eiu.com/product/global-liveability-survey/
  • 8. THE GLOBAL LIVEABILITY INDEX 2018 A FREE OVERVIEW © The Economist Intelligence Unit Limited 20186 The ten most liveable cities Country City Rank Overall Rating (100=ideal) Stability Healthcare Culture Environment Education Infrastructure Austria Vienna 1 99.1 100.0 100.0 96.3 100.0 100.0 Australia Melbourne 2 98.4 95.0 100.0 98.6 100.0 100.0 Japan Osaka 3 97.7 100.0 100.0 93.5 100.0 96.4 Canada Calgary 4 97.5 100.0 100.0 90.0 100.0 100.0 Australia Sydney 5 97.4 95.0 100.0 94.4 100.0 100.0 Canada Vancouver 6 97.3 95.0 100.0 100.0 100.0 92.9 Canada Toronto 7 97.2 100.0 100.0 97.2 100.0 89.3 Japan Tokyo 7 97.2 100.0 100.0 94.4 100.0 92.9 Denmark Copenhagen 9 96.8 95.0 95.8 95.4 100.0 100.0 Australia Adelaide 10 96.6 95.0 100.0 94.2 100.0 96.4 The ten least liveable cities Country City Rank Overall Rating (100=ideal) Stability Healthcare Culture Environment Education Infrastructure Senegal Dakar 131 48.3 50.0 41.7 59.7 50.0 37.5 Algeria Algiers 132 44.1 50.0 45.8 45.4 50.0 30.4 Cameroon Douala 133 44.0 60.0 25.0 48.4 33.3 42.9 Libya Tripoli 134 42.9 45.0 41.7 40.3 50.0 41.1 Zimbabwe Harare 135 42.6 40.0 20.8 58.6 66.7 35.7 PNG Port Moresby 136 41.0 30.0 37.5 47.0 50.0 46.4 Pakistan Karachi 137 40.9 20.0 45.8 38.7 66.7 51.8 Nigeria Lagos 138 38.5 20.0 37.5 53.5 33.3 46.4 Bangladesh Dhaka 139 38.0 50.0 29.2 40.5 41.7 26.8 Syria Damascus 140 30.7 20.0 29.2 40.5 33.3 32.1
  • 9. THE GLOBAL LIVEABILITY INDEX 2018 A FREE OVERVIEW © The Economist Intelligence Unit Limited 20187 How the rating works The concept of liveability is simple: it assesses which locations around the world provide the best or the worst living conditions. Assessing liveability has a broad range of uses, from benchmarking perceptions of development levels to assigning a hardship allowance as part of expatriate relocation packages. The Economist Intelligence Unit’s liveability rating quantifies the challenges that might be presented to an individual’s lifestyle in any given location, and allows for direct comparison between locations. Every city is assigned a rating of relative comfort for over 30 qualitative and quantitative factors across five broad categories: stability, healthcare, culture and environment, education, and infrastructure. Each factor in a city is rated as acceptable, tolerable, uncomfortable, undesirable or intolerable. For quali­tative indicators, a rating is awarded based on the judgment of in-house analysts and in-city contributors. For quantitative indicators, a rating is calcul­ated based on the relative performance of a number of external data points. The scores are then compiled and weighted to provide a score of 1–100, where 1 is considered intolerable and 100 is considered ideal. The liveability rating is provided both as an overall score and as a score for each category. To provide points of reference, the score is also given for each category relative to New York and an overall position in the ranking of 140 cities is provided. The suggested liveability scale Companies pay a premium (usually a percentage of a salary) to employees who move to cities where living conditions are particularly difficult and there is excessive physical hardship or a notably unhealthy environment. We have given a suggested allowance to correspond with the rating. However, the actual level of the allowance is often a matter of company policy. It is not uncommon, for example, for companies to pay higher allowances—perhaps up to double our suggested level. How the rating is calculated The liveability score is reached through category weights, which are equally divided into relevant subcategories to ensure that the score covers as many indicators as possible. Indicators are scored as acceptable, tolerable, uncomfortable, undesirable or intolerable. These are then weighted to produce a rating, where 100 means that liveability in a city is ideal and 1 means that it is intolerable. About The Economist Intelligence Unit’s liveability survey Rating Description Suggested allowance (%) 80-100 There are few, if any, challenges to living standards 0 70-80 Day–to–day living is fine, in general, but some aspects of life may entail problems 5 60-70 Negative factors have an impact on day-to-day living 10 50-60 Liveability is substantially constrained 15 50 or less Most aspects of living are severely restricted 20
  • 10. THE GLOBAL LIVEABILITY INDEX 2018 A FREE OVERVIEW © The Economist Intelligence Unit Limited 20188 Category 1: Stability (weight: 25% of total) Indicator Source Prevalence of petty crime EIU rating Prevalence of violent crime EIU rating Threat of terror EIU rating Threat of military conflict EIU rating Threat of civil unrest/conflict EIU rating For qualitative variables, an “EIU rating” is awarded based on the judgment of in‑house expert country analysts and a field correspondent based in each city. For quantitative variables, a rating is calculated based on the relative performance of a location using external data sources. Category 4: Education (weight: 10% of total) Indicator Source Availability of private education EIU rating Quality of private education EIU rating Public education indicators Adapted from World Bank Category 3: Culture Environment (weight: 25% of total) Indicator Source Humidity/temperature rating Adapted from average weather conditions Discomfort of climate to travellers EIU rating Level of corruption Adapted from Transparency International Social or religious restrictions EIU rating Level of censorship EIU rating Sporting availability EIU field rating of 3 sport indicators Cultural availability EIU field rating of 4 cultural indicators Food drink EIU field rating of 4 cultural indicators Consumer goods services EIU rating of product availability Category 2: Healthcare (weight: 20% of total) Indicator Source Availability of private healthcare EIU rating Quality of private healthcare EIU rating Availability of public healthcare EIU rating Quality of public healthcare EIU rating Availability of over-the-counter drugs EIU rating General healthcare indicators Adapted from World Bank
  • 11. THE GLOBAL LIVEABILITY INDEX 2018 A FREE OVERVIEW © The Economist Intelligence Unit Limited 20189 Category 5: Infrastructure (weight: 20% of total) Indicator Source Quality of road network EIU rating Quality of public transport EIU rating Quality of international links EIU rating Availability of good quality housing EIU rating Quality of energy provision EIU rating Quality of water provision EIU rating Quality of telecommunications EIU rating
  • 12. © The Economist Intelligence Unit Limited 201810 TheLiveabilitySurvey LiveabilitySurveyprovidesafullreportofTheEIU’sliveabilityratingsfor140citiesaroundtheworld.This includesaone-pageoverviewforeachofthe140citiescoveredaswellasTheEIU’sratingsforeach city on thefullsetofover30qualitativeandquantitativefactors.Inthisranking: ‱Eachofthe30factorsineachcityisratedasacceptable,tolerable,uncomfortable,undesirable or intolerable. ‱Thecategoriesarecompiledandweightedtoprovideanoverallratingof1–100,where1isconsidered intolerableand100isconsideredideal. ‱Theliveabilityrankingconsidersthatanycitywitharatingof80ormorewillhavefew,ifany, challengestolivingstandards.Anycitywithascoreoflessthan50willseemostaspectsofliving severelyrestricted. PurchasetheLiveabilitySurvey. LiveabilityRankingandOverview ThisreportprovidesacompleteoverviewofTheEIU’sliveabilityratingsfor140citiesaroundthe world. Thisincludes: ‱Asummaryoffindingsandadescriptionofthemethodologyused. ‱Tableslistingtherankingposition,overallliveabilityscoreandaveragescoresforallcitiesacross each ofthefivecategories:stability,healthcare,cultureandenvironment,educationandinfrastructure. PurchasetheLiveabilityRankingandOverview. LiveabilityMatrix TheLiveabilityMatrixisaninteractiveExcelworkbookthatranksall140citiesonover30qualitative and quantitativefactorsacrossthefivecategories. PurchasetheLiveabilityMatrix. Related Reports WorldwideCostofLiving TheWorldwideCostofLivingSurveycontainsarankingof133citiesontheirrelativeexpensiveness,based onasurveywhichcomparesmorethan400individualpricesacross160productsandservices.In addition totherankingtable,thereportlooksatthekeytrendsaffectingthecostoflivingindifferentcities across theworld. Findoutmoreat:eiu.com/wcol Liveability products available to purchase from The EIU
  • 13. Cover image - © Mistervlad/Shutterstock Copyright © 2018 The Economist Intelligence Unit Limited. All rights reserved. Neither this publication nor any part of it may be reproduced, stored in a retrieval system, or transmitted in any form or by any means, electronic, mechanical, photocopying, recording or otherwise, without the prior permission of The Economist Intelligence Unit Limited. While every effort has been taken to verify the accuracy of this information, The Economist Intelligence Unit Ltd. cannot accept any responsibility or liability for reliance by any person on this report or any of the information, opinions or conclusions set out in this report.
  • 14. LONDON 20 Cabot Square London E14 4QW United Kingdom Tel: +44 (0) 20 7576 8181 Email: london@eiu.com NEW YORK 750 Third Avenue 5th Floor New York, NY 10017 United States Tel: + 1 212 698 9717 Email: americas@eiu.com HONG KONG 1301 Cityplaza Four 12 Taikoo Wan Road Taikoo Shing Hong Kong Tel: + 852 2802 7288 Email: asia@eiu.com