Download to read offline

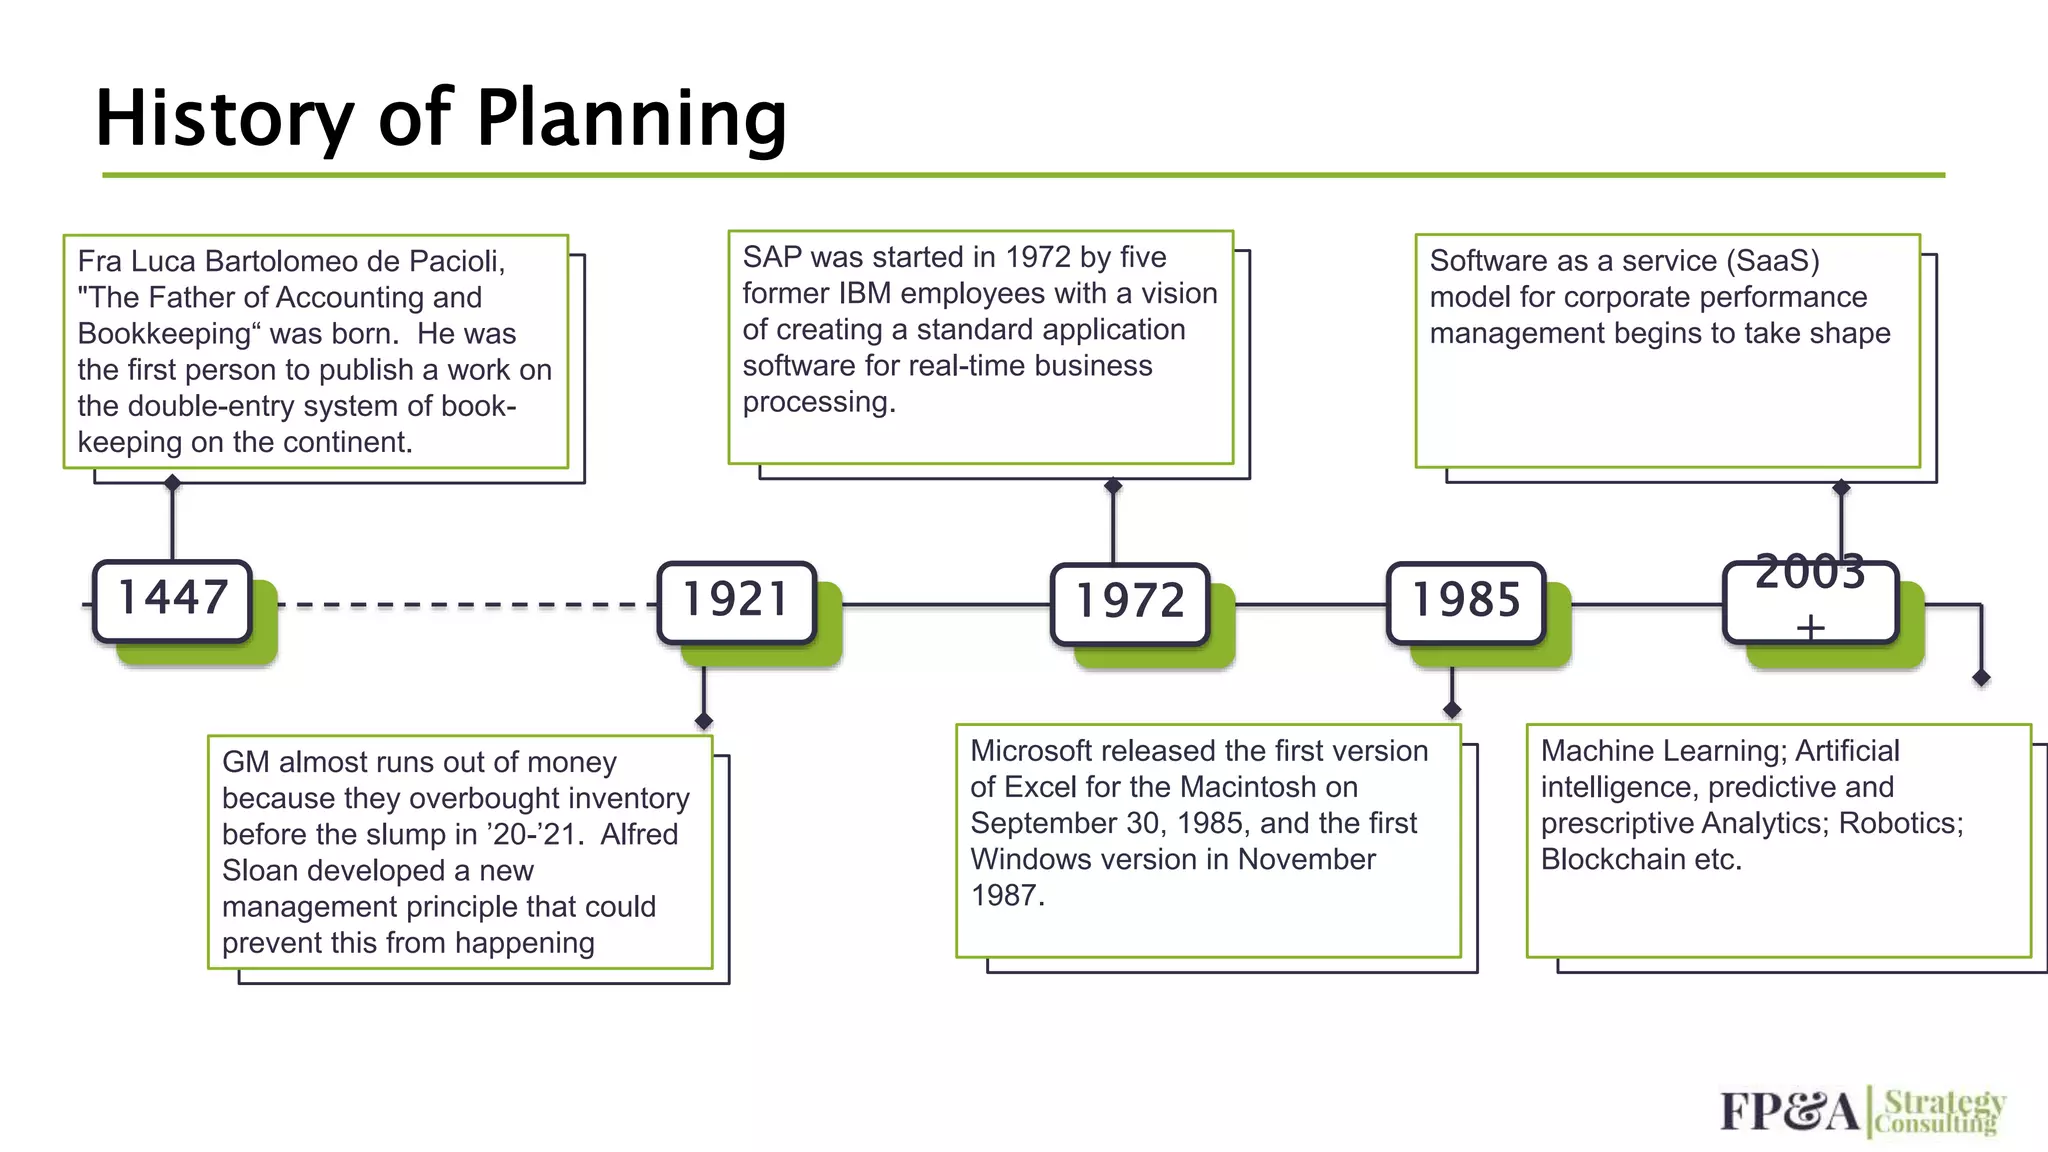
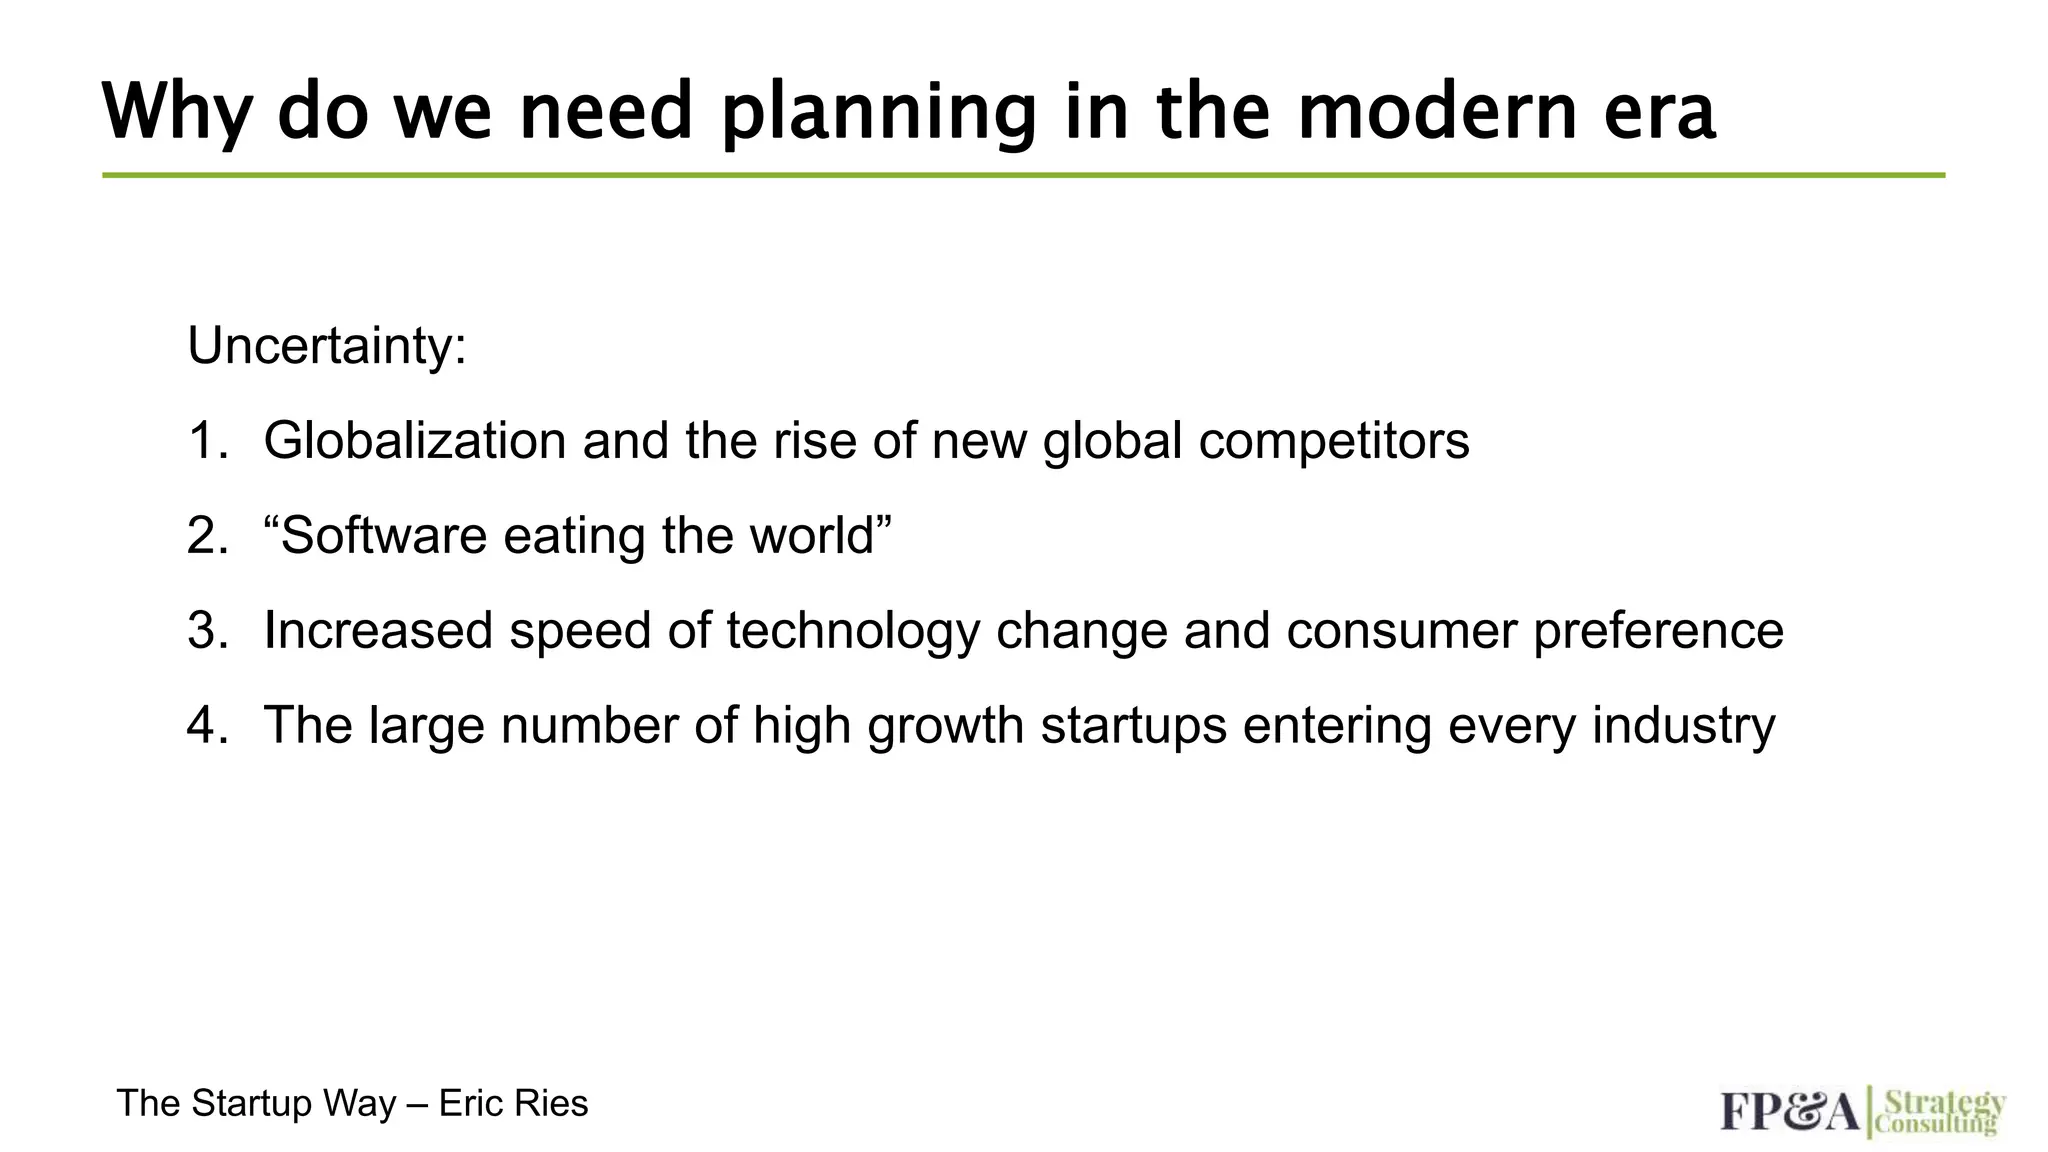
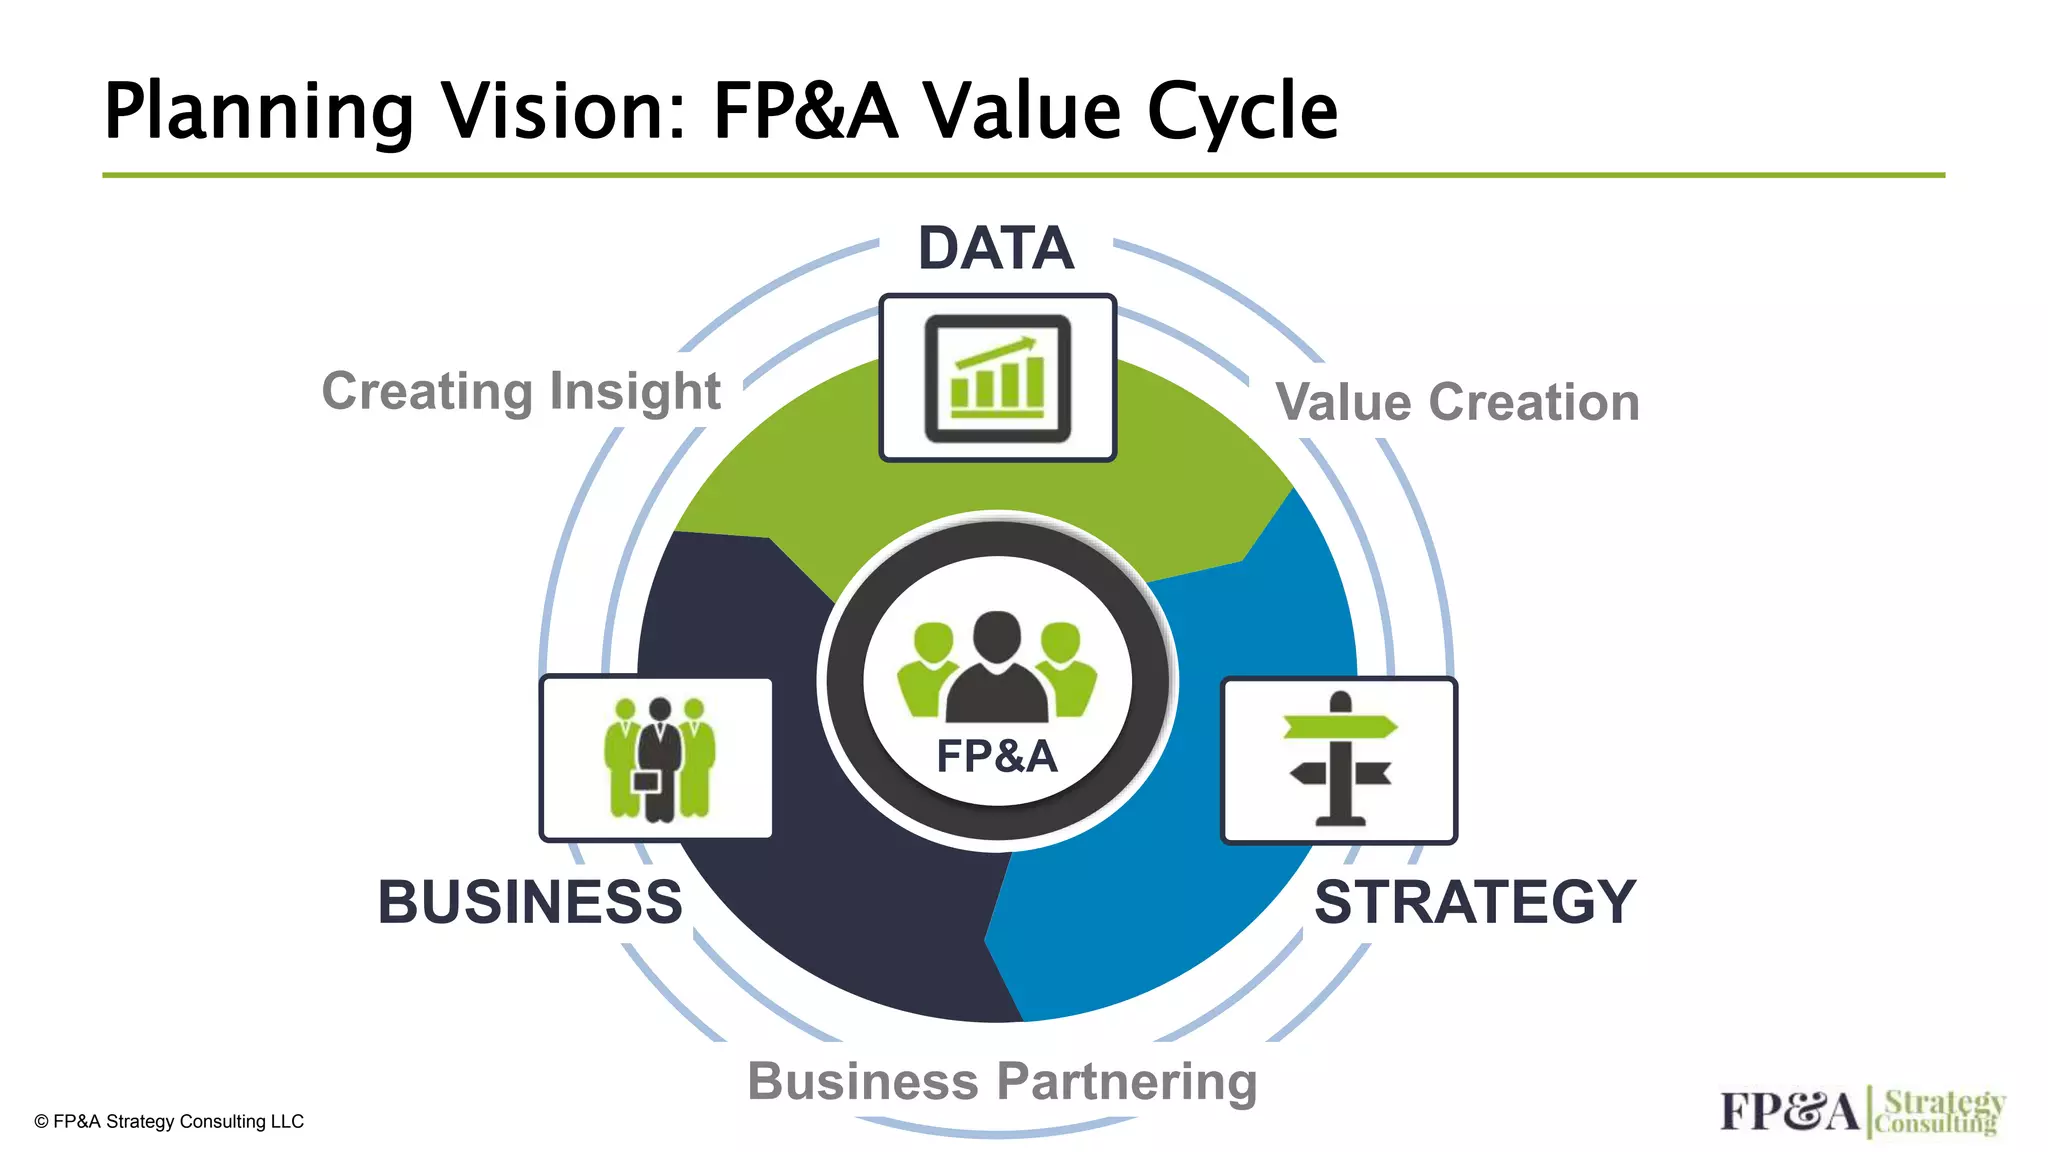


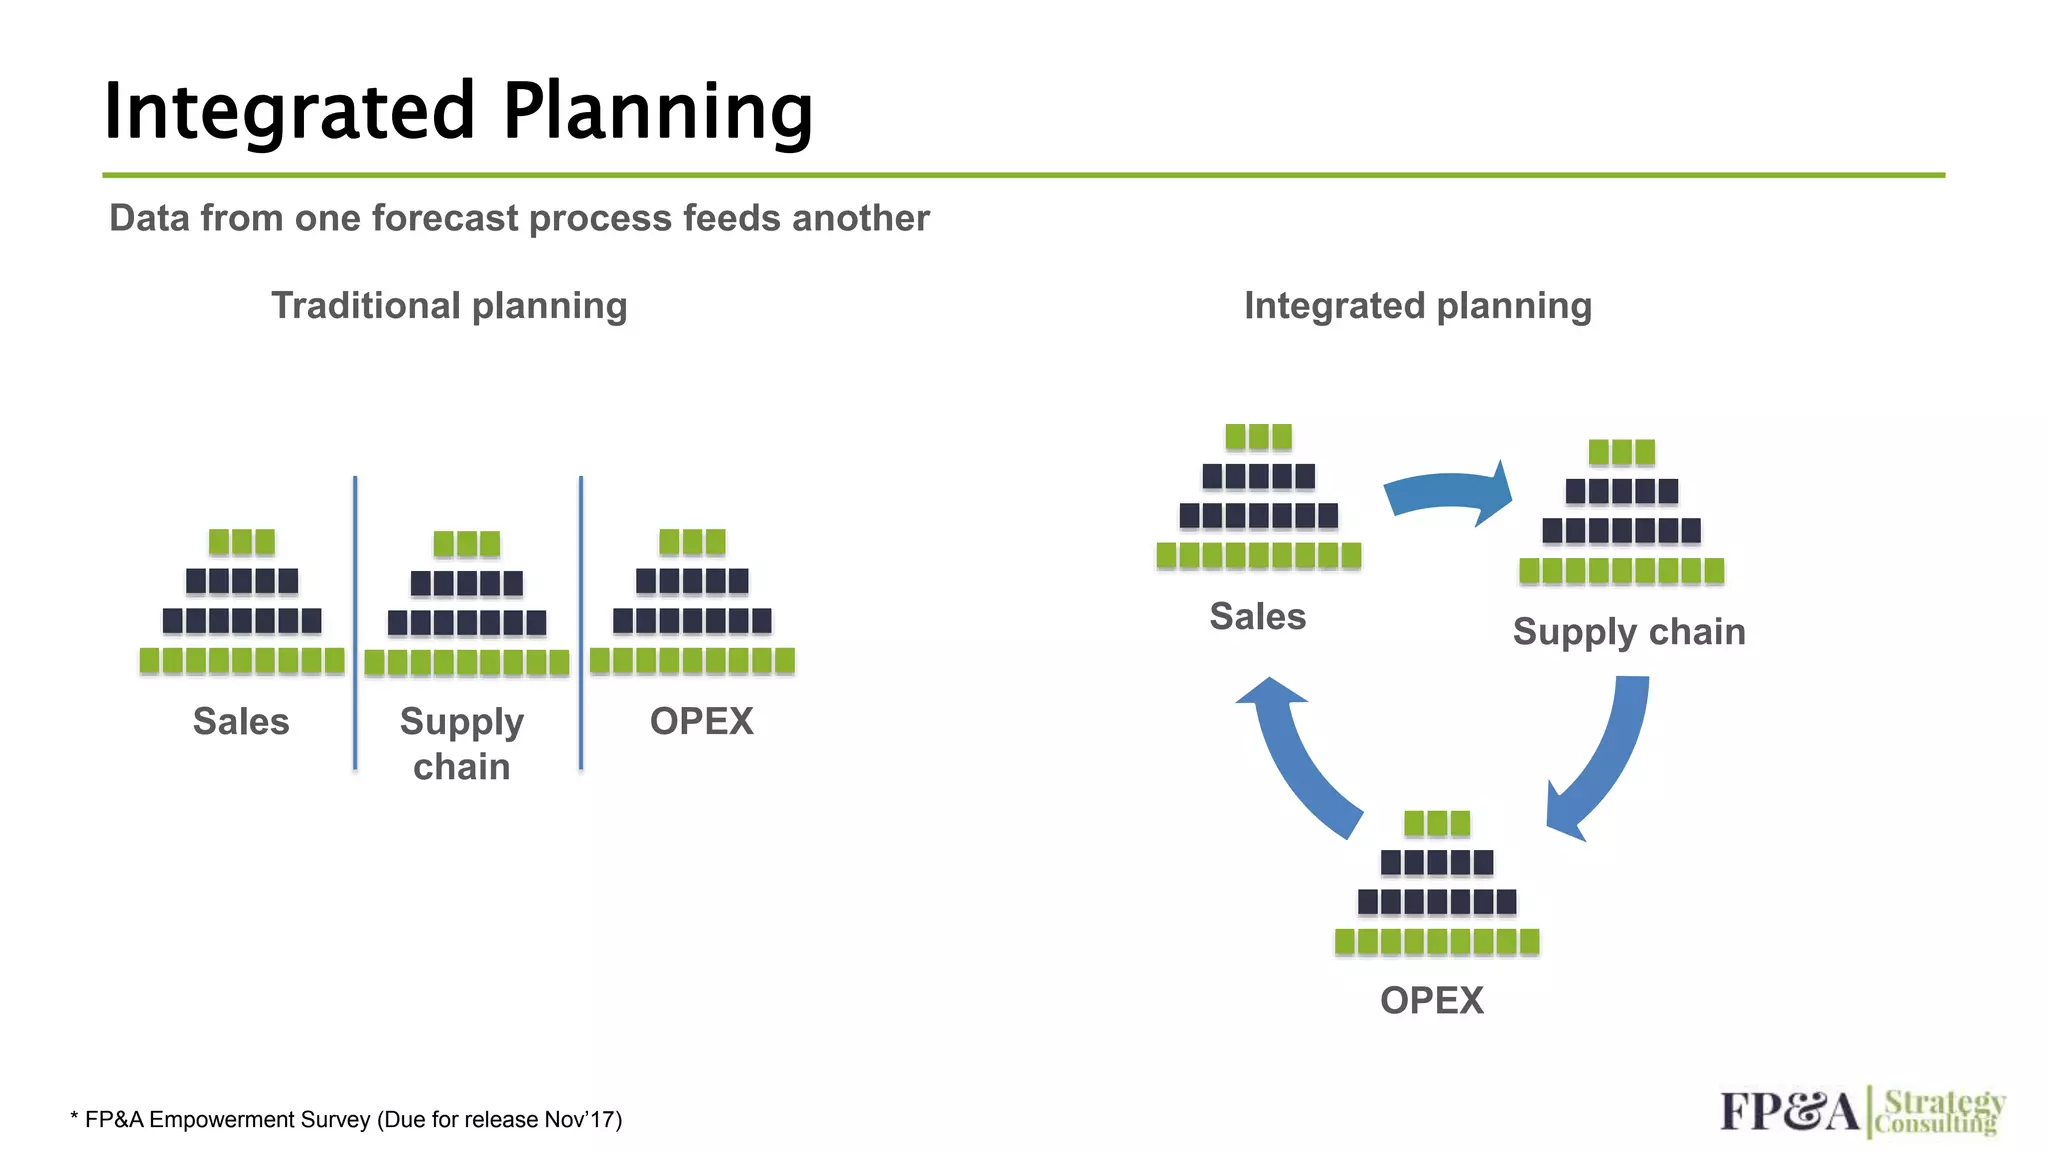


The document outlines the evolution of forecasting and budgeting practices in corporate finance, emphasizing the shift towards integrated planning and the use of advanced technologies such as AI and machine learning. It highlights the need for organizations to adapt to modern challenges driven by globalization, technological changes, and the rise of new competitors. Additionally, it discusses the limitations of traditional methods like spreadsheets and advocates for more efficient, real-time data processing solutions.


![[Product Launch] Jedox 7 - What's New](https://cdn.slidesharecdn.com/ss_thumbnails/jedox7whatsnewslideshare-170320095656-thumbnail.jpg?width=640&height=640&fit=bounds)


