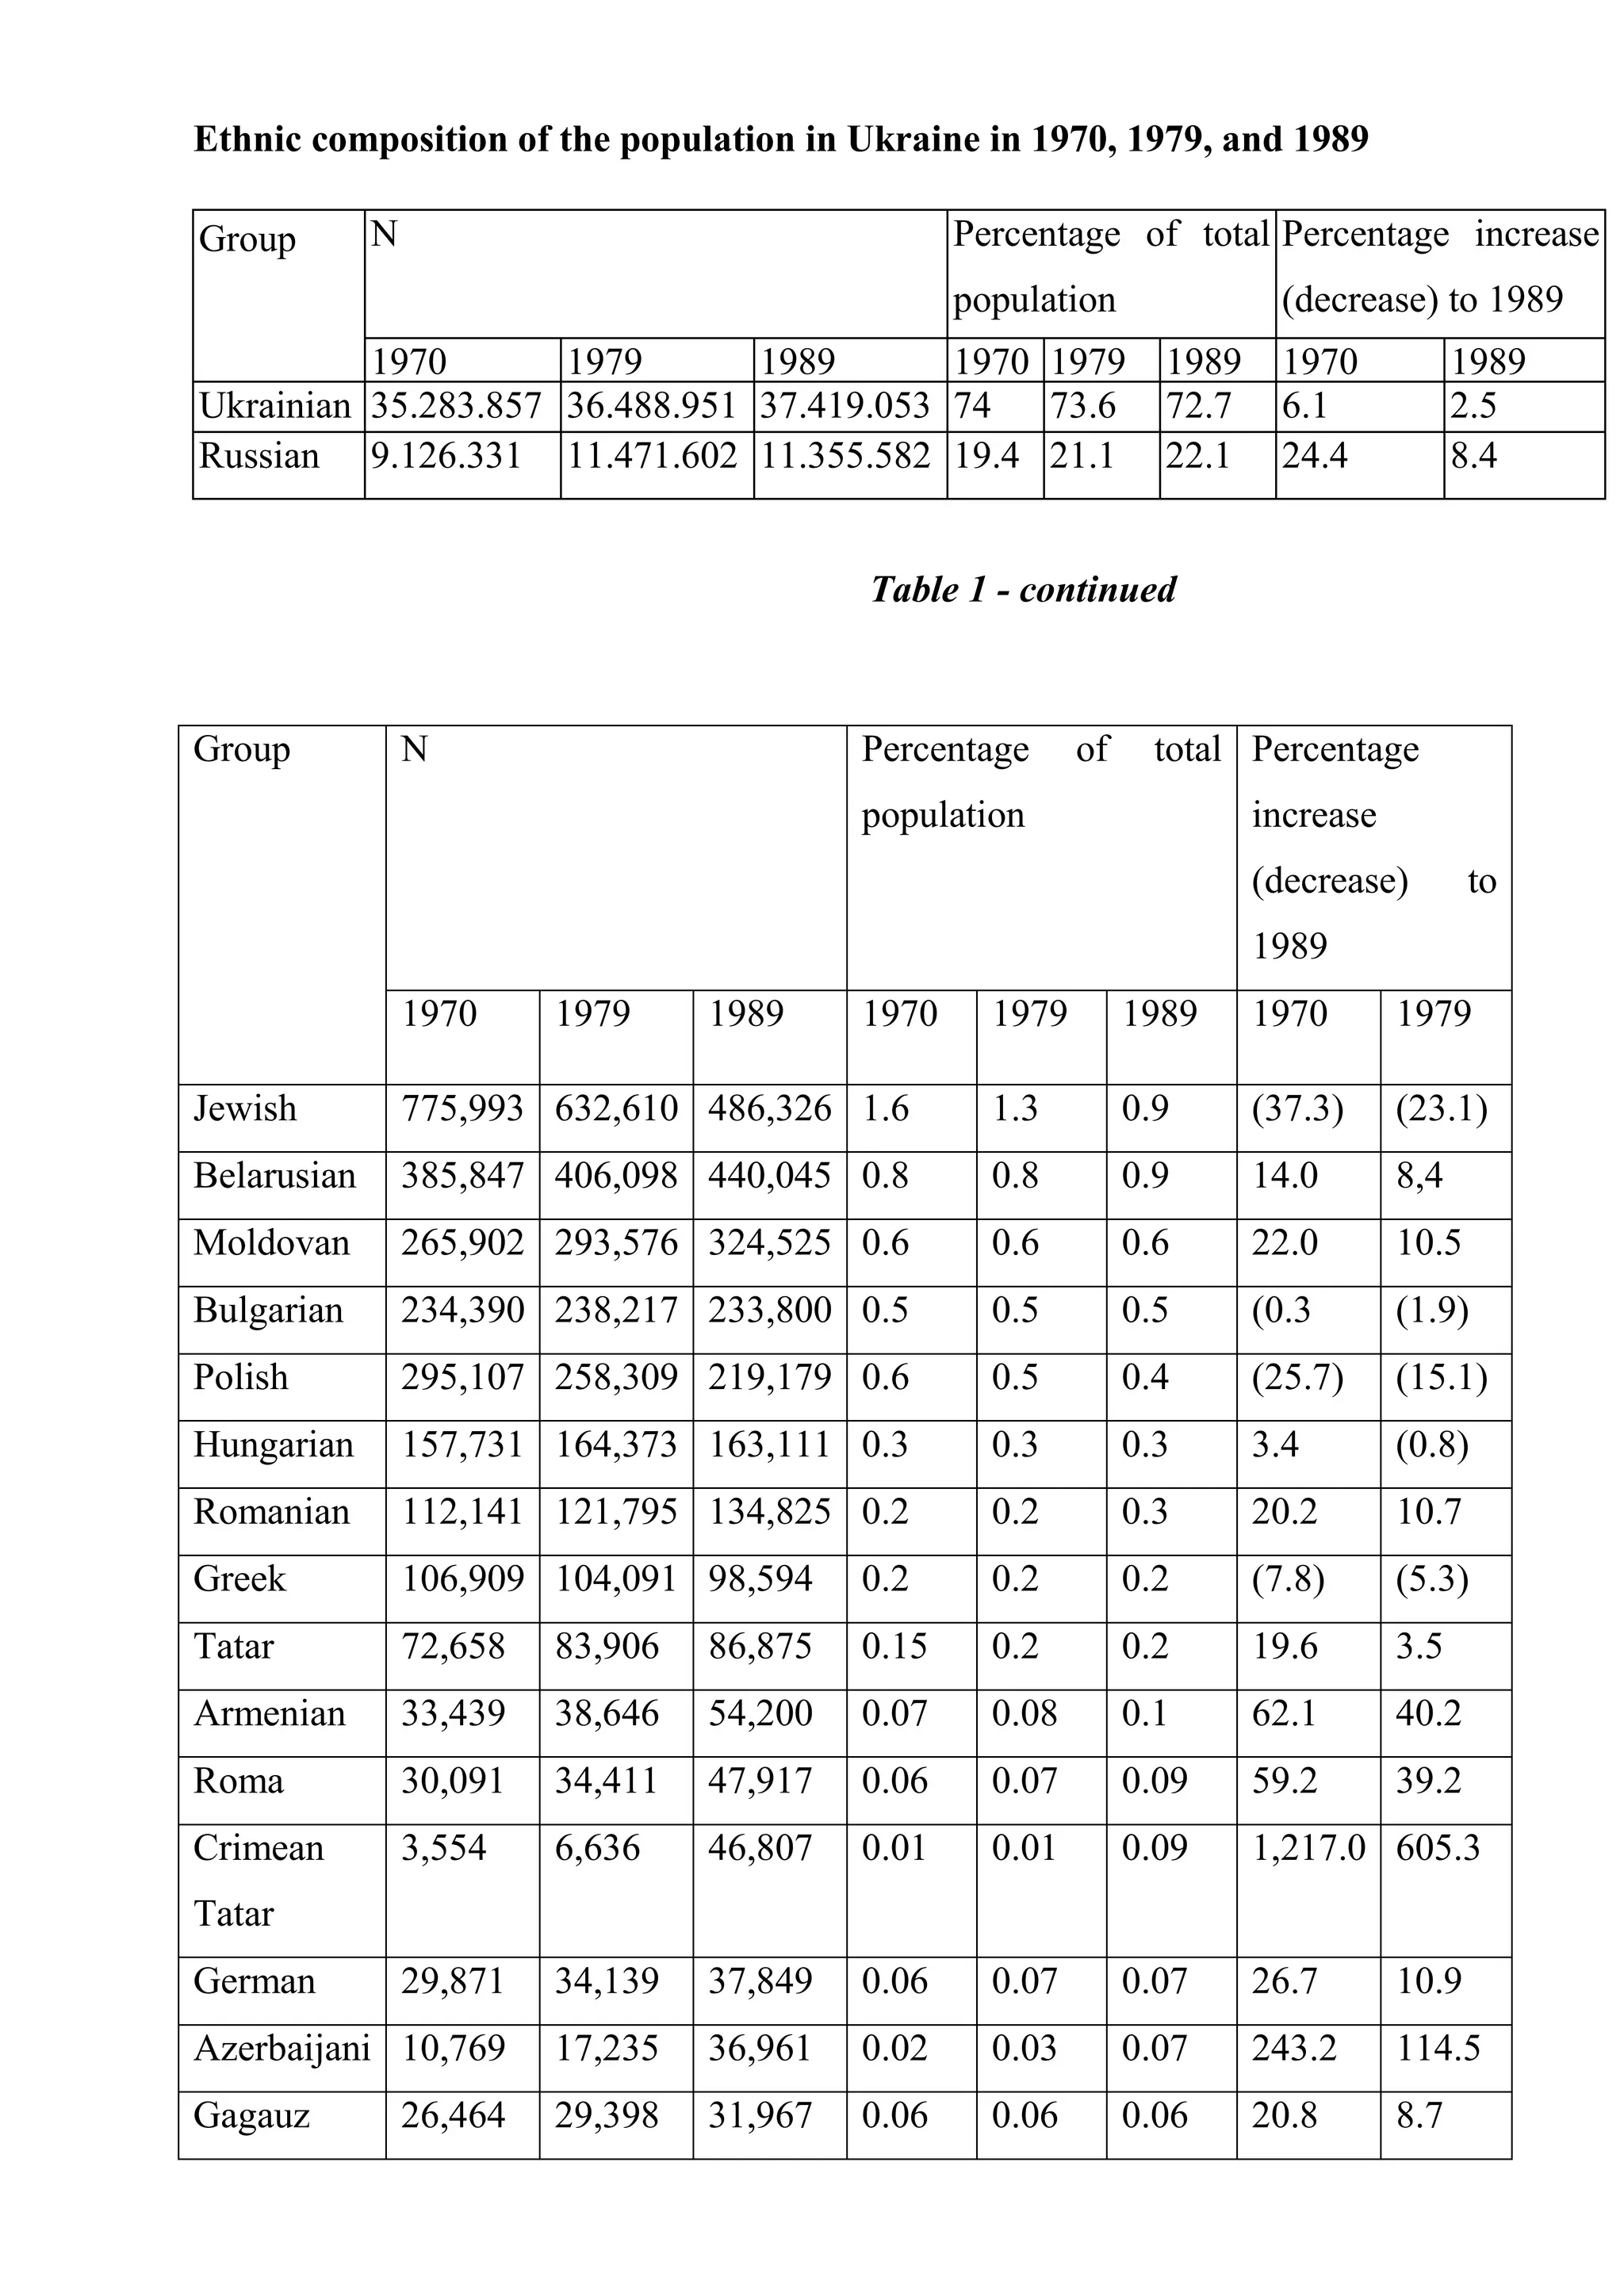
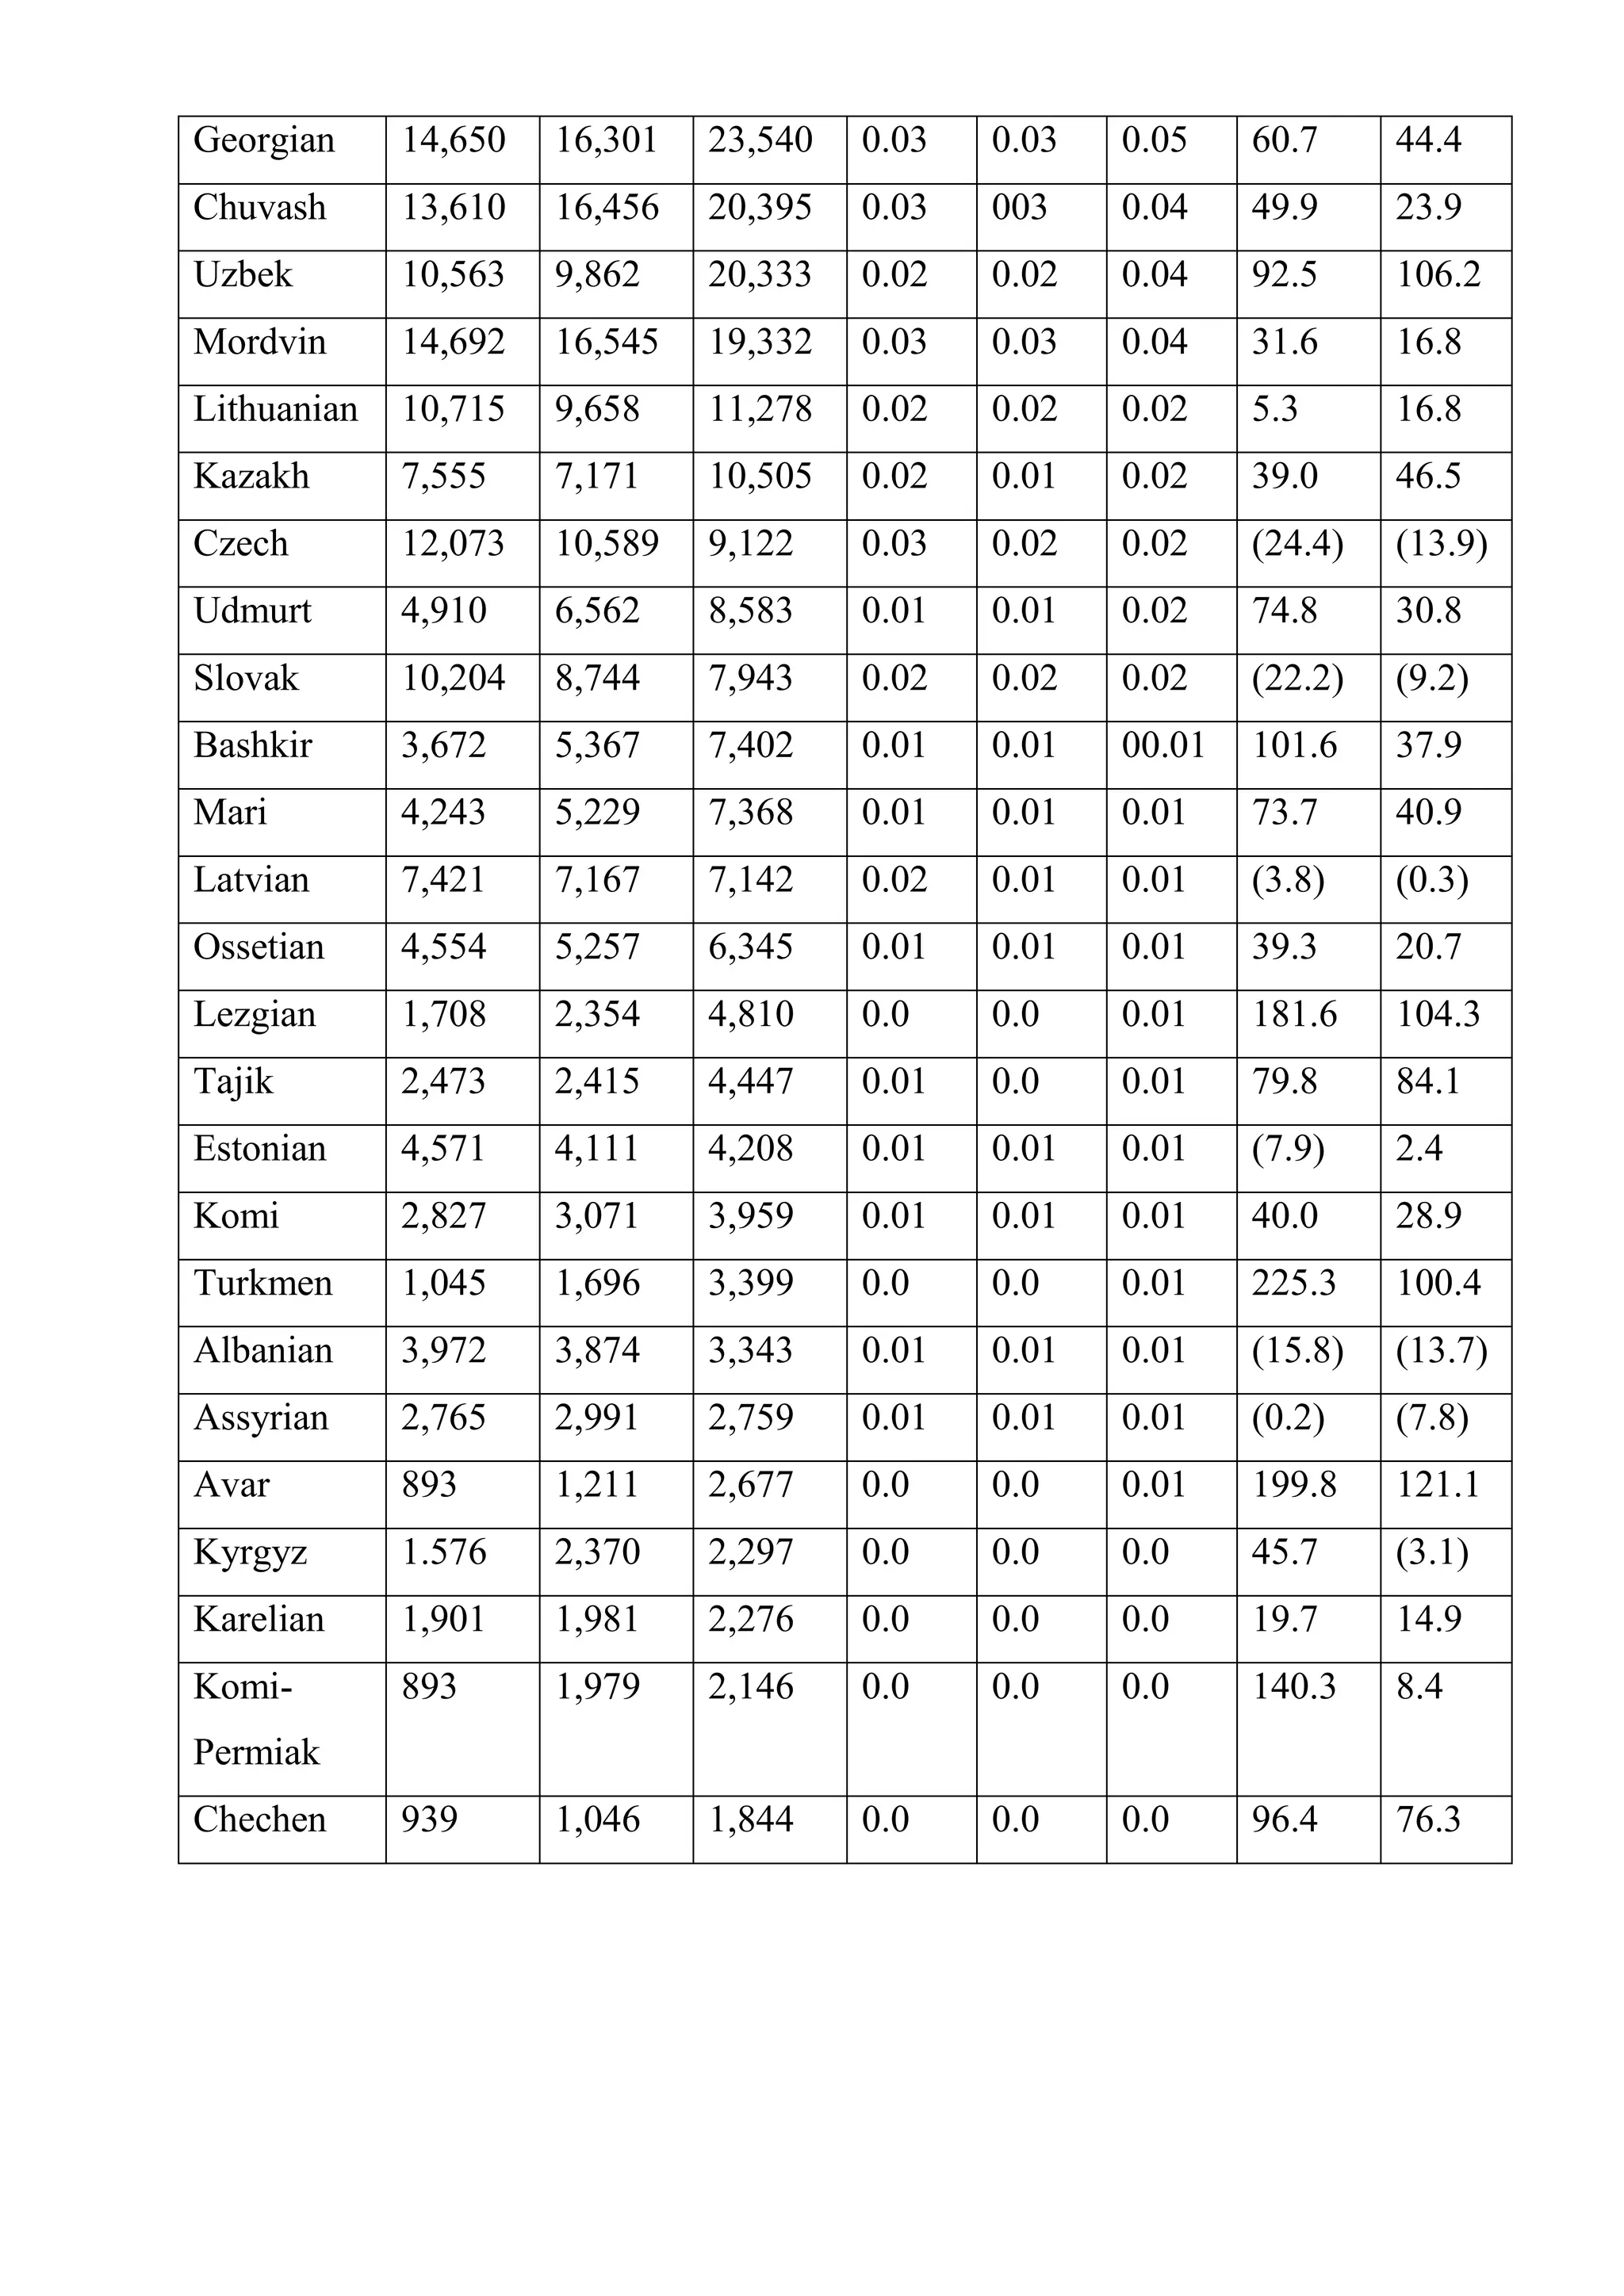
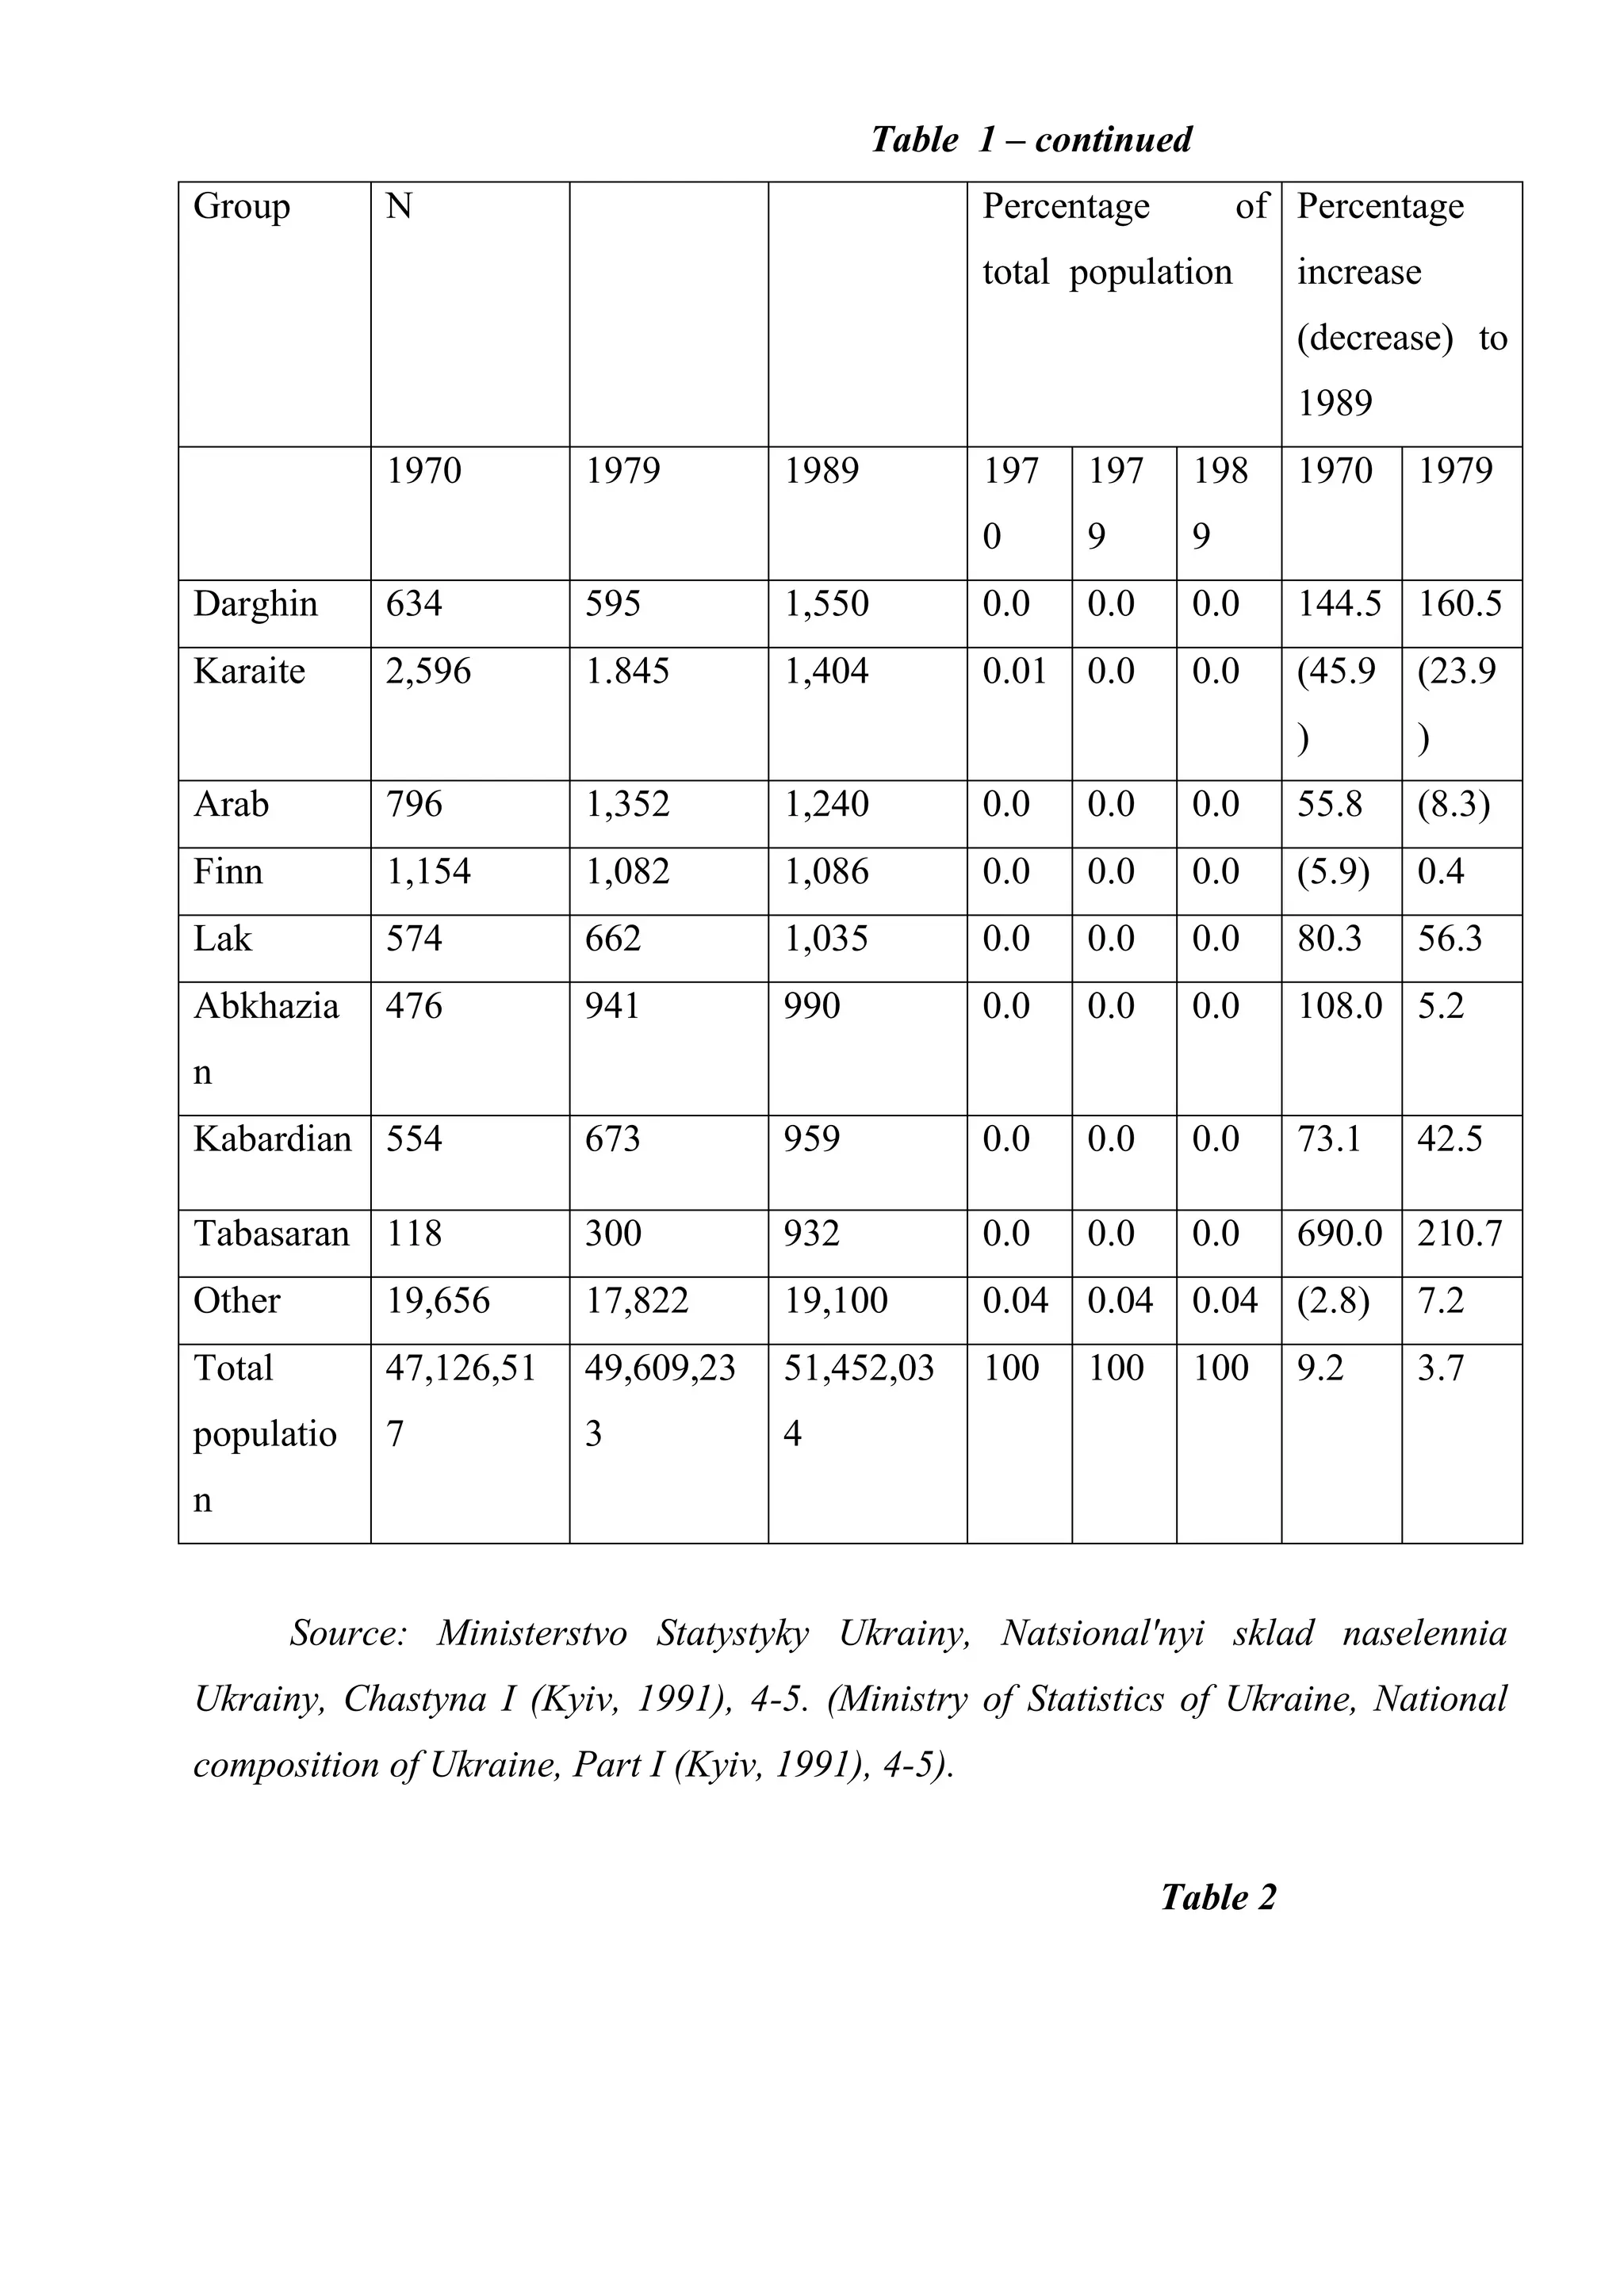
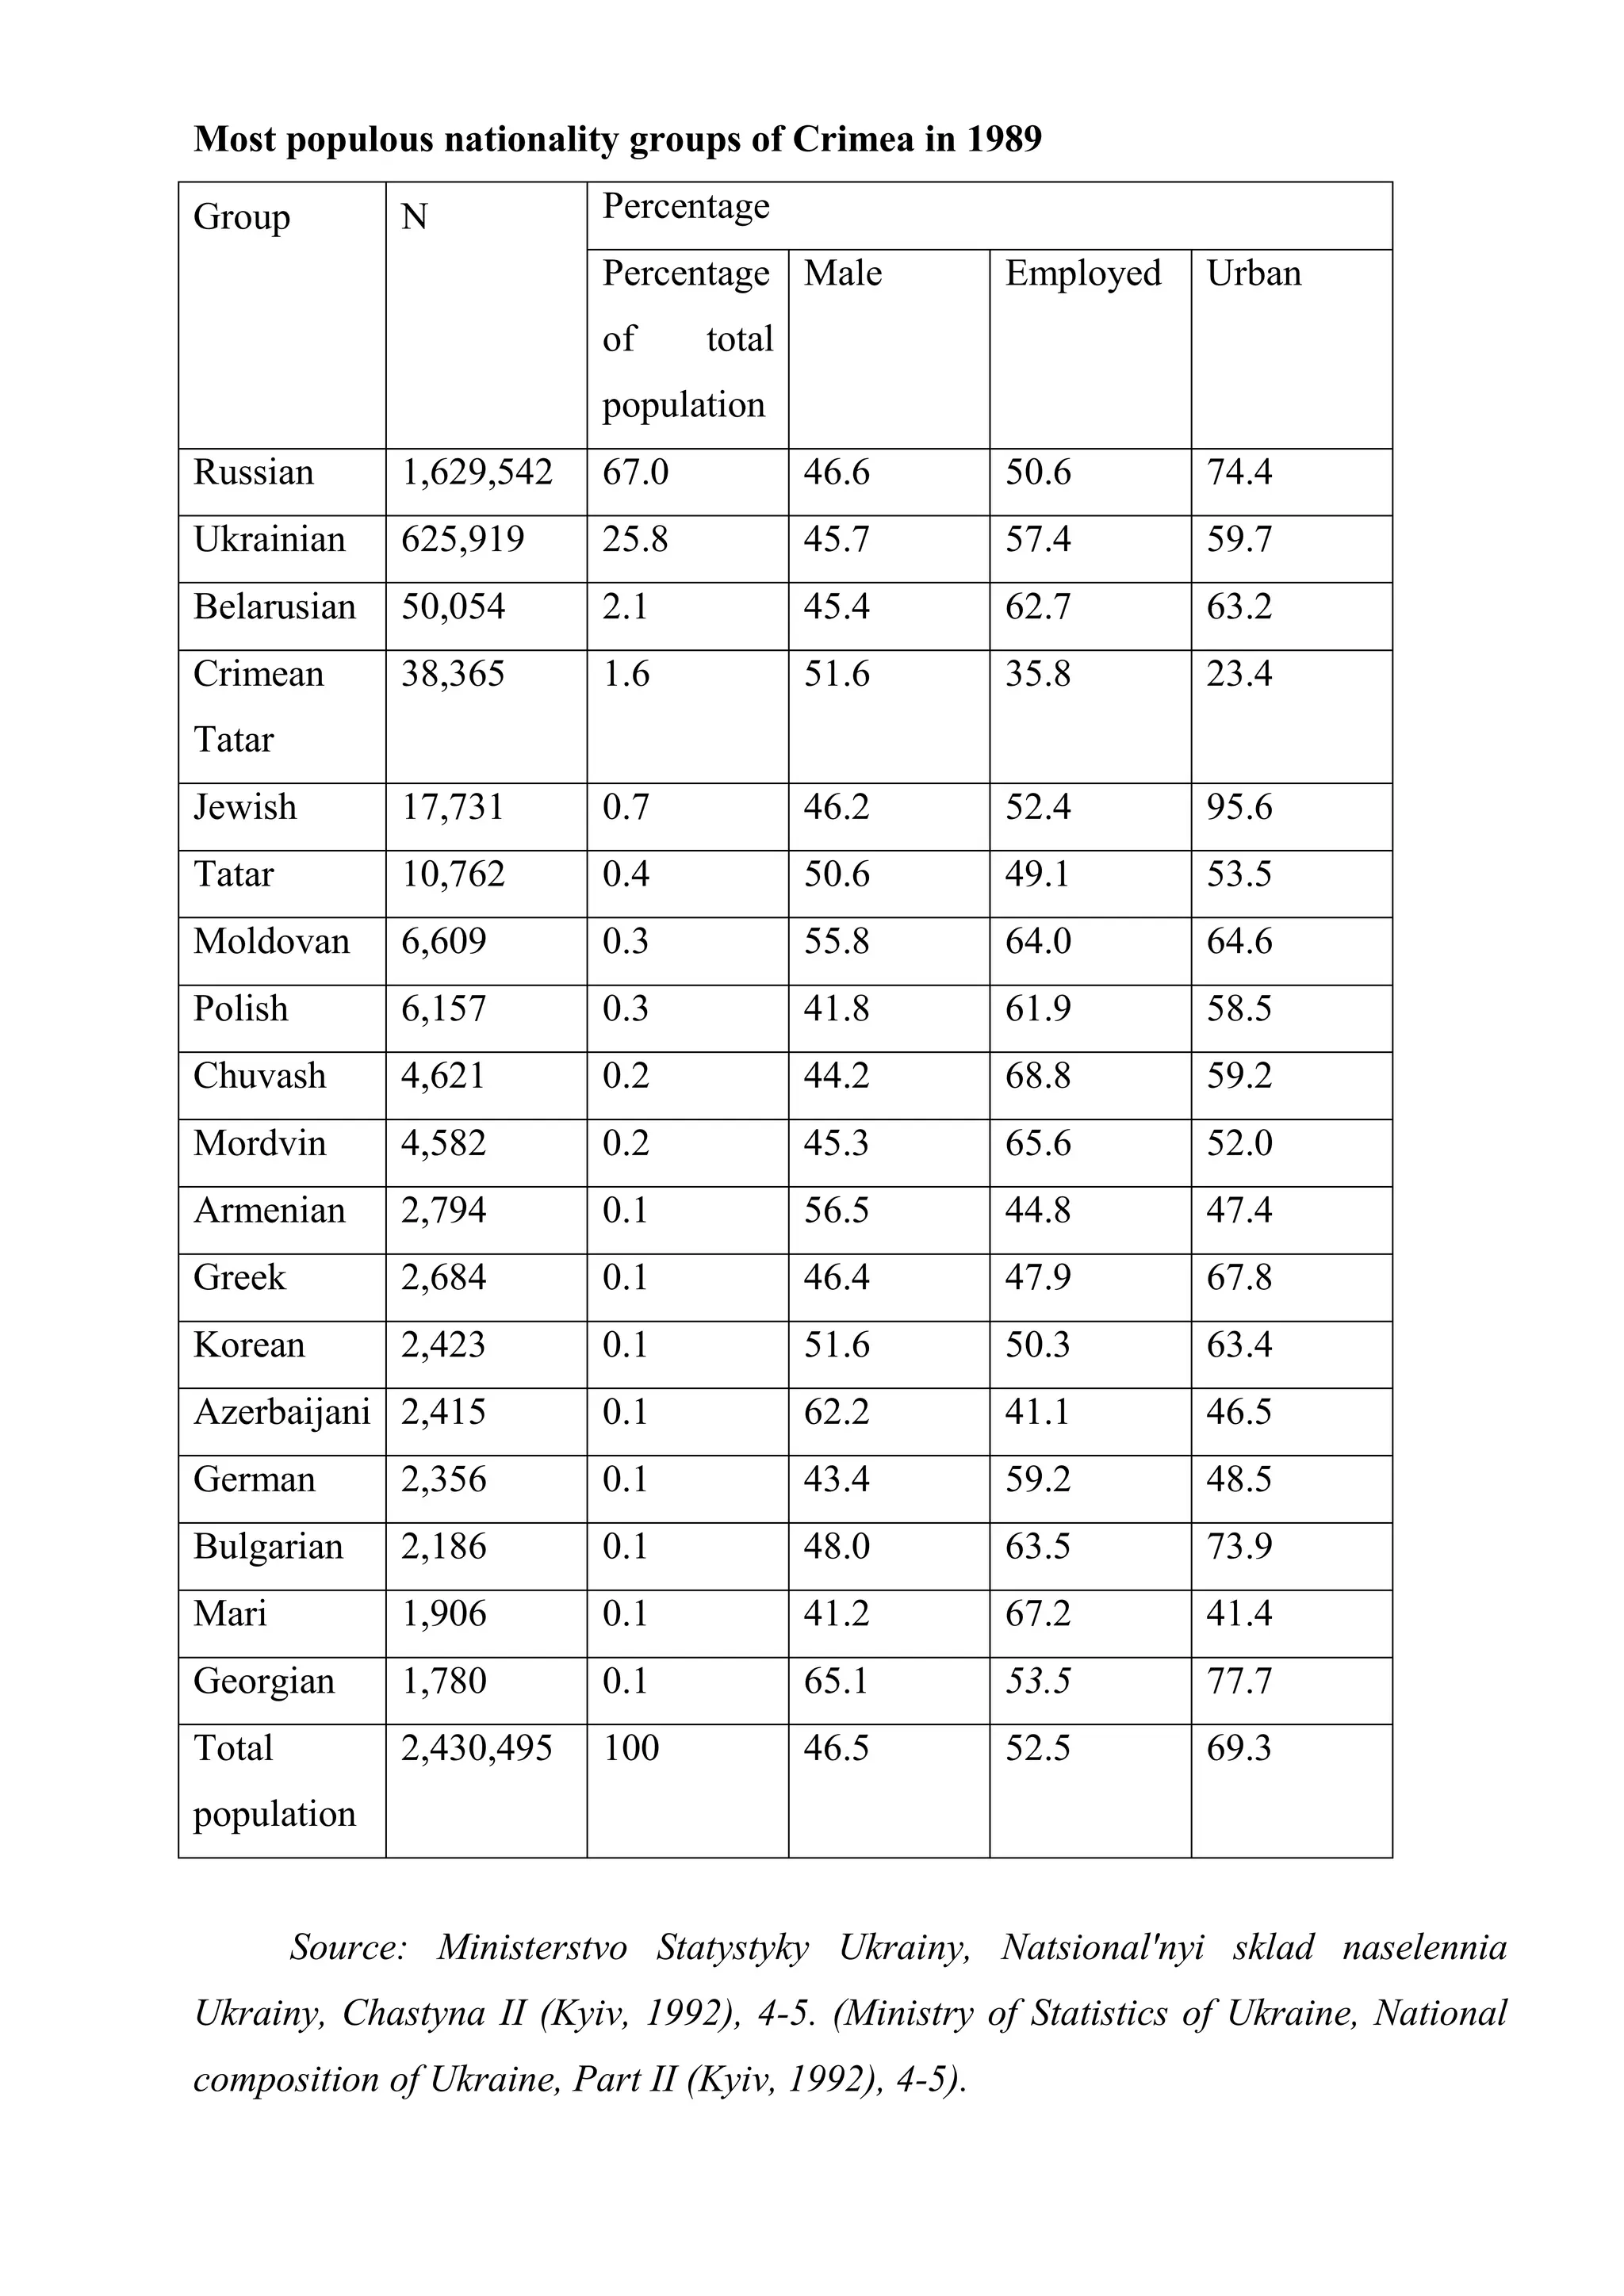
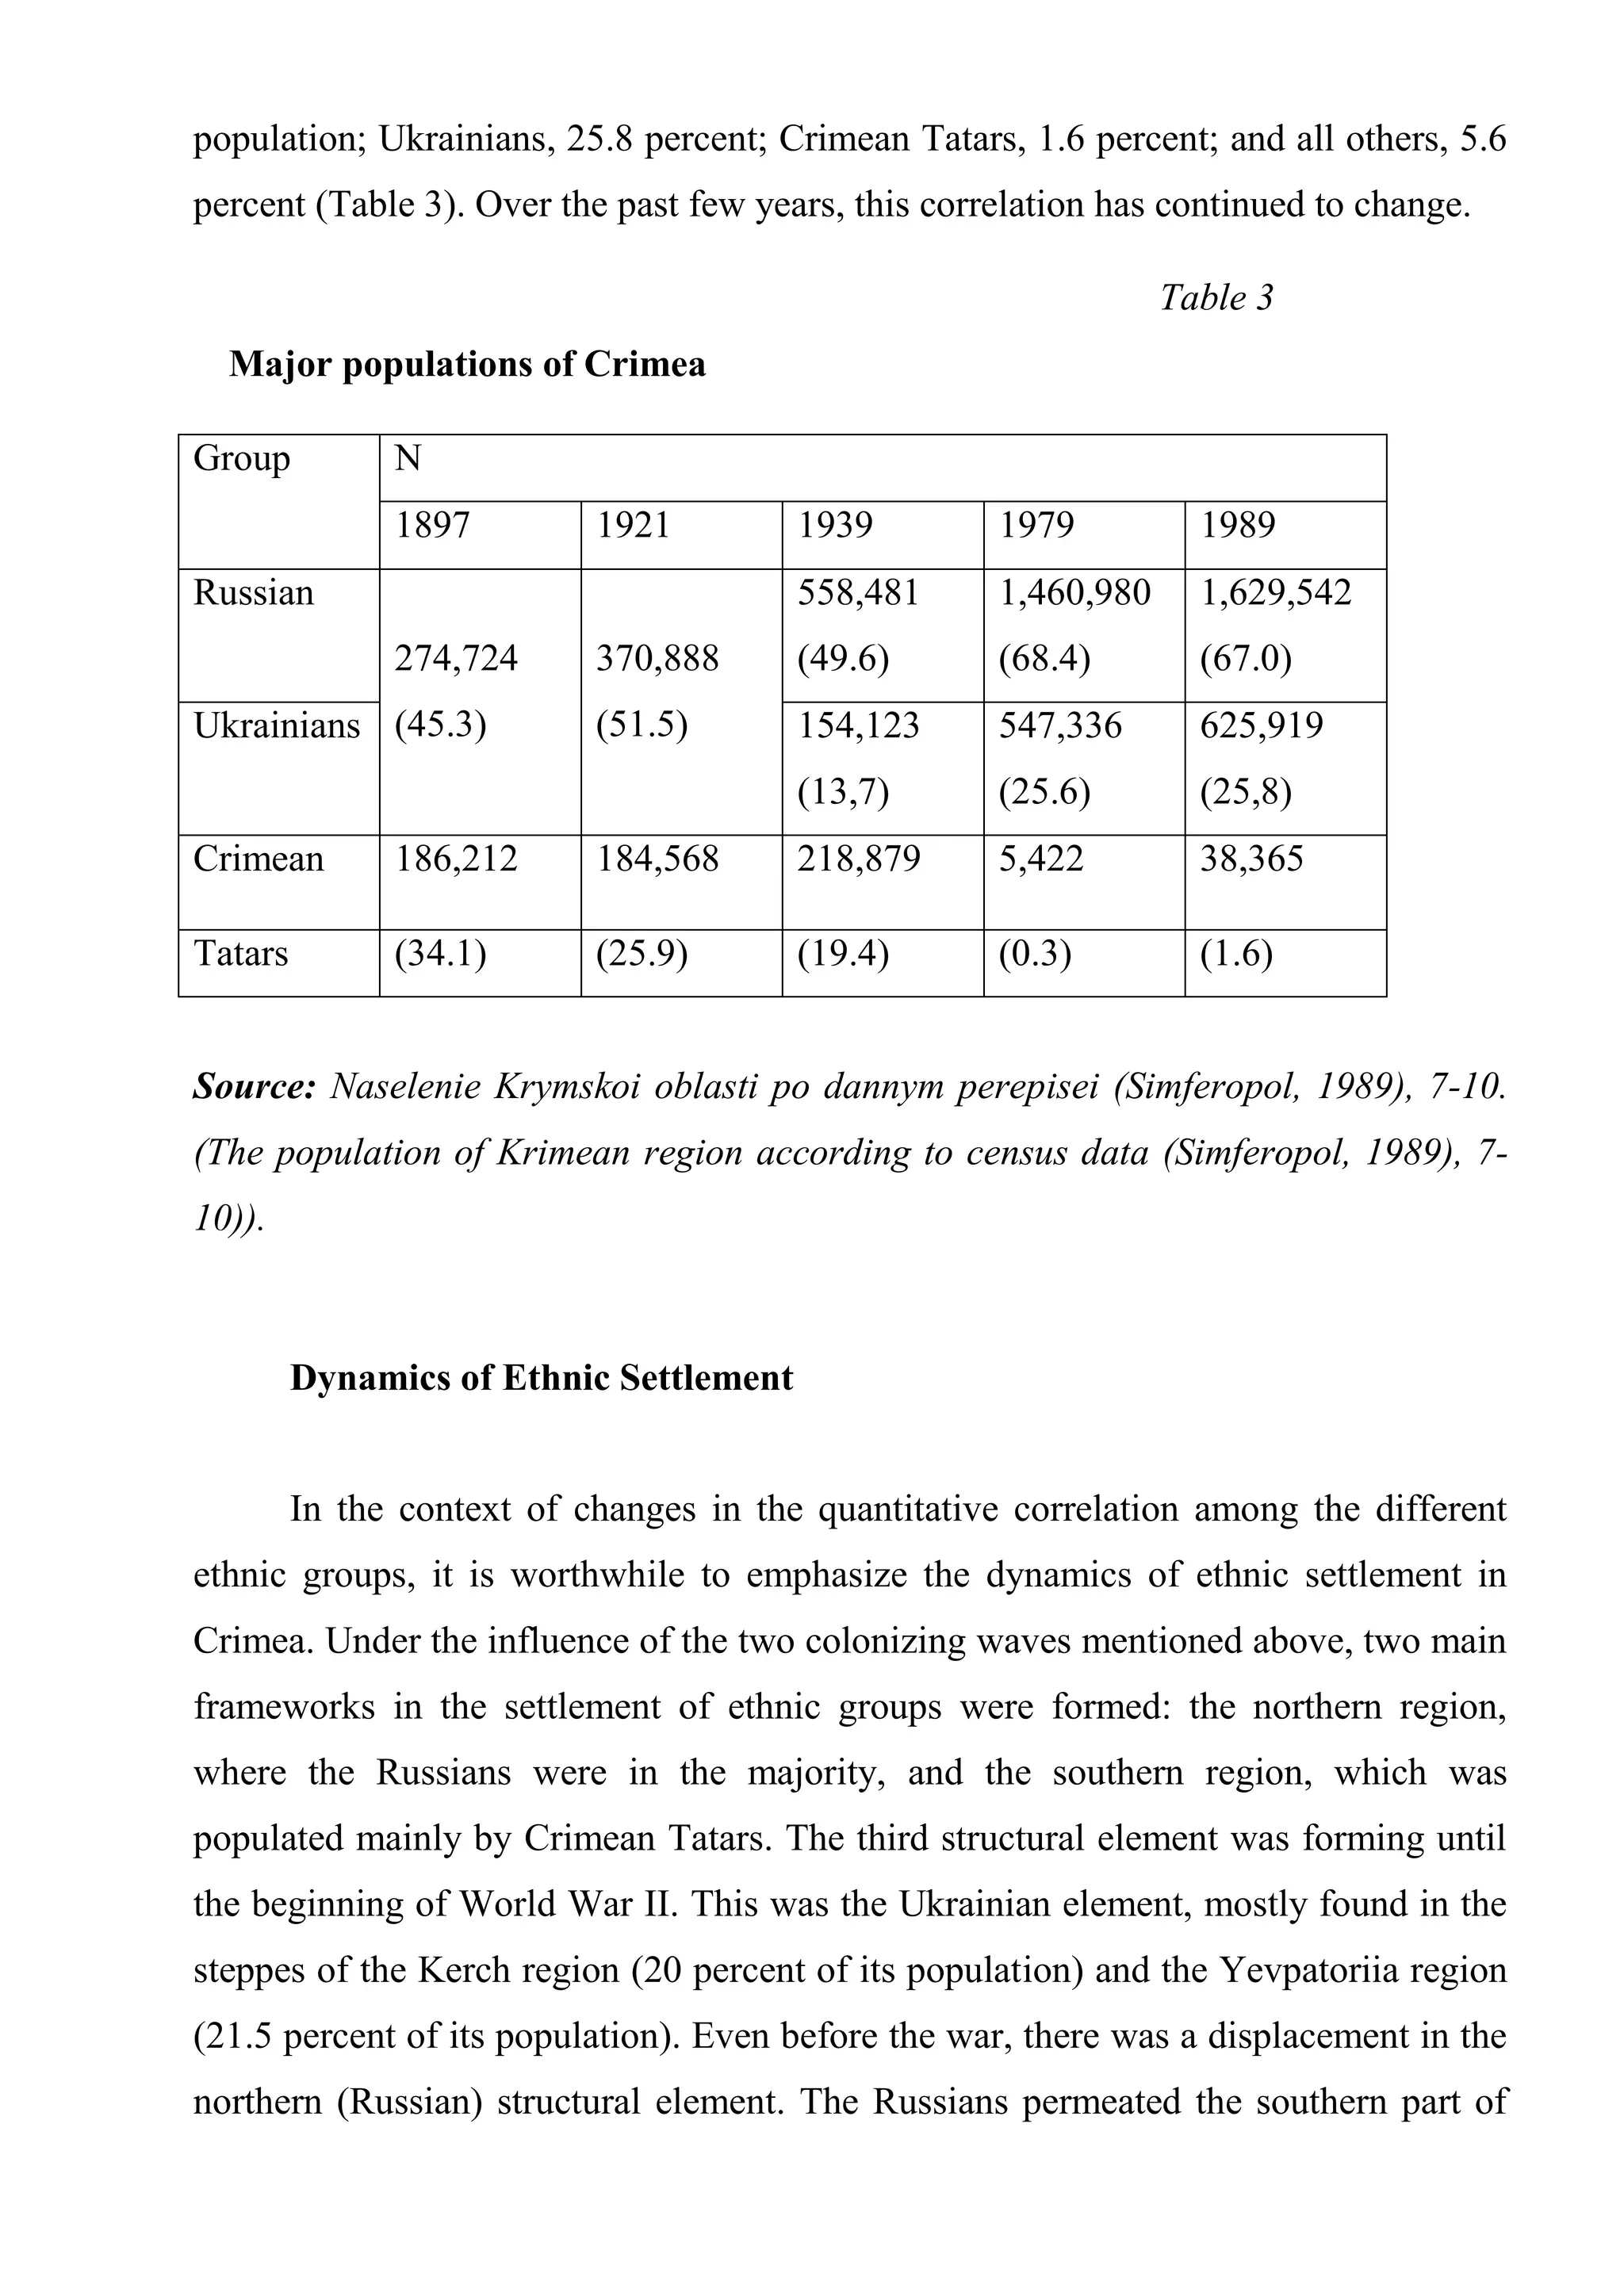
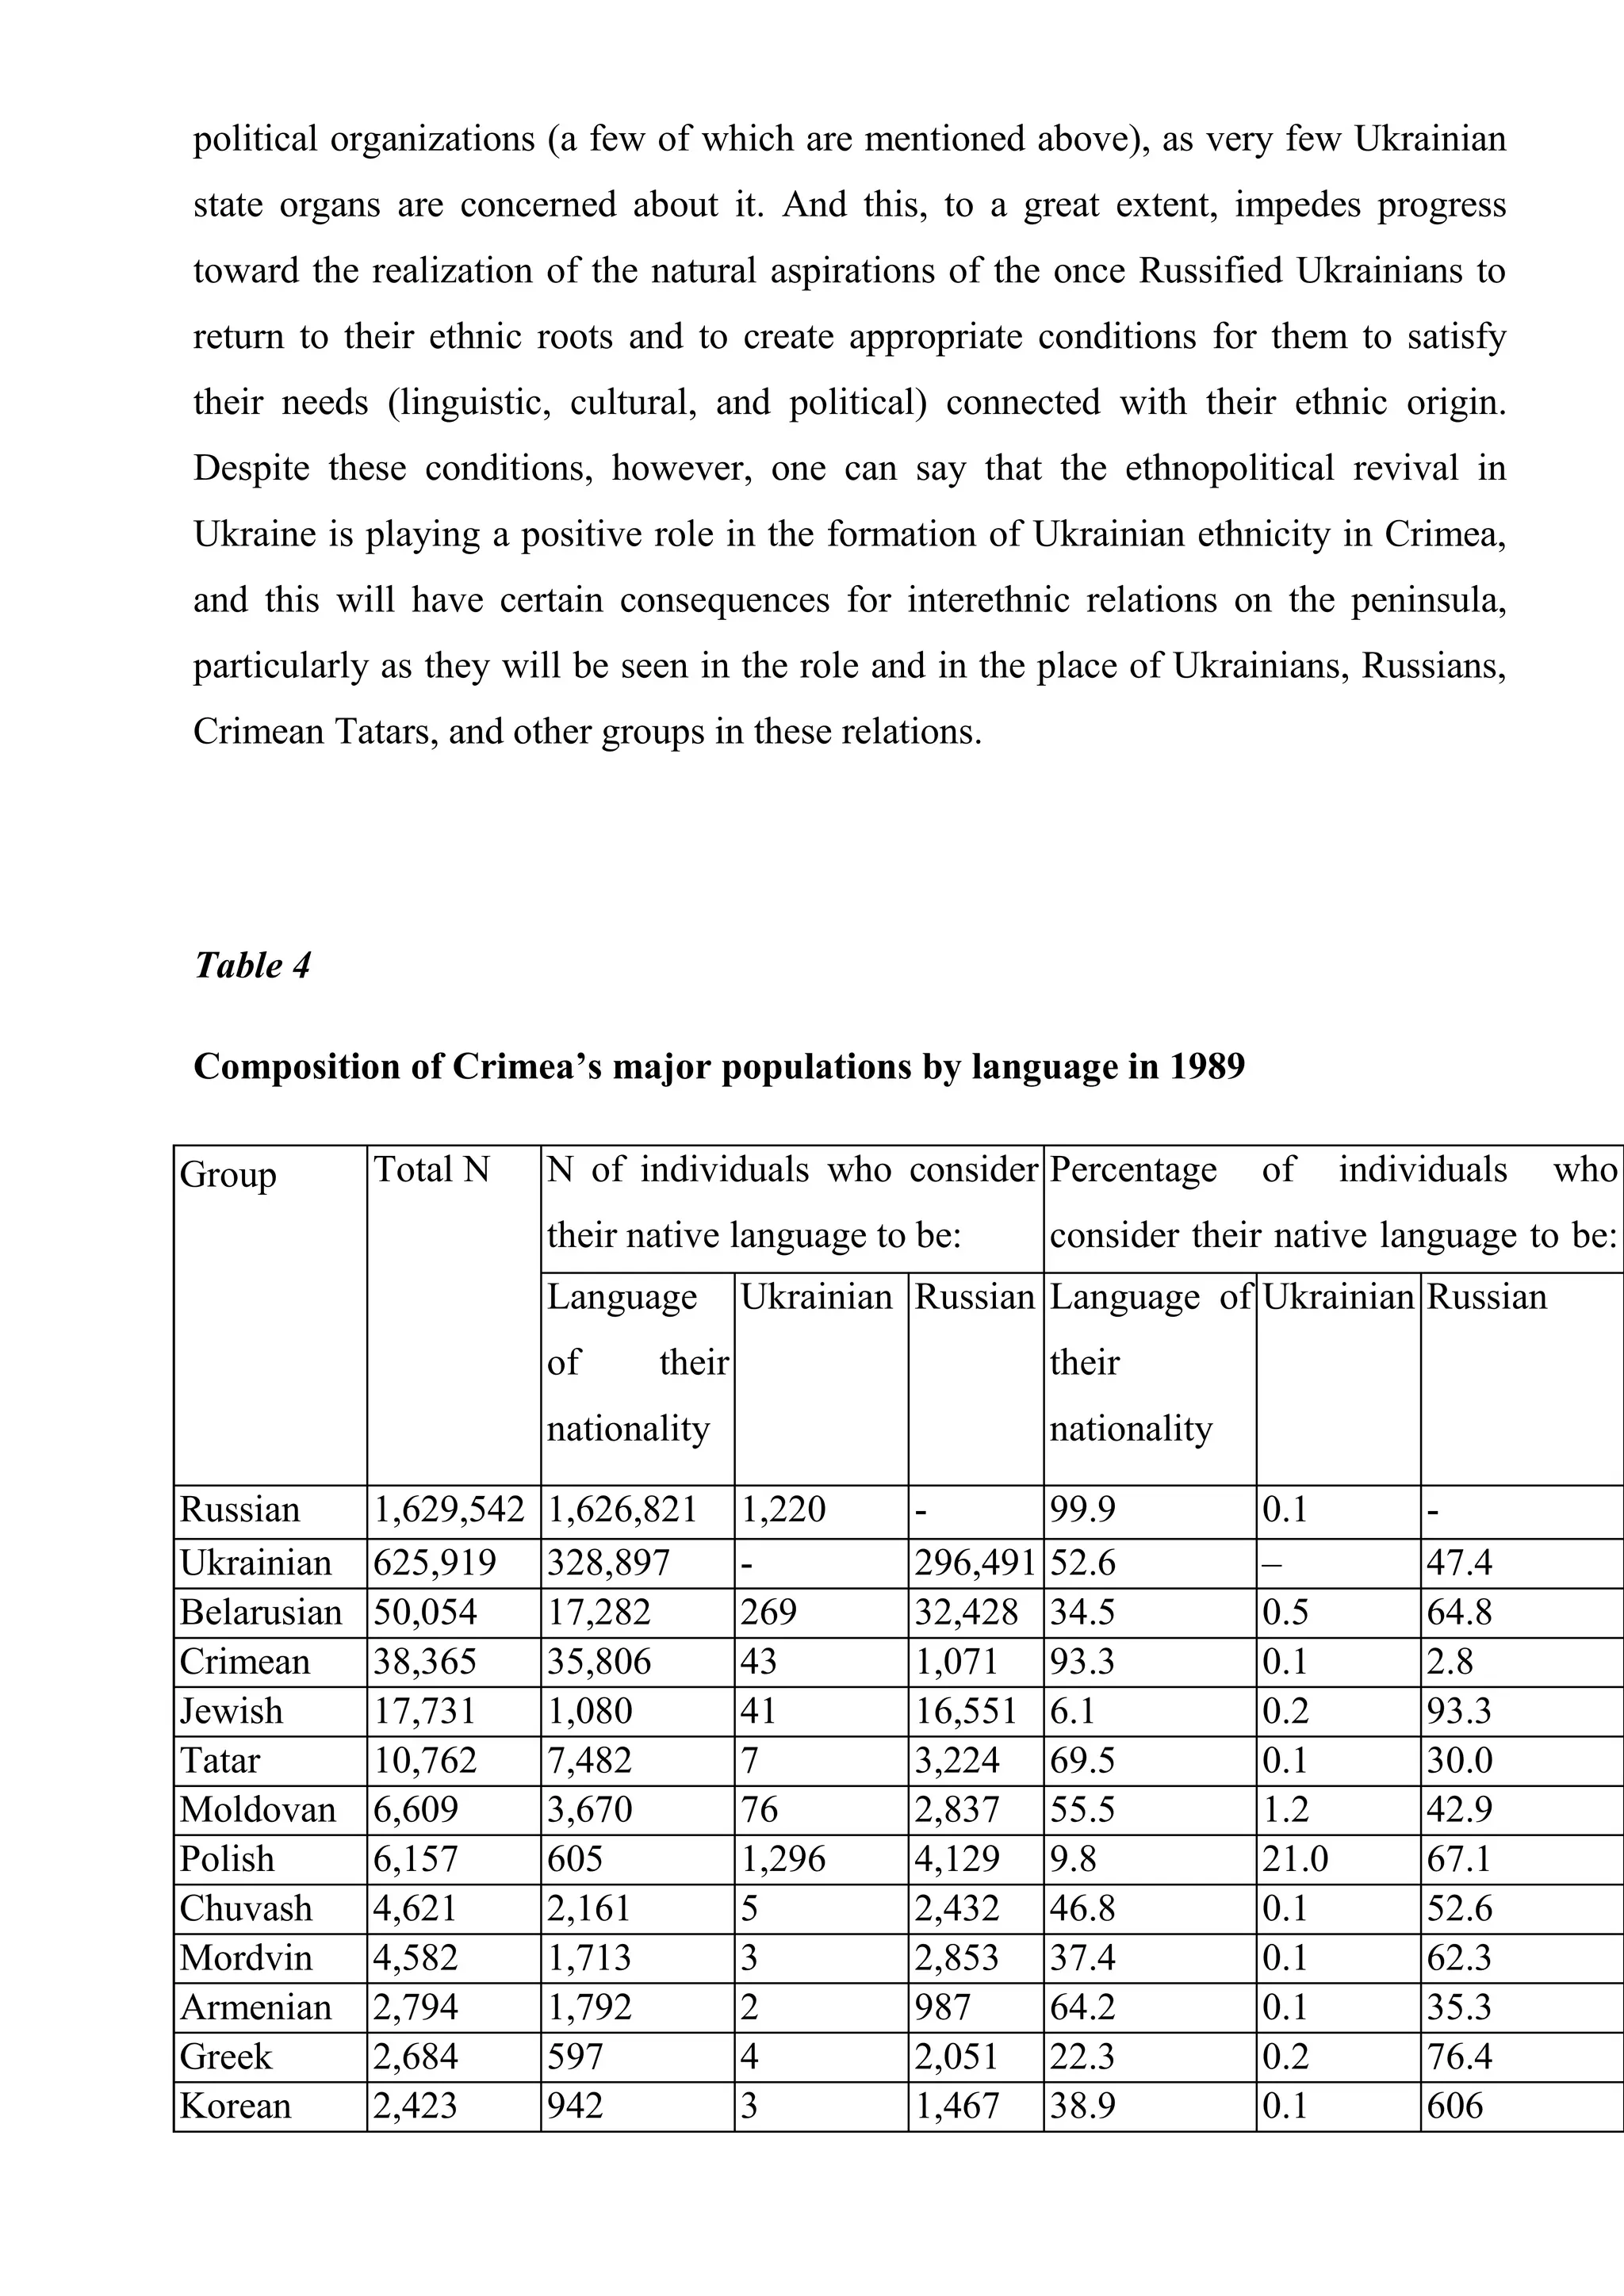
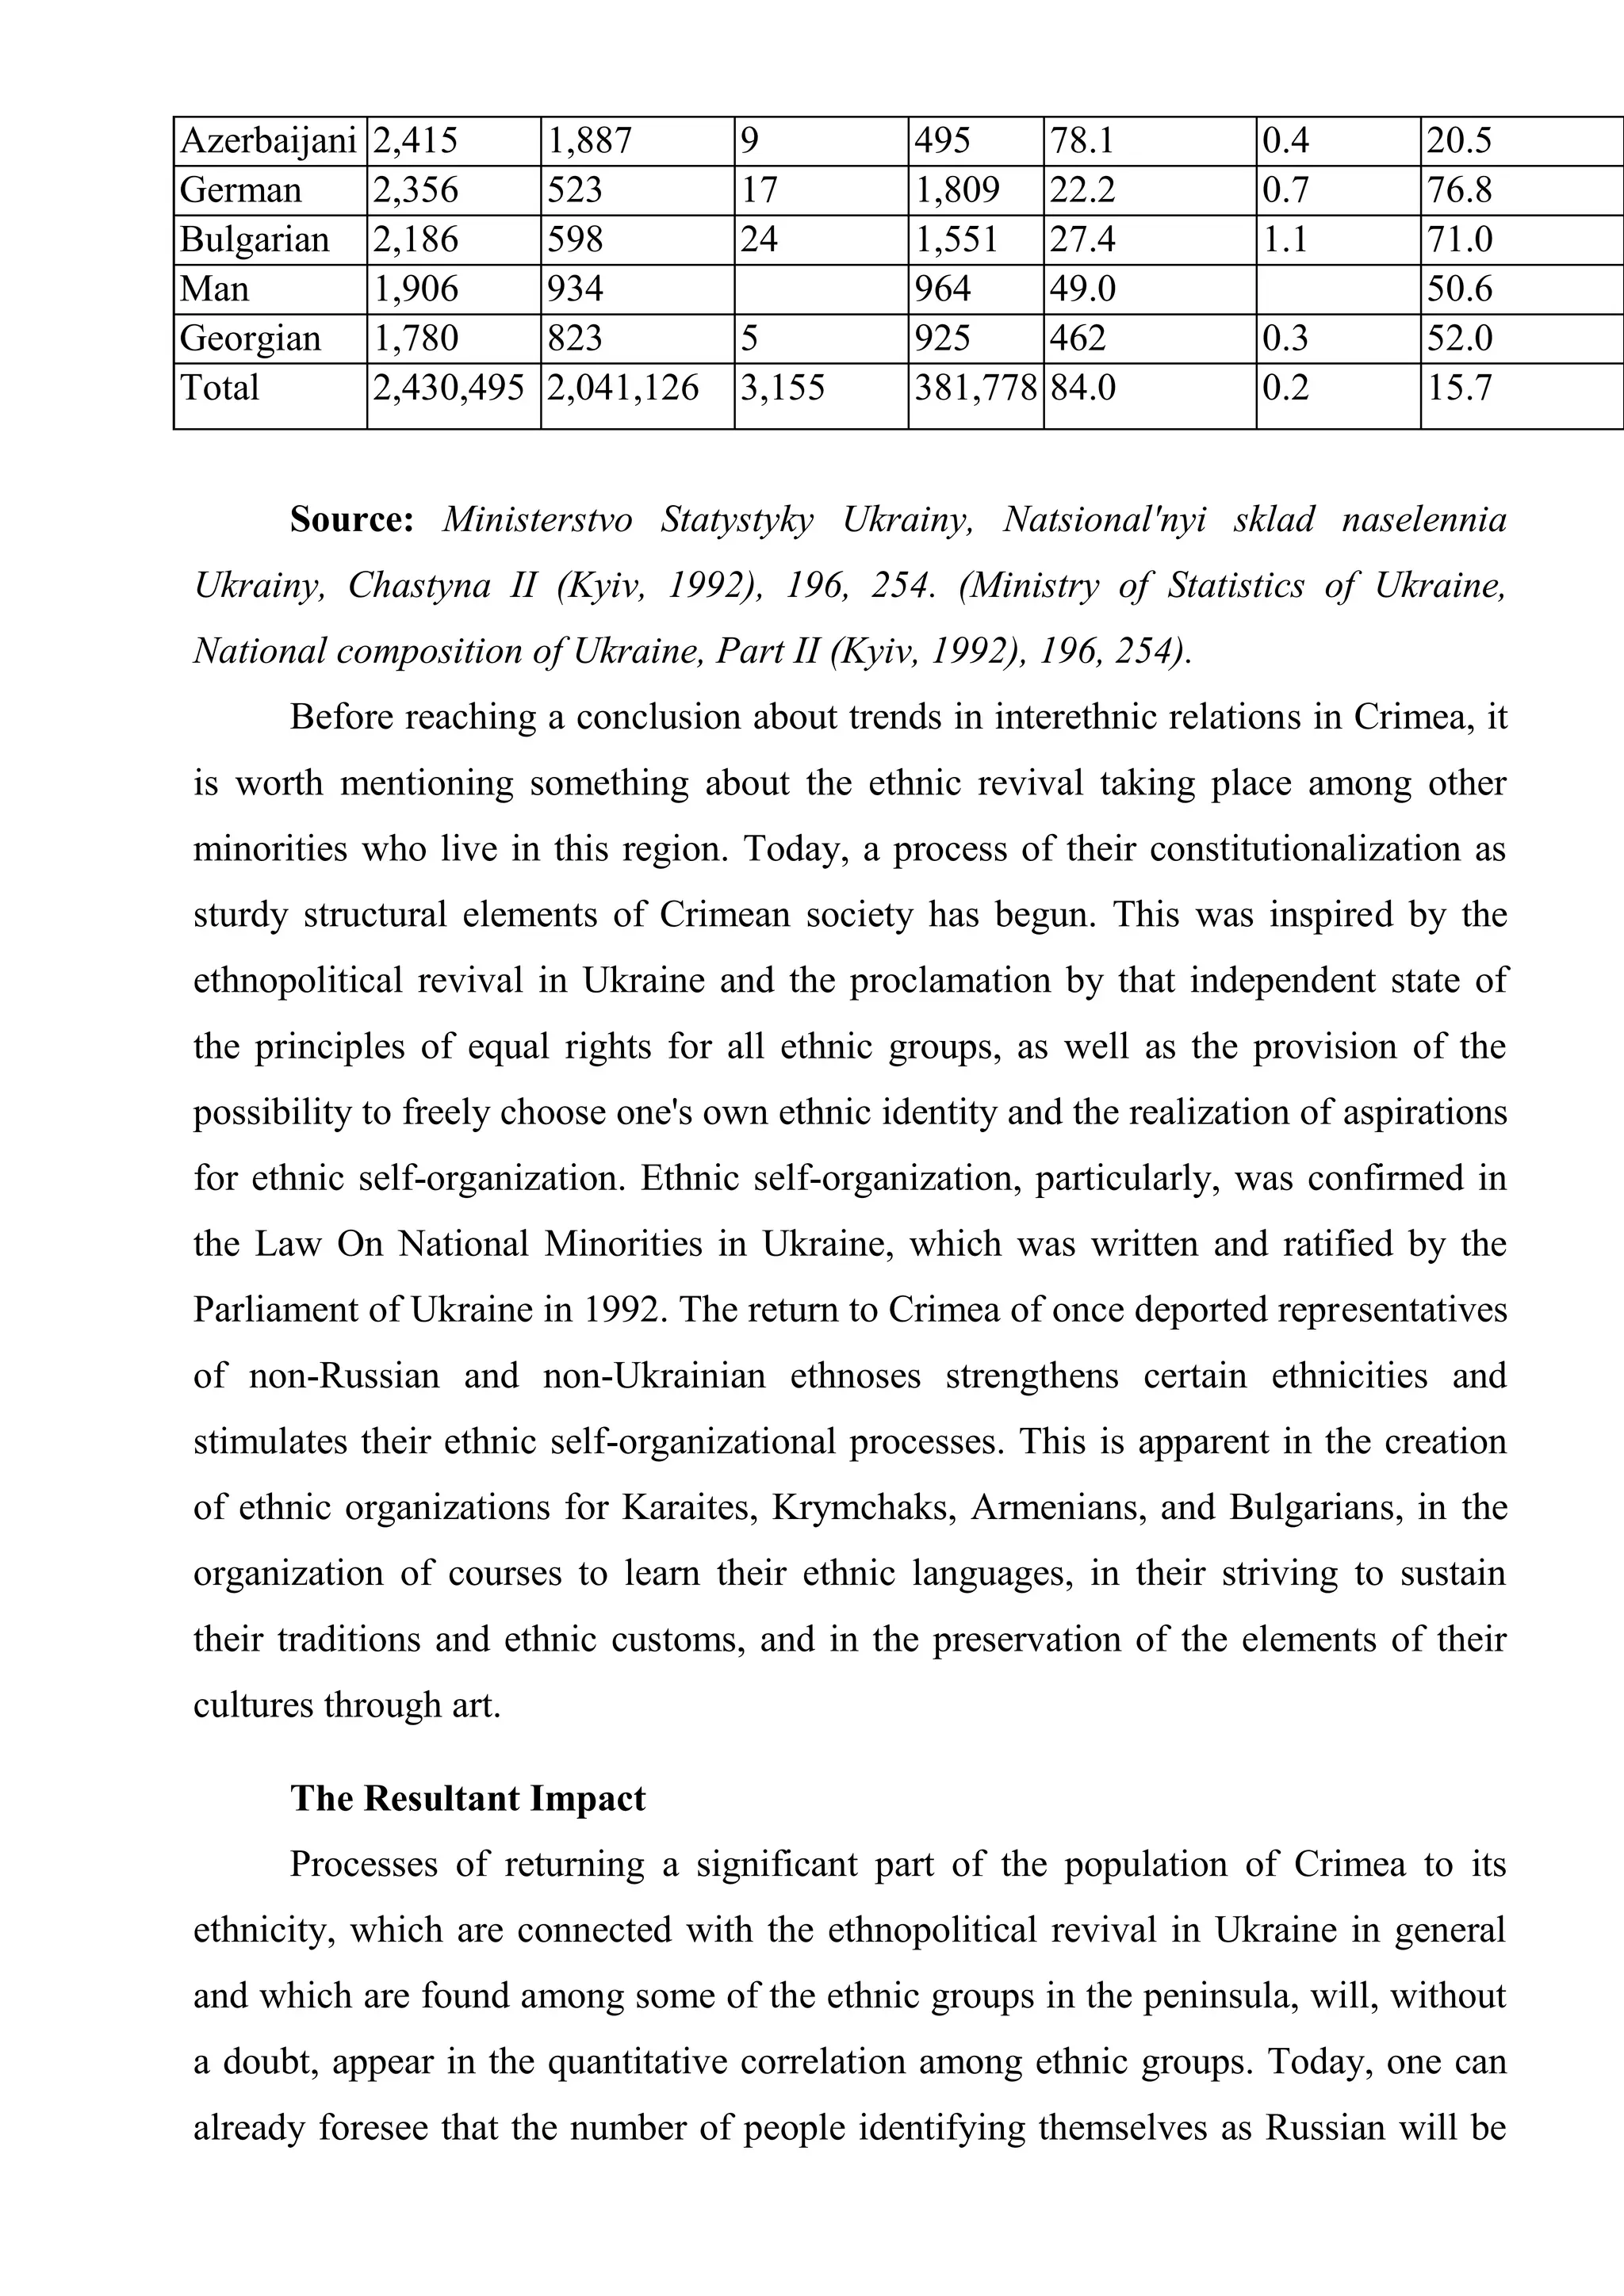
SlideShare a Scribd company logo
1 of 20
Download to read offline
THE DYNAMICS OF INTERETHNIC RELATIONS IN CRIMEA*


    This chapter is based on an ethnological and ethnosociological analysis of the
tendencies, phenomena, and events which had and which continue to have a place in
the social life of the Crimean peninsula. In it I focus on the interactions of the ethnic
groups that determine the character and essence of the contemporary ethnopolitical
situation in Crimea: Russian, Crimean Tatar, and Ukrainian. I also attempt to
determine the place and role of other ethnic groups in today's interethnic relations
(these I classify as the “fourth force”). A real and somewhat objective picture of the
interethnic relations in Crimea can be re-created only when the following factors are
taken into account: the character of the formation of the population's ethnic
composition, the dynamics of ethnic systems of settlement in Crimea, the
contemporary migratory processes, the process of the constitutionalization of ethnic
groups, and the structure of interactions among the largest ethnic groups.

    The Ethnic Diversity of Crimea

    Citizens residing in Ukraine come from many different ethnic backgrounds (Table
1). Today, Crimea is one of Ukraine's most ethnically diverse regions, with ap-
proximately one hundred ethnic groups. The six most populous among them, accord-
ing to the latest census figures (1989), are Russians, Ukrainians, Belarusians,
Crimean Tatars, Jews, and Tatars (Table 2). The population of Crimean Tatars has
risen substantially – to 240,000 – since the last census was taken, and they already
constitute nearly 10 percent of the population of Crimea.


    Table 1


*
 Reprinted with permission from Crimea. Dynamics, Challenges, and Prospects, ed. By Maria Drohobycky (American
Association for the Advancement of Science. Rowman & Littlefield Publishers, INC Copyright 1995), pp. 69-85.
Ethnic composition of the population in Ukraine in 1970, 1979, and 1989

Group        N                                     Percentage of total Percentage increase
                                                   population               (decrease) to 1989
          1970       1979       1989       1970 1979               1989     1970           1989
Ukrainian 35.283.857 36.488.951 37.419.053 74   73.6               72.7     6.1            2.5
Russian 9.126.331 11.471.602 11.355.582 19.4 21.1                  22.1     24.4           8.4


                                            Table 1 - continued


Group            N                          Percentage      of     total Percentage
                                            population                    increase
                                                                          (decrease)        to
                                                                          1989
                 1970     1979     1989     1970     1979        1989     1970       1979

Jewish           775,993 632,610 486,326 1.6         1.3         0.9      (37.3)     (23.1)
Belarusian       385,847 406,098 440,045 0.8         0.8         0.9      14.0       8,4
Moldovan         265,902 293,576 324,525 0.6         0.6         0.6      22.0       10.5
Bulgarian        234,390 238,217 233,800 0.5         0.5         0.5      (0.3       (1.9)
Polish           295,107 258,309 219,179 0.6         0.5         0.4      (25.7)     (15.1)
Hungarian        157,731 164,373 163,111 0.3         0.3         0.3      3.4        (0.8)
Romanian         112,141 121,795 134,825 0.2         0.2         0.3      20.2       10.7
Greek            106,909 104,091 98,594     0.2      0.2         0.2      (7.8)      (5.3)
Tatar            72,658   83,906   86,875   0.15     0.2         0.2      19.6       3.5
Armenian         33,439   38,646   54,200   0.07     0.08        0.1      62.1       40.2
Roma             30,091   34,411   47,917   0.06     0.07        0.09     59.2       39.2
Crimean          3,554    6,636    46,807   0.01     0.01        0.09     1,217.0 605.3
Tatar
German           29,871   34,139   37,849   0.06     0.07        0.07     26.7       10.9
Azerbaijani 10,769        17,235   36,961   0.02     0.03        0.07     243.2      114.5
Gagauz           26,464   29,398   31,967   0.06     0.06        0.06     20.8       8.7
Georgian     14,650   16,301   23,540   0.03   0.03   0.05    60.7     44.4
Chuvash      13,610   16,456   20,395   0.03   003    0.04    49.9     23.9
Uzbek        10,563   9,862    20,333   0.02   0.02   0.04    92.5     106.2
Mordvin      14,692   16,545   19,332   0.03   0.03   0.04    31.6     16.8
Lithuanian   10,715   9,658    11,278   0.02   0.02   0.02    5.3      16.8
Kazakh       7,555    7,171    10,505   0.02   0.01   0.02    39.0     46.5
Czech        12,073   10,589   9,122    0.03   0.02   0.02    (24.4)   (13.9)
Udmurt       4,910    6,562    8,583    0.01   0.01   0.02    74.8     30.8
Slovak       10,204   8,744    7,943    0.02   0.02   0.02    (22.2)   (9.2)
Bashkir      3,672    5,367    7,402    0.01   0.01   00.01   101.6    37.9
Mari         4,243    5,229    7,368    0.01   0.01   0.01    73.7     40.9
Latvian      7,421    7,167    7,142    0.02   0.01   0.01    (3.8)    (0.3)
Ossetian     4,554    5,257    6,345    0.01   0.01   0.01    39.3     20.7
Lezgian      1,708    2,354    4,810    0.0    0.0    0.01    181.6    104.3
Tajik        2,473    2,415    4,447    0.01   0.0    0.01    79.8     84.1
Estonian     4,571    4,111    4,208    0.01   0.01   0.01    (7.9)    2.4
Komi         2,827    3,071    3,959    0.01   0.01   0.01    40.0     28.9
Turkmen      1,045    1,696    3,399    0.0    0.0    0.01    225.3    100.4
Albanian     3,972    3,874    3,343    0.01   0.01   0.01    (15.8)   (13.7)
Assyrian     2,765    2,991    2,759    0.01   0.01   0.01    (0.2)    (7.8)
Avar         893      1,211    2,677    0.0    0.0    0.01    199.8    121.1
Kyrgyz       1.576    2,370    2,297    0.0    0.0    0.0     45.7     (3.1)
Karelian     1,901    1,981    2,276    0.0    0.0    0.0     19.7     14.9
Komi-        893      1,979    2,146    0.0    0.0    0.0     140.3    8.4
Permiak
Chechen      939      1,046    1,844    0.0    0.0    0.0     96.4     76.3
Table 1 – continued
Group        N                                       Percentage         of Percentage
                                                     total population       increase
                                                                            (decrease) to
                                                                            1989
             1970        1979         1989           197   197     198      1970    1979
                                                     0     9       9
Darghin      634         595          1,550          0.0   0.0     0.0      144.5 160.5
Karaite      2,596       1.845        1,404          0.01 0.0      0.0      (45.9   (23.9
                                                                            )       )
Arab         796         1,352        1,240          0.0   0.0     0.0      55.8    (8.3)
Finn         1,154       1,082        1,086          0.0   0.0     0.0      (5.9)   0.4
Lak          574         662          1,035          0.0   0.0     0.0      80.3    56.3
Abkhazia     476         941          990            0.0   0.0     0.0      108.0 5.2
n
Kabardian 554            673          959            0.0   0.0     0.0      73.1    42.5

Tabasaran 118            300          932            0.0   0.0     0.0      690.0 210.7
Other        19,656      17,822       19,100         0.04 0.04 0.04 (2.8)           7.2
Total        47,126,51   49,609,23    51,452,03      100   100     100      9.2     3.7
populatio    7           3            4
n


        Source: Ministerstvo Statystyky Ukrainy, Natsional'nyi sklad naselennia
Ukrainy, Chastyna I (Kyiv, 1991), 4-5. (Ministry of Statistics of Ukraine, National
composition of Ukraine, Part I (Kyiv, 1991), 4-5).


                                                                  Table 2
Most populous nationality groups of Crimea in 1989

Group          N           Percentage
                           Percentage Male            Employed   Urban
                           of     total
                           population
Russian        1,629,542   67.0           46.6        50.6       74.4
Ukrainian      625,919     25.8           45.7        57.4       59.7
Belarusian     50,054      2.1            45.4        62.7       63.2
Crimean        38,365      1.6            51.6        35.8       23.4
Tatar
Jewish         17,731      0.7            46.2        52.4       95.6
Tatar          10,762      0.4            50.6        49.1       53.5
Moldovan       6,609       0.3            55.8        64.0       64.6
Polish         6,157       0.3            41.8        61.9       58.5
Chuvash        4,621       0.2            44.2        68.8       59.2
Mordvin        4,582       0.2            45.3        65.6       52.0
Armenian       2,794       0.1            56.5        44.8       47.4
Greek          2,684       0.1            46.4        47.9       67.8
Korean         2,423       0.1            51.6        50.3       63.4
Azerbaijani 2,415          0.1            62.2        41.1       46.5
German         2,356       0.1            43.4        59.2       48.5
Bulgarian      2,186       0.1            48.0        63.5       73.9
Mari           1,906       0.1            41.2        67.2       41.4
Georgian       1,780       0.1            65.1        53.5       77.7
Total          2,430,495   100            46.5        52.5       69.3
population


         Source: Ministerstvo Statystyky Ukrainy, Natsional'nyi sklad naselennia
Ukrainy, Chastyna II (Kyiv, 1992), 4-5. (Ministry of Statistics of Ukraine, National
composition of Ukraine, Part II (Kyiv, 1992), 4-5).
Migratory Processes


        The contemporary ethnic composition of the population of Crimea is the result
of various causes, both objective and subjective, with the most important being
migratory processes. One can assert that the current population of Crimea was formed
as a result of both early and late migrations. It is worth remembering that the
peninsula long remained under the continuous influence of two colonizing waves,
one from the north and the other from the south. From an ethnic point of view,
today's population can be divided into two major groups: (1) the much older ("old")
and, to a certain extent, native and (2) the more recent ("arrived"). The first group
includes the Tatars, Roma (Gypsies), Krymchaks, Karaites, and a small group of
Armenians and Greeks who stayed behind on the peninsula after being exiled to the
Mariupol region by Catherine the Great. Based on the 1926 census, the old group
accounted for nearly 27 percent (190,000) of the entire population of Crimea. The
arrived group consisted of migrants from the north and the west (Russians,
Ukrainians, Jews, Germans, Poles, Czechs, and Ests) and settlers from the south
(Greeks, Armenians, and Bulgarians).
    The quantitative correlation among the different ethnic groups of Crimea changed
constantly. Until the end of the eighteenth century, the Crimean Tatars were the
largest ethnic group based on size. The process of formation of me Crimean Tatar
people had been completed in the sixteenth century1. After Crimea's annexation by
Russia in 1873, Crimea was intensively colonized by the Russians and less
intensively by the Ukrainians, Germans, Bulgarians, Jews, Armenians, Greeks, and
other ethnic groups. Based on figures from me first census ever taken in the Russian
Empire, in 1897, Russians and Ukrainians constituted 45.3 percent of the population
and the Crimean Tatars, 34.1 percent (Table 3). After World War II, this correlation
changed radically. Based on the 1989 census, Russians constituted 67 percent of the


1
 V.Vozgrin, “Pravo na povernennia: Etnogenez i derzhavnist’ kryms’ kykh tatar“, Holos Ukrainy, №105 (1994); 12
(V.Vozgrin, “The right for comeback: Ethnogenesis and Krimean Tatars stateness”, Holos Ukrainy, №105 (1994); 12)
population; Ukrainians, 25.8 percent; Crimean Tatars, 1.6 percent; and all others, 5.6
percent (Table 3). Over the past few years, this correlation has continued to change.

                                                                 Table 3
  Major populations of Crimea

Group          N
               1897         1921         1939        1979          1989
Russian                                  558,481     1,460,980     1,629,542
               274,724      370,888      (49.6)      (68.4)        (67.0)
Ukrainians (45.3)           (51.5)       154,123     547,336       625,919
                                         (13,7)      (25.6)        (25,8)
Crimean        186,212      184,568      218,879     5,422         38,365

Tatars         (34.1)       (25.9)       (19.4)      (0.3)         (1.6)


Source: Naselenie Krymskoi oblasti po dannym perepisei (Simferopol, 1989), 7-10.
(The population of Krimean region according to census data (Simferopol, 1989), 7-
10)).


         Dynamics of Ethnic Settlement


         In the context of changes in the quantitative correlation among the different
ethnic groups, it is worthwhile to emphasize the dynamics of ethnic settlement in
Crimea. Under the influence of the two colonizing waves mentioned above, two main
frameworks in the settlement of ethnic groups were formed: the northern region,
where the Russians were in the majority, and the southern region, which was
populated mainly by Crimean Tatars. The third structural element was forming until
the beginning of World War II. This was the Ukrainian element, mostly found in the
steppes of the Kerch region (20 percent of its population) and the Yevpatoriia region
(21.5 percent of its population). Even before the war, there was a displacement in the
northern (Russian) structural element. The Russians permeated the southern part of
the peninsula, weakening the foundation of the Crimean Tatar structural element.
After World War II, significant changes occurred in the quantitative correlation as
well as in the internal structure of Crimea's ethnic groups.
           First, there was a virtually total replacement of the Russian and Ukrainian
prerevolutionary populations. After the war, a great mass of people living in the
oblasts of central Russia, ruined during the war, were resettled in Crimea, and after
1954 (the year that Crimea was transferred to Ukraine), the migration of Ukrainians
to the peninsula intensified, especially from the regions of western Ukraine, where
there was a labor surplus. Incidentally, in the earliest censuses (until 1939),
Ukrainians were grouped with the Russians (Table 4.3). (This explains why it is not
easy to determine the size of the Ukrainian population from earlier periods.) Based on
a book published in Berlin in 1918, Ukrainians constituted 42 percent of the
1,880,000 people living on the territory of Tavria, the major part of which was
Crimea2.
           Second, the deportation in 1944 of the Crimean Tatars, Germans, Armenians,
Bulgarians, and several other nationalities meant that their representation as members
of the population of the peninsula declined sharply. As a result, the Crimean Tatar
component virtually disappeared from the ethnic structure of Crimea.
           Third, the return of the deported Crimean Tatars, which intensified in the late
1980s and early 1990s, changed to some extent the quantitative correlation among the
three basic ethnic groups on the peninsula. Their return, substantially strengthened
the peninsula's Crimean Tatar component. Strengthening the structural element is
connected with the migration processes on the peninsula itself, including that of the
Crimean Tatars. This has led to a recent change in the dynamics of the ethnic
settlement system, which brings about certain peculiarities in interethnic relations.
Incidentally, based on ethnological laws, systems of settlement of ethnic groups play
a significant role in the formation of the character and essence of interethnic
relations.


2
    Heinrich Lanz, Ukraina (Berlin: Georg Stilke, 1918), 10.
Regional Formation
         Looking at the present-day settlements of Crimea's ethnic groups, we can
define three types of regions, placing at the base of our structure the level of ethnic
diversity or the level of the population mix of various ethnic origins:3
         1. Monoethnic regions are places where one type of group is predominant (and
very visible). Incidentally, if until the deportation of the Crimean Tatars it was
characteristic for them to live in this type of region (for example, Bakhchysarai and
Sudak), today the only places that can be referred to as such regions are separate
locations with Russian populations (for example, Sevastopol and Yalta).
         2. Regions of "mixed diversity" are places where one of the ethnic groups is
dominant, but it constitutes less than two-thirds of die population. Simferopol and a
part of the central region of Crimea, where Russians predominate, are such regions
today.
         3. The remaining regions of Crimea fall under the classification of regions of
substantially mixed populations. In some of these regions (northern, Kerch,
Yevpatoriia), there is a considerable Ukrainian component, while in the others the
Russian component is predominant.
         The proposed classification is, to a certain extent, conditional, especially with
regard to monoethnic regions, because in actuality such regions are practically
nonexistent today. Their emergence could be connected with the immigration of the
Crimean Tatars, and they are limited by an insignificant amount of territory (for
example, the rise of the Crimean Tatar towns near Simferopol). Regarding the two
other types, they have been generally biethnic – Russian and Ukrainian – for a long
time insofar as after the deportation in 1944, the position of the exiled nationalities
was not significant enough to influence the substance of interethnic relations. Today,
with the return of Crimean Tatars, Germans, Armenians, and other peoples, the
picture is changing. The third and fourth components of the ethnic mosaic of these
regions are growing larger.


3
  Boris Ekkels methodology is the basis for my typology. See A.I.Kliachyn, «Dinamika ethnicheskih system
rasselenia v Krymu» Ethnograficheskoe obozrenie, № 2 (1992) (A.I.Kliachyn, “The Dynamics of ethnic settling
systems in Crimea” Ethnograficheskoe obozrenie, № 2 (1992)).
The previous existence of two elements clearly defined by specific geographic
boundaries caused their isolationism and weakened the interethnic activity of their
representatives, which was intensive perhaps only in the border area between the
Russian and Crimean Tatar frameworks. The settlement of Crimean Tatars in
compact villages stimulated the emergence of closed ethnic systems, along with their
limited possibilities for direct interaction between their representatives and other
ethnic groups.
      Tendencies in Crimean Tatar Migration Processes
      The dynamics of ethnic systems of settling about a country and their migration
processes (generally among the deported Crimean groups) formed interesting ethnic
contact zones on the peninsula, which were different in content from previous ones.
First among these zones are the big cities: Simferopol, Sevastopol, Yevpatoriia,
Feodosiia, and Kerch.
      Since nearly 80 percent of the deported Crimean Tatars lived in cities, the cities
of Crimea are, for them, the desired places of settlement. Thus, in big cities, the
proportion of the Crimean Tatar population will, without a doubt, increase, which
will lead to the creation of ethnic contact zones where a significant role will be
played not by two ethnic groups (the Russians and the Ukrainians), but by three
(where the third is the Crimean Tatars). Some Crimean Tatars are returning to the
steppes and parts of the mountain regions, particularly to those places where Crimean
Tatar settlements emerged in the postwar years. Another tendency in Crimean Tatars'
migration processes is connected with their desire to explore those regions where,
prior to their deportation, there was no Crimean Tatar population. The first of these
are the regions of Old Crimea. Old Crimea is denned by its geographic location,
which is as near to Simferopol as it is to the tourist area. As a result of this migration
structure of the Crimean Tatars, three groups of ethnic contact zones have emerged
where the Crimean Tatar element plays a significant role:
      1. Big cities with triethnic structures, where the Russian ethnic component is
the strongest.
      2. Central and northern regions, where the Ukrainian component is fairly
perceptible.
3. Simferopol, Bakhchysarai, Bilohirsk, and Kirov regions (based on
sociological polling data, nearly half of the Crimean Tatars who are returning desire
to live in these very regions), where the Crimean Tatar ethnic element has always had
a strong base and, according to my prognosis, will be strengthening.

           Other Factors in Analyzing the Intensity of Interethnic Relations
           In analyzing the intensity of interethnic relations in Crimea, aside from the
dynamics of ethnic systems of settlement, we must consider three additional essential
factors:
           1. The ethnocultural distance between groups that interact
           2. The ethnopolitical revival in Ukraine
           3. The ethnic revival among the groups inhabiting the Crimean peninsula
           We understand "ethnocultural distance" in terms of kinship or so-called
common features; a distancing in ethnic origin, culture, customs, and traditions; and,
finally, the mentality of the groups, whose representatives live in permanent contact.
At first glance, ethnocultural distance appears to be a barrier to interethnic relations
between Slavic and Muslim groups. There is too large an ethnocultural distancing
between Russians and Crimean Tatars and between Crimean Tatars and Ukrainians,
but it is comparatively small between Russians and Ukrainians and among Crimean
Tatars, Krymchaks, and Karaites. In keeping with the conditions of a significant
ethnocultural distancing under the interethnic-relations paradigm, at the base of
which is Peter Rose's "they and we" concept4 conflict can easily develop in unstable
economic and political conditions. From this point of view, interethnic relations in
Crimea can be considered as potentially conflictual. In this context, conflict has
several stages, and it is not necessary to associate it with the use of force. (Recent
events in the former Yugoslavia, Georgia, and Tajikistan lead to such narrow
interpretations          of    ethnic      conflict.)     In    our     case,     we      are    dealing      with
ethnopsychological factors, among which ethnocultural distancing plays a decisive
role, in the formation of ethnic stereotypes, which are fairly often negative.
Understanding the essence of these stereotypes and the regularity of their actions
allows for the "neutralization" of the negative aspects of the appearance of
4
    Peter Isaac Rose, They and We: Racial and Ethnic Relations in the United States (New York: Random House, 1964).
ethnocultural distancing, especially as a result of cultivating a tolerant attitude and
appreciation of other people and alien cultures.
      Incidentally, familiarity with the ethnic history of Crimea and its territory,
where both Russian and Ukrainian ethnoses have settled, attests to the fact that
ethnocultural distancing between opposite cultures has been diminishing as a result of
the interaction of these ethnoses with Tatars, beginning from early times. That is why
today, in Russian as well as Ukrainian cultures, one can uncover the Tatar adstratum
(elements of Tatar culture or modifications under Ukrainian or Russian spheres of
influence). Up until the present, this interactivity has shown itself in other ways,
when, from time to time, it has taken on a forceful character (Tatar conquests of other
territories, the Soviet regime's deportation of the Crimean Tatars, and the suppression
by force of the natural aspirations of the Crimean Tatars for historical justice).
      Another significant factor which currently plays a very important role is the
ethnopolitical revival in Ukraine, which is connected with the construction of an
independent state. The Ukrainians, with the exception of Ukrainians in Crimea, are
the driving force of this revival. However, the processes of national revival in
Ukraine are having a significant effect on the revival of the ethnic self-awareness of
the Ukrainians who live in Crimea. Signs of this revival include the creation and
activities of Ukrainian ethnic organizations, from the Ukrainian Citizens Congress of
Crimea to branches of the National Rukh Movement of Ukraine, Prosvita, the
Ukrainian Republican Party, and the Ukrainian National Assembly. All these
organizations favor the "Ukrainization" of the peninsula. Ukrainization is the process
of winning a deserving place for Ukrainian ethnicity in Crimea and liberating it from
the consequences of the all-encompassing Russification policies of the former Soviet
Union. There are indications that this movement will have adherents, judging by the
relatively high number of native Ukrainian speakers among Ukrainians living in
Crimea in 1989 (Table 4). However, the Ukrainian sense of ethnicity on the peninsula
today is strengthening too slowly, because the Soviet empire's Russification policy
had a very favorable environment in Crimea, where the majority of the population
was Russian. The integration of Crimea into me Ukrainian ethnic fold remains, for
now, a matter for the insignificant number of patriotically inspired public and
political organizations (a few of which are mentioned above), as very few Ukrainian
state organs are concerned about it. And this, to a great extent, impedes progress
toward the realization of the natural aspirations of the once Russified Ukrainians to
return to their ethnic roots and to create appropriate conditions for them to satisfy
their needs (linguistic, cultural, and political) connected with their ethnic origin.
Despite these conditions, however, one can say that the ethnopolitical revival in
Ukraine is playing a positive role in the formation of Ukrainian ethnicity in Crimea,
and this will have certain consequences for interethnic relations on the peninsula,
particularly as they will be seen in the role and in the place of Ukrainians, Russians,
Crimean Tatars, and other groups in these relations.


Table 4

Composition of Crimea’s major populations by language in 1989

Group        Total N     N of individuals who consider Percentage       of     individuals   who
                         their native language to be:     consider their native language to be:
                         Language       Ukrainian Russian Language of Ukrainian Russian
                                                          to be:
                         of     their                     their
                         nationality                      nationality

Russian      1,629,542   1,626,821      1,220     -       99.9          0.1         -
Ukrainian    625,919     328,897        -         296,491 52.6          –           47.4
Belarusian   50,054      17,282         269       32,428 34.5           0.5         64.8
Crimean      38,365      35,806         43        1,071 93.3            0.1         2.8
Jewish
Tatar        17,731      1,080          41        16,551 6.1            0.2         93.3
Tatar        10,762      7,482          7         3,224 69.5            0.1         30.0
Moldovan     6,609       3,670          76        2,837 55.5            1.2         42.9
Polish       6,157       605            1,296     4,129 9.8             21.0        67.1
Chuvash      4,621       2,161          5         2,432 46.8            0.1         52.6
Mordvin      4,582       1,713          3         2,853 37.4            0.1         62.3
Armenian     2,794       1,792          2         987     64.2          0.1         35.3
Greek        2,684       597            4         2,051 22.3            0.2         76.4
Korean       2,423       942            3         1,467 38.9            0.1         606
Azerbaijani   2,415       1,887       9         495     78.1            0.4        20.5
German        2,356       523         17        1,809 22.2              0.7        76.8
Bulgarian     2,186       598         24        1,551 27.4              1.1        71.0
Man           1,906       934                   964     49.0                       50.6
Georgian      1,780       823         5         925     462             0.3        52.0
Total         2,430,495   2,041,126   3,155     381,778 84.0            0.2        15.7


      Source: Ministerstvo Statystyky Ukrainy, Natsional'nyi sklad naselennia
Ukrainy, Chastyna II (Kyiv, 1992), 196, 254. (Ministry of Statistics of Ukraine,
National composition of Ukraine, Part II (Kyiv, 1992), 196, 254).
      Before reaching a conclusion about trends in interethnic relations in Crimea, it
is worth mentioning something about the ethnic revival taking place among other
minorities who live in this region. Today, a process of their constitutionalization as
sturdy structural elements of Crimean society has begun. This was inspired by the
ethnopolitical revival in Ukraine and the proclamation by that independent state of
the principles of equal rights for all ethnic groups, as well as the provision of the
possibility to freely choose one's own ethnic identity and the realization of aspirations
for ethnic self-organization. Ethnic self-organization, particularly, was confirmed in
the Law On National Minorities in Ukraine, which was written and ratified by the
Parliament of Ukraine in 1992. The return to Crimea of once deported representatives
of non-Russian and non-Ukrainian ethnoses strengthens certain ethnicities and
stimulates their ethnic self-organizational processes. This is apparent in the creation
of ethnic organizations for Karaites, Krymchaks, Armenians, and Bulgarians, in the
organization of courses to learn their ethnic languages, in their striving to sustain
their traditions and ethnic customs, and in the preservation of the elements of their
cultures through art.

      The Resultant Impact
      Processes of returning a significant part of the population of Crimea to its
ethnicity, which are connected with the ethnopolitical revival in Ukraine in general
and which are found among some of the ethnic groups in the peninsula, will, without
a doubt, appear in the quantitative correlation among ethnic groups. Today, one can
already foresee that the number of people identifying themselves as Russian will be
diminishing, even though they will remain Russian speaking, and, instead, Crimean
Tatar, Ukrainian, and other ethnic groups will be increasing in number. In the first
case, this is the direct impact of the migratory processes – the return of the deported
Crimean Tatars and their descendants to their homeland or to the lands of their
forefathers. It is predicted that by the year 2000, their number will grow to 400,000,
because the Crimean Tatars currently living on the territory of the former Soviet
Union will return to Crimea. According to the Mejlis of the Crimean Tatar people, in
Crimea the number of Crimean Tatars should be equal to the number of Russians.
This, of course, can be attained when the descendants of the Crimean Tatars who
presently live in Turkey also begin to move to Crimea.5 In the second case, an
increase in the number of ethnic groups will occur as a result of the return to their
ethnic roots by representatives who live in Crimea as well as those who are returning
from their places of deportation. Regarding the Ukrainians, their potential, as noted
above, depends on the processes of de-Russification – in other words, the liberation
from the Russifying influences which played a role for decades.
        The end result of all these factors, of course, will be changes in the dynamics
of the interethnic relations on the peninsula. If the axiom that Russians determined
the character of interethnic relations in Crimea was incontrovertible up until recently,
then today, and particularly looking forward, we can make the assumption that their
dominant role will be diminishing. In a parallel sense, the role of Crimean Tatars will
grow visibly, and the role of Ukrainians may gradually become more influential. The
expressed assumption is based not only on the changes in the quantitative correlation
of the principal ethnic groups; it also takes into account the spheres of influence of all
ethnic groups (in addition to a variety of political and economic factors), which to a
great extent depend on the levels of internal self-organization of the groups – that is,
on the effectiveness of constitutional completeness.6 The latter means the presence of
ethnic organizations, the press, churches, art associations, and other indicators of
ethnic identification and generators of appropriate ethnicity among groups of ethnic
organizations. United on this basis, groups will have stronger spheres of ethnic

5
6
 R.Breton, “Institutional completeness of Ethnic Communities and the Personal Relations of Immigrants”, American
Journal of Sociology 70, № 2 (1964).
influence, which, if not subdued by the absolute influences of other groups, will at
least be able to resist being swallowed up by other, more numerous (let us say,
Russian) groups. From this point of view, Crimean Tatars have the best prospects,
and Russians have the weakest. The prospects for Ukrainians are somewhere in the
middle.

       The Crimean Tatars
       The clearest constitutional completeness can be found in Crimean Tatars:
       they have their own strong ethnic organizations, press, art associations,
schools, and religious organizations, in addition to which Islam is becoming a strong
unifying element. On the basis of all this, a sturdy ethnic self-awareness among
Crimean Tatars is forming. Historical experience (deportation, dispersal all over the
world, discrimination) is an additional factor which spurs Crimean Tatars to support a
high level of self-organization. Moreover, they need to depend on themselves due to
their current economic difficulties in realizing their plans to return to their homeland.
When one considers the fact that Crimean Tatars do not have an ethnic territory other
than Crimea where the core of their ethnos could exist, uniting them in Crimea has a
decisive significance for the prospects of their survival as a nation. Thus, the effect of
a sphere of influence focused on keeping the ethnos whole is not contradictory, and it
creates a base for political goals, such as the possibility of gaining national or
territorial self-rule.

       The Russians
       Regarding the Russians, there is practically an absence of an ethnic base (an
organizational base) on which they could unite as an ethnic group with their own
distinctive features. The Russian population of Crimea is motivated by political
processes. Settling political problems – such as recognizing Sevastopol as a Russian
city or making demands that Crimea be returned to Russia (a demand probably
without any prospects) – pulls Russians away from their self-organization as a group
which functions under polyethnic conditions. At present, the ethnic self-awareness of
the Russians is also marginalized as a consequence of their ethnic interaction with
Ukrainians, Crimean Tatars, and representatives of other groups. Based on level and
content, the ethnic self-awareness of the Russians of Crimea differs from that of the
Russians from the Volga Region or even the Central Chernozem Region insofar as
the surrounding ethnic environment with which they are in constant contact differs
from one to the other. The marginalization of Russian ethnic awareness is
demonstrated by the fact that at certain important political moments, Russians have
declared their support for the nation-building process (substant) in Ukraine This
occurred during their participation in the referendum supporting Ukraine's
independence in 1991 and in Ukraine's presidential elections in July 1994
(14,017,684, or 52.14 percent, voted in favor; 12,756,277, or 47.45 percent, voted
against). Incidentally, this is an important moment in evaluating Crimea's interethnic
relations, because it is a good starting point from which to construct peaceful
relations on the peninsula. Neither the politicians in Crimea nor those in the rest of
Ukraine, however, have taken advantage of this favorable situation for constructing
peaceful relations. In the context of this statement, the results of the opinion poll on
autonomy among the population of Crimea which was taken by Crimea's Center for
Humanitarian Research were interesting. Only 17 percent were in favor of
maintaining Crimea's autonomy, 32 percent believed that they could get by without it,
and another 21 percent could not decide; the remaining 30 percent were indifferent.7

          Determinants of the Dynamics of Interethnic Relations


          The dynamics of interethnic relations in Crimea can be defined by the
following criteria:
          The unusually diverse ethnic composition of the population
          The ethnopolitical revival in Ukraine
          The ethnic revival of the minorities
          The resettlement processes of Crimean Tatars, Armenians, Bulgarians, and
Germans
          The status of Ukrainian-Russian relations


7
    Vseukrainskie Vedomosti, № 146 (1994), 1
Based on these determinants, today's interethnic relations in Crimea can be
evaluated as being close to tense, and they stimulate disintegrating tendencies in the
development of the peninsula's society.


      Is There Potential for Tension?


      A certain tension, at this point only potential, may be caused in particular by
the resettlement processes and by the unpreparedness of the Crimean leaders (who, in
this, are like Ukrainian leaders) for the integration of the newly arrived people into
the economic, political, and cultural framework that exists today in Crimea. First, this
refers to the peninsula's economic infrastructure, which cannot painlessly incorporate
the Crimean Tatars. Strictly speaking, the niches of active economic life are
practically filled by people who lived there before the process of returning the
deported peoples began. In the history of the world's multiethnic countries, we find
abundant evidence that the competition for prestigious or simply valuable niches in
the economic, political, and cultural spheres of life, due to certain social conditions,
turns into antagonism and very often into ethnic conflict. Let us say that efforts by
Crimean Tatars to resolve their problems by using forceful methods in places of new
settlement (during 1992 and 1993), particularly their own willful buildup around
several cities (including Simferopol and Alushta), necessitated responsible forceful
action on the part of local administrators. In addition, chauvinistic circles have been
using this situation to spread negative ethnic stereotyping of Crimean Tatars. The
leaders of the Crimean Tatar National Movement have recently begun directing their
activity toward more productive channels and avoiding skirmishes with city officials
and groups which oppose the return of the Crimean Tatars. There are tendencies in
the Crimean Tatar National Movement toward cooperation with the Ukrainian
National Movement, with the democratic forces of the Russian majority, and with
representatives of other groups on the peninsula. Certain positive shifts have
occurred, and in the political sphere, especially during the last Crimean parliamentary
elections in 1993, Crimean Tatars received 15 percent of the votes, even though they
represent only 10 percent of the electorate on the peninsula. It is true that the
conditions that can easily create ethnic antagonism – such as competition for jobs in
the labor market (according to Edna Bonacich, this is the main cause of ethnic
antagonism in a multiethnic society),8 lack of housing, and refusal by the authorities
to allow Crimean Tatars to settle where they wish – remain today.

          Conclusion
          A conclusion about the connection of the status of interethnic relations with
disintegrative tendencies in the social development of Crimea leads not only to
certain resistance – not necessarily clearly demonstrated by Russian and Crimean
Tatar, Ukrainian and Russian groups – but also, to a certain extent, to the dynamics of
ethnic processes of settlement. It is about a certain isolationism of some
representatives of various groups, one from another, and the retarded functioning of
ethnic contact zones, especially in places of settlement of Crimean Tatars after their
return from deportation. Add to this the support given to the ethnic stereotyping of
Crimean Tatars as traitors during the Second World War by extremists in the Russian
national movement and the labeling of the Ukrainians as nationalists, using the
negative connotation of this term, and the result is that it stimulates the above-
mentioned isolationism.
          To overcome certain isolationism in the peninsula's interethnic relations and to
prevent confrontational tendencies from developing, the following preventive
measures should be considered:
          1. The creation in the cities of Crimea of multicultural centers where history,
culture, customs, and traditions of various ethnic groups can be showcased, with the
dissemination of information about these ethnic groups to the general population
through mass media and cultural means (this type of measure has shown positive
results in multiethnic Canada).
          2. The creation of a special permanent workshop where experts in the field of
ethnonational problems could teach employees from the state apparatus, the social

8
    Edna Bonacich, "A Theory of Ethnic Antagonism: The Split Labor Market", American Sociological Review 37, № 5
(1972).
sphere, the cultural sphere, and education the methods used in working with
representatives from ethnic groups, for example, skills to regulate conflicts that
appear to be ethnically related.
        3. The introduction (of course, with an explanation in advance to the majority
ethnic group of the necessity of such a program) of "positive action" (based on the
American model of "affirmative action," but not identical in content).9 This would, on
one hand, stimulate the participation of the once deported Crimean Tatars and
representatives of other ethnic groups in the social life of Crimea and, on the other,
demonstrate the willingness of the administration and the politically active part of the
Russian majority to cooperate and coexist peacefully in the political environment.
The willingness very often is lacking, and this results in the inability of the Crimean
infrastructure to integrate those who are returning to Crimea after being deported for
many years and in the strengthening of the Russian idea (such as "Sevastopol is
Russia's glory" or "Crimea is Russian land") among radically oriented groups as the
dominant, categorical, and obligatory one for acceptance by other ethnic groups.
        4. Use of Ukrainian diplomatic efforts for constructive cooperation with other
countries, especially those that, in one form or another, have had to deal with issues
of resettling deported people and with the fate of Russian, Crimean Tatar, and other
ethnic groups of the peninsula (such as Russia, Turkey, and the former republics of
the Soviet Union, where deported people lived) and, more importantly, for preserving
security and peace in the Black Sea region.


9
 Volodymyr Yevtukh, Kontseptsi'i etnosotsial'noho razvitiya SShA i Kanady: typolohiia, tradytsii, evoliutsiia (Kyiv:
Naukova dumka, 1991), 102-125. (Volodymyr Yevtukh, The Conceptions of USA and Canada ethnosocial
development: typology, traditions, evolution (Kyiv: Naukova dumka, 1991), 102-125.).

More Related Content

Similar to The dynamics of interethnic relations in crimea

January-May 2015 - Export Statistics of Turkish Citrus
January-May 2015 - Export Statistics of Turkish CitrusJanuary-May 2015 - Export Statistics of Turkish Citrus
January-May 2015 - Export Statistics of Turkish CitrusTurkish Citrus Promotion Group
 
Ukraine.combating discrimination
Ukraine.combating discrimination Ukraine.combating discrimination
Ukraine.combating discrimination Gabriel BREZOIU
 
產業圈 20160131-quarterly global stock indexes review
產業圈   20160131-quarterly global stock indexes review產業圈   20160131-quarterly global stock indexes review
產業圈 20160131-quarterly global stock indexes reviewYing wei (Joe) Chou
 
Table 1 demographics and economic indicators
Table 1  demographics and economic indicatorsTable 1  demographics and economic indicators
Table 1 demographics and economic indicatorsBread for the World
 
Ukraine.combating discrimination
Ukraine.combating discrimination Ukraine.combating discrimination
Ukraine.combating discrimination Gabriel BREZOIU
 
January - April 2016 - Export Statistics of Turkish Citrus
January - April 2016 - Export Statistics of Turkish CitrusJanuary - April 2016 - Export Statistics of Turkish Citrus
January - April 2016 - Export Statistics of Turkish CitrusTurkish Citrus Promotion Group
 
January - September 2016 - Export Statistics of Turkish Citrus
January - September 2016 - Export Statistics of Turkish CitrusJanuary - September 2016 - Export Statistics of Turkish Citrus
January - September 2016 - Export Statistics of Turkish CitrusTurkish Citrus Promotion Group
 
January - March 2015 - Export Statistics of Turkish Citrus
January - March 2015 - Export Statistics of Turkish CitrusJanuary - March 2015 - Export Statistics of Turkish Citrus
January - March 2015 - Export Statistics of Turkish CitrusTurkish Citrus Promotion Group
 
Weight & thickness
Weight & thicknessWeight & thickness
Weight & thicknesspoonmaram
 
Bengkel pasaran perabot & produk kayu di antarabangsa 29 july2008-melaka
Bengkel pasaran perabot & produk kayu di antarabangsa 29 july2008-melakaBengkel pasaran perabot & produk kayu di antarabangsa 29 july2008-melaka
Bengkel pasaran perabot & produk kayu di antarabangsa 29 july2008-melakaZaini Ithnin
 
Bengkel pasaran perabot & produk kayu di antarabangsa 29 july2008-melaka
Bengkel pasaran perabot & produk kayu di antarabangsa 29 july2008-melakaBengkel pasaran perabot & produk kayu di antarabangsa 29 july2008-melaka
Bengkel pasaran perabot & produk kayu di antarabangsa 29 july2008-melakaClean Agent Sdn Bhd
 
Bengkel pasaran perabot & produk kayu di antarabangsa 29 july2008-melaka
Bengkel pasaran perabot & produk kayu di antarabangsa 29 july2008-melakaBengkel pasaran perabot & produk kayu di antarabangsa 29 july2008-melaka
Bengkel pasaran perabot & produk kayu di antarabangsa 29 july2008-melakaNusantaraPlantations SdnBhd
 
January - February 2016 - Export Statistics of Turkish Citrus
January - February 2016 - Export Statistics of Turkish CitrusJanuary - February 2016 - Export Statistics of Turkish Citrus
January - February 2016 - Export Statistics of Turkish CitrusTurkish Citrus Promotion Group
 
January - October 2015 - Export Statistics of Turkish Citrus
January - October 2015 - Export Statistics of Turkish CitrusJanuary - October 2015 - Export Statistics of Turkish Citrus
January - October 2015 - Export Statistics of Turkish CitrusTurkish Citrus Promotion Group
 

Similar to The dynamics of interethnic relations in crimea (20)

January-May 2015 - Export Statistics of Turkish Citrus
January-May 2015 - Export Statistics of Turkish CitrusJanuary-May 2015 - Export Statistics of Turkish Citrus
January-May 2015 - Export Statistics of Turkish Citrus
 
Human Movement 2009: Snapshots and Trends
Human Movement 2009: Snapshots and TrendsHuman Movement 2009: Snapshots and Trends
Human Movement 2009: Snapshots and Trends
 
Ukraine.combating discrimination
Ukraine.combating discrimination Ukraine.combating discrimination
Ukraine.combating discrimination
 
產業圈 20160131-quarterly global stock indexes review
產業圈   20160131-quarterly global stock indexes review產業圈   20160131-quarterly global stock indexes review
產業圈 20160131-quarterly global stock indexes review
 
Table 1 demographics and economic indicators
Table 1  demographics and economic indicatorsTable 1  demographics and economic indicators
Table 1 demographics and economic indicators
 
Ukraine.combating discrimination
Ukraine.combating discrimination Ukraine.combating discrimination
Ukraine.combating discrimination
 
Ukraine.pereklad
Ukraine.pereklad Ukraine.pereklad
Ukraine.pereklad
 
January - April 2016 - Export Statistics of Turkish Citrus
January - April 2016 - Export Statistics of Turkish CitrusJanuary - April 2016 - Export Statistics of Turkish Citrus
January - April 2016 - Export Statistics of Turkish Citrus
 
October 2016 - Export Statistics of Turkish Citrus
October 2016 - Export Statistics of Turkish CitrusOctober 2016 - Export Statistics of Turkish Citrus
October 2016 - Export Statistics of Turkish Citrus
 
January - September 2016 - Export Statistics of Turkish Citrus
January - September 2016 - Export Statistics of Turkish CitrusJanuary - September 2016 - Export Statistics of Turkish Citrus
January - September 2016 - Export Statistics of Turkish Citrus
 
January - March 2015 - Export Statistics of Turkish Citrus
January - March 2015 - Export Statistics of Turkish CitrusJanuary - March 2015 - Export Statistics of Turkish Citrus
January - March 2015 - Export Statistics of Turkish Citrus
 
Weight & thickness
Weight & thicknessWeight & thickness
Weight & thickness
 
Bengkel pasaran perabot & produk kayu di antarabangsa 29 july2008-melaka
Bengkel pasaran perabot & produk kayu di antarabangsa 29 july2008-melakaBengkel pasaran perabot & produk kayu di antarabangsa 29 july2008-melaka
Bengkel pasaran perabot & produk kayu di antarabangsa 29 july2008-melaka
 
Bengkel pasaran perabot & produk kayu di antarabangsa 29 july2008-melaka
Bengkel pasaran perabot & produk kayu di antarabangsa 29 july2008-melakaBengkel pasaran perabot & produk kayu di antarabangsa 29 july2008-melaka
Bengkel pasaran perabot & produk kayu di antarabangsa 29 july2008-melaka
 
Bengkel pasaran perabot & produk kayu di antarabangsa 29 july2008-melaka
Bengkel pasaran perabot & produk kayu di antarabangsa 29 july2008-melakaBengkel pasaran perabot & produk kayu di antarabangsa 29 july2008-melaka
Bengkel pasaran perabot & produk kayu di antarabangsa 29 july2008-melaka
 
January - February 2016 - Export Statistics of Turkish Citrus
January - February 2016 - Export Statistics of Turkish CitrusJanuary - February 2016 - Export Statistics of Turkish Citrus
January - February 2016 - Export Statistics of Turkish Citrus
 
October 2015 - Export Statistics of Turkish Citrus
October 2015 - Export Statistics of Turkish CitrusOctober 2015 - Export Statistics of Turkish Citrus
October 2015 - Export Statistics of Turkish Citrus
 
January - October 2015 - Export Statistics of Turkish Citrus
January - October 2015 - Export Statistics of Turkish CitrusJanuary - October 2015 - Export Statistics of Turkish Citrus
January - October 2015 - Export Statistics of Turkish Citrus
 
GOLD
GOLDGOLD
GOLD
 
February 2016 - Export Statistics of Turkish Citrus
February 2016 - Export Statistics of Turkish CitrusFebruary 2016 - Export Statistics of Turkish Citrus
February 2016 - Export Statistics of Turkish Citrus
 

More from yevtukh

Kotliarchuk Andrei: V Kuznitse Stalina Shvedskie Kolonisty Ukrainy v Totalita...
Kotliarchuk Andrei: V Kuznitse Stalina Shvedskie Kolonisty Ukrainy v Totalita...Kotliarchuk Andrei: V Kuznitse Stalina Shvedskie Kolonisty Ukrainy v Totalita...
Kotliarchuk Andrei: V Kuznitse Stalina Shvedskie Kolonisty Ukrainy v Totalita...yevtukh
 
Russkiye in Ukraine: Myth Versus Realities or Vice Versa
Russkiye in Ukraine: Myth Versus Realities or Vice VersaRusskiye in Ukraine: Myth Versus Realities or Vice Versa
Russkiye in Ukraine: Myth Versus Realities or Vice Versayevtukh
 
New ethnicities – New problems. Immigrants in Ukrainian Social Space
New ethnicities – New problems. Immigrants in Ukrainian Social SpaceNew ethnicities – New problems. Immigrants in Ukrainian Social Space
New ethnicities – New problems. Immigrants in Ukrainian Social Spaceyevtukh
 
Ethnic Problems on Ukrainian Space: Actuality and Regulations
Ethnic Problems on Ukrainian Space: Actuality and RegulationsEthnic Problems on Ukrainian Space: Actuality and Regulations
Ethnic Problems on Ukrainian Space: Actuality and Regulationsyevtukh
 
Volodymyr Yevtukh Presentation ASN 2013
Volodymyr Yevtukh Presentation ASN 2013Volodymyr Yevtukh Presentation ASN 2013
Volodymyr Yevtukh Presentation ASN 2013yevtukh
 
Ethnicity: Ukrainian Perspectives
Ethnicity: Ukrainian PerspectivesEthnicity: Ukrainian Perspectives
Ethnicity: Ukrainian Perspectivesyevtukh
 
Володимир Євтух Етнічність: енциклопедичний довідник 2012
Володимир Євтух Етнічність: енциклопедичний довідник 2012Володимир Євтух Етнічність: енциклопедичний довідник 2012
Володимир Євтух Етнічність: енциклопедичний довідник 2012yevtukh
 
Volodymyr Yevtukh's Selected Works
Volodymyr Yevtukh's Selected WorksVolodymyr Yevtukh's Selected Works
Volodymyr Yevtukh's Selected Worksyevtukh
 
Volodymyr Yevtukh. Orange Bewegung in der Ukraine
Volodymyr Yevtukh. Orange Bewegung in der UkraineVolodymyr Yevtukh. Orange Bewegung in der Ukraine
Volodymyr Yevtukh. Orange Bewegung in der Ukraineyevtukh
 
Intercultural Dialogue: Efficient Construct of the Integrative Development of...
Intercultural Dialogue: Efficient Construct of the Integrative Development of...Intercultural Dialogue: Efficient Construct of the Integrative Development of...
Intercultural Dialogue: Efficient Construct of the Integrative Development of...yevtukh
 
Володимир Євтух у інформаційно-комунікаційному просторі: наукові та політик...
Володимир  Євтух у інформаційно-комунікаційному просторі:  наукові та політик...Володимир  Євтух у інформаційно-комунікаційному просторі:  наукові та політик...
Володимир Євтух у інформаційно-комунікаційному просторі: наукові та політик...yevtukh
 
The role of government and ngo
The role of government and ngoThe role of government and ngo
The role of government and ngoyevtukh
 
Prospects of ukraines cooperation with european and transatlantic structures ...
Prospects of ukraines cooperation with european and transatlantic structures ...Prospects of ukraines cooperation with european and transatlantic structures ...
Prospects of ukraines cooperation with european and transatlantic structures ...yevtukh
 
National minorities in ukraine
National minorities in ukraineNational minorities in ukraine
National minorities in ukraineyevtukh
 
Koreans in ethnicnational population structure of ukraine
Koreans in ethnicnational population structure of ukraineKoreans in ethnicnational population structure of ukraine
Koreans in ethnicnational population structure of ukraineyevtukh
 
Ethnic mobilities in ukraine
Ethnic mobilities in ukraineEthnic mobilities in ukraine
Ethnic mobilities in ukraineyevtukh
 
Contemporary migrations in the ukraine
Contemporary migrations in the ukraineContemporary migrations in the ukraine
Contemporary migrations in the ukraineyevtukh
 
Програма перебування професора Володимира Євтуха у Франкфурті на Майні(ФРН)
Програма перебування професора Володимира Євтуха у Франкфурті на Майні(ФРН)Програма перебування професора Володимира Євтуха у Франкфурті на Майні(ФРН)
Програма перебування професора Володимира Євтуха у Франкфурті на Майні(ФРН)yevtukh
 
III Session of Volodymyr Yevtukh Ethnosociological School
III Session of Volodymyr Yevtukh Ethnosociological SchoolIII Session of Volodymyr Yevtukh Ethnosociological School
III Session of Volodymyr Yevtukh Ethnosociological Schoolyevtukh
 
Human Values in Intercultural Space Conference Program Jagiellonian universit...
Human Values in Intercultural Space Conference Program Jagiellonian universit...Human Values in Intercultural Space Conference Program Jagiellonian universit...
Human Values in Intercultural Space Conference Program Jagiellonian universit...yevtukh
 

More from yevtukh (20)

Kotliarchuk Andrei: V Kuznitse Stalina Shvedskie Kolonisty Ukrainy v Totalita...
Kotliarchuk Andrei: V Kuznitse Stalina Shvedskie Kolonisty Ukrainy v Totalita...Kotliarchuk Andrei: V Kuznitse Stalina Shvedskie Kolonisty Ukrainy v Totalita...
Kotliarchuk Andrei: V Kuznitse Stalina Shvedskie Kolonisty Ukrainy v Totalita...
 
Russkiye in Ukraine: Myth Versus Realities or Vice Versa
Russkiye in Ukraine: Myth Versus Realities or Vice VersaRusskiye in Ukraine: Myth Versus Realities or Vice Versa
Russkiye in Ukraine: Myth Versus Realities or Vice Versa
 
New ethnicities – New problems. Immigrants in Ukrainian Social Space
New ethnicities – New problems. Immigrants in Ukrainian Social SpaceNew ethnicities – New problems. Immigrants in Ukrainian Social Space
New ethnicities – New problems. Immigrants in Ukrainian Social Space
 
Ethnic Problems on Ukrainian Space: Actuality and Regulations
Ethnic Problems on Ukrainian Space: Actuality and RegulationsEthnic Problems on Ukrainian Space: Actuality and Regulations
Ethnic Problems on Ukrainian Space: Actuality and Regulations
 
Volodymyr Yevtukh Presentation ASN 2013
Volodymyr Yevtukh Presentation ASN 2013Volodymyr Yevtukh Presentation ASN 2013
Volodymyr Yevtukh Presentation ASN 2013
 
Ethnicity: Ukrainian Perspectives
Ethnicity: Ukrainian PerspectivesEthnicity: Ukrainian Perspectives
Ethnicity: Ukrainian Perspectives
 
Володимир Євтух Етнічність: енциклопедичний довідник 2012
Володимир Євтух Етнічність: енциклопедичний довідник 2012Володимир Євтух Етнічність: енциклопедичний довідник 2012
Володимир Євтух Етнічність: енциклопедичний довідник 2012
 
Volodymyr Yevtukh's Selected Works
Volodymyr Yevtukh's Selected WorksVolodymyr Yevtukh's Selected Works
Volodymyr Yevtukh's Selected Works
 
Volodymyr Yevtukh. Orange Bewegung in der Ukraine
Volodymyr Yevtukh. Orange Bewegung in der UkraineVolodymyr Yevtukh. Orange Bewegung in der Ukraine
Volodymyr Yevtukh. Orange Bewegung in der Ukraine
 
Intercultural Dialogue: Efficient Construct of the Integrative Development of...
Intercultural Dialogue: Efficient Construct of the Integrative Development of...Intercultural Dialogue: Efficient Construct of the Integrative Development of...
Intercultural Dialogue: Efficient Construct of the Integrative Development of...
 
Володимир Євтух у інформаційно-комунікаційному просторі: наукові та політик...
Володимир  Євтух у інформаційно-комунікаційному просторі:  наукові та політик...Володимир  Євтух у інформаційно-комунікаційному просторі:  наукові та політик...
Володимир Євтух у інформаційно-комунікаційному просторі: наукові та політик...
 
The role of government and ngo
The role of government and ngoThe role of government and ngo
The role of government and ngo
 
Prospects of ukraines cooperation with european and transatlantic structures ...
Prospects of ukraines cooperation with european and transatlantic structures ...Prospects of ukraines cooperation with european and transatlantic structures ...
Prospects of ukraines cooperation with european and transatlantic structures ...
 
National minorities in ukraine
National minorities in ukraineNational minorities in ukraine
National minorities in ukraine
 
Koreans in ethnicnational population structure of ukraine
Koreans in ethnicnational population structure of ukraineKoreans in ethnicnational population structure of ukraine
Koreans in ethnicnational population structure of ukraine
 
Ethnic mobilities in ukraine
Ethnic mobilities in ukraineEthnic mobilities in ukraine
Ethnic mobilities in ukraine
 
Contemporary migrations in the ukraine
Contemporary migrations in the ukraineContemporary migrations in the ukraine
Contemporary migrations in the ukraine
 
Програма перебування професора Володимира Євтуха у Франкфурті на Майні(ФРН)
Програма перебування професора Володимира Євтуха у Франкфурті на Майні(ФРН)Програма перебування професора Володимира Євтуха у Франкфурті на Майні(ФРН)
Програма перебування професора Володимира Євтуха у Франкфурті на Майні(ФРН)
 
III Session of Volodymyr Yevtukh Ethnosociological School
III Session of Volodymyr Yevtukh Ethnosociological SchoolIII Session of Volodymyr Yevtukh Ethnosociological School
III Session of Volodymyr Yevtukh Ethnosociological School
 
Human Values in Intercultural Space Conference Program Jagiellonian universit...
Human Values in Intercultural Space Conference Program Jagiellonian universit...Human Values in Intercultural Space Conference Program Jagiellonian universit...
Human Values in Intercultural Space Conference Program Jagiellonian universit...
 

The dynamics of interethnic relations in crimea

  • 1. THE DYNAMICS OF INTERETHNIC RELATIONS IN CRIMEA* This chapter is based on an ethnological and ethnosociological analysis of the tendencies, phenomena, and events which had and which continue to have a place in the social life of the Crimean peninsula. In it I focus on the interactions of the ethnic groups that determine the character and essence of the contemporary ethnopolitical situation in Crimea: Russian, Crimean Tatar, and Ukrainian. I also attempt to determine the place and role of other ethnic groups in today's interethnic relations (these I classify as the “fourth force”). A real and somewhat objective picture of the interethnic relations in Crimea can be re-created only when the following factors are taken into account: the character of the formation of the population's ethnic composition, the dynamics of ethnic systems of settlement in Crimea, the contemporary migratory processes, the process of the constitutionalization of ethnic groups, and the structure of interactions among the largest ethnic groups. The Ethnic Diversity of Crimea Citizens residing in Ukraine come from many different ethnic backgrounds (Table 1). Today, Crimea is one of Ukraine's most ethnically diverse regions, with ap- proximately one hundred ethnic groups. The six most populous among them, accord- ing to the latest census figures (1989), are Russians, Ukrainians, Belarusians, Crimean Tatars, Jews, and Tatars (Table 2). The population of Crimean Tatars has risen substantially – to 240,000 – since the last census was taken, and they already constitute nearly 10 percent of the population of Crimea. Table 1 * Reprinted with permission from Crimea. Dynamics, Challenges, and Prospects, ed. By Maria Drohobycky (American Association for the Advancement of Science. Rowman & Littlefield Publishers, INC Copyright 1995), pp. 69-85.
  • 2. Ethnic composition of the population in Ukraine in 1970, 1979, and 1989 Group N Percentage of total Percentage increase population (decrease) to 1989 1970 1979 1989 1970 1979 1989 1970 1989 Ukrainian 35.283.857 36.488.951 37.419.053 74 73.6 72.7 6.1 2.5 Russian 9.126.331 11.471.602 11.355.582 19.4 21.1 22.1 24.4 8.4 Table 1 - continued Group N Percentage of total Percentage population increase (decrease) to 1989 1970 1979 1989 1970 1979 1989 1970 1979 Jewish 775,993 632,610 486,326 1.6 1.3 0.9 (37.3) (23.1) Belarusian 385,847 406,098 440,045 0.8 0.8 0.9 14.0 8,4 Moldovan 265,902 293,576 324,525 0.6 0.6 0.6 22.0 10.5 Bulgarian 234,390 238,217 233,800 0.5 0.5 0.5 (0.3 (1.9) Polish 295,107 258,309 219,179 0.6 0.5 0.4 (25.7) (15.1) Hungarian 157,731 164,373 163,111 0.3 0.3 0.3 3.4 (0.8) Romanian 112,141 121,795 134,825 0.2 0.2 0.3 20.2 10.7 Greek 106,909 104,091 98,594 0.2 0.2 0.2 (7.8) (5.3) Tatar 72,658 83,906 86,875 0.15 0.2 0.2 19.6 3.5 Armenian 33,439 38,646 54,200 0.07 0.08 0.1 62.1 40.2 Roma 30,091 34,411 47,917 0.06 0.07 0.09 59.2 39.2 Crimean 3,554 6,636 46,807 0.01 0.01 0.09 1,217.0 605.3 Tatar German 29,871 34,139 37,849 0.06 0.07 0.07 26.7 10.9 Azerbaijani 10,769 17,235 36,961 0.02 0.03 0.07 243.2 114.5 Gagauz 26,464 29,398 31,967 0.06 0.06 0.06 20.8 8.7
  • 3. Georgian 14,650 16,301 23,540 0.03 0.03 0.05 60.7 44.4 Chuvash 13,610 16,456 20,395 0.03 003 0.04 49.9 23.9 Uzbek 10,563 9,862 20,333 0.02 0.02 0.04 92.5 106.2 Mordvin 14,692 16,545 19,332 0.03 0.03 0.04 31.6 16.8 Lithuanian 10,715 9,658 11,278 0.02 0.02 0.02 5.3 16.8 Kazakh 7,555 7,171 10,505 0.02 0.01 0.02 39.0 46.5 Czech 12,073 10,589 9,122 0.03 0.02 0.02 (24.4) (13.9) Udmurt 4,910 6,562 8,583 0.01 0.01 0.02 74.8 30.8 Slovak 10,204 8,744 7,943 0.02 0.02 0.02 (22.2) (9.2) Bashkir 3,672 5,367 7,402 0.01 0.01 00.01 101.6 37.9 Mari 4,243 5,229 7,368 0.01 0.01 0.01 73.7 40.9 Latvian 7,421 7,167 7,142 0.02 0.01 0.01 (3.8) (0.3) Ossetian 4,554 5,257 6,345 0.01 0.01 0.01 39.3 20.7 Lezgian 1,708 2,354 4,810 0.0 0.0 0.01 181.6 104.3 Tajik 2,473 2,415 4,447 0.01 0.0 0.01 79.8 84.1 Estonian 4,571 4,111 4,208 0.01 0.01 0.01 (7.9) 2.4 Komi 2,827 3,071 3,959 0.01 0.01 0.01 40.0 28.9 Turkmen 1,045 1,696 3,399 0.0 0.0 0.01 225.3 100.4 Albanian 3,972 3,874 3,343 0.01 0.01 0.01 (15.8) (13.7) Assyrian 2,765 2,991 2,759 0.01 0.01 0.01 (0.2) (7.8) Avar 893 1,211 2,677 0.0 0.0 0.01 199.8 121.1 Kyrgyz 1.576 2,370 2,297 0.0 0.0 0.0 45.7 (3.1) Karelian 1,901 1,981 2,276 0.0 0.0 0.0 19.7 14.9 Komi- 893 1,979 2,146 0.0 0.0 0.0 140.3 8.4 Permiak Chechen 939 1,046 1,844 0.0 0.0 0.0 96.4 76.3
  • 4. Table 1 – continued Group N Percentage of Percentage total population increase (decrease) to 1989 1970 1979 1989 197 197 198 1970 1979 0 9 9 Darghin 634 595 1,550 0.0 0.0 0.0 144.5 160.5 Karaite 2,596 1.845 1,404 0.01 0.0 0.0 (45.9 (23.9 ) ) Arab 796 1,352 1,240 0.0 0.0 0.0 55.8 (8.3) Finn 1,154 1,082 1,086 0.0 0.0 0.0 (5.9) 0.4 Lak 574 662 1,035 0.0 0.0 0.0 80.3 56.3 Abkhazia 476 941 990 0.0 0.0 0.0 108.0 5.2 n Kabardian 554 673 959 0.0 0.0 0.0 73.1 42.5 Tabasaran 118 300 932 0.0 0.0 0.0 690.0 210.7 Other 19,656 17,822 19,100 0.04 0.04 0.04 (2.8) 7.2 Total 47,126,51 49,609,23 51,452,03 100 100 100 9.2 3.7 populatio 7 3 4 n Source: Ministerstvo Statystyky Ukrainy, Natsional'nyi sklad naselennia Ukrainy, Chastyna I (Kyiv, 1991), 4-5. (Ministry of Statistics of Ukraine, National composition of Ukraine, Part I (Kyiv, 1991), 4-5). Table 2
  • 5. Most populous nationality groups of Crimea in 1989 Group N Percentage Percentage Male Employed Urban of total population Russian 1,629,542 67.0 46.6 50.6 74.4 Ukrainian 625,919 25.8 45.7 57.4 59.7 Belarusian 50,054 2.1 45.4 62.7 63.2 Crimean 38,365 1.6 51.6 35.8 23.4 Tatar Jewish 17,731 0.7 46.2 52.4 95.6 Tatar 10,762 0.4 50.6 49.1 53.5 Moldovan 6,609 0.3 55.8 64.0 64.6 Polish 6,157 0.3 41.8 61.9 58.5 Chuvash 4,621 0.2 44.2 68.8 59.2 Mordvin 4,582 0.2 45.3 65.6 52.0 Armenian 2,794 0.1 56.5 44.8 47.4 Greek 2,684 0.1 46.4 47.9 67.8 Korean 2,423 0.1 51.6 50.3 63.4 Azerbaijani 2,415 0.1 62.2 41.1 46.5 German 2,356 0.1 43.4 59.2 48.5 Bulgarian 2,186 0.1 48.0 63.5 73.9 Mari 1,906 0.1 41.2 67.2 41.4 Georgian 1,780 0.1 65.1 53.5 77.7 Total 2,430,495 100 46.5 52.5 69.3 population Source: Ministerstvo Statystyky Ukrainy, Natsional'nyi sklad naselennia Ukrainy, Chastyna II (Kyiv, 1992), 4-5. (Ministry of Statistics of Ukraine, National composition of Ukraine, Part II (Kyiv, 1992), 4-5).
  • 6. Migratory Processes The contemporary ethnic composition of the population of Crimea is the result of various causes, both objective and subjective, with the most important being migratory processes. One can assert that the current population of Crimea was formed as a result of both early and late migrations. It is worth remembering that the peninsula long remained under the continuous influence of two colonizing waves, one from the north and the other from the south. From an ethnic point of view, today's population can be divided into two major groups: (1) the much older ("old") and, to a certain extent, native and (2) the more recent ("arrived"). The first group includes the Tatars, Roma (Gypsies), Krymchaks, Karaites, and a small group of Armenians and Greeks who stayed behind on the peninsula after being exiled to the Mariupol region by Catherine the Great. Based on the 1926 census, the old group accounted for nearly 27 percent (190,000) of the entire population of Crimea. The arrived group consisted of migrants from the north and the west (Russians, Ukrainians, Jews, Germans, Poles, Czechs, and Ests) and settlers from the south (Greeks, Armenians, and Bulgarians). The quantitative correlation among the different ethnic groups of Crimea changed constantly. Until the end of the eighteenth century, the Crimean Tatars were the largest ethnic group based on size. The process of formation of me Crimean Tatar people had been completed in the sixteenth century1. After Crimea's annexation by Russia in 1873, Crimea was intensively colonized by the Russians and less intensively by the Ukrainians, Germans, Bulgarians, Jews, Armenians, Greeks, and other ethnic groups. Based on figures from me first census ever taken in the Russian Empire, in 1897, Russians and Ukrainians constituted 45.3 percent of the population and the Crimean Tatars, 34.1 percent (Table 3). After World War II, this correlation changed radically. Based on the 1989 census, Russians constituted 67 percent of the 1 V.Vozgrin, “Pravo na povernennia: Etnogenez i derzhavnist’ kryms’ kykh tatar“, Holos Ukrainy, №105 (1994); 12 (V.Vozgrin, “The right for comeback: Ethnogenesis and Krimean Tatars stateness”, Holos Ukrainy, №105 (1994); 12)
  • 7. population; Ukrainians, 25.8 percent; Crimean Tatars, 1.6 percent; and all others, 5.6 percent (Table 3). Over the past few years, this correlation has continued to change. Table 3 Major populations of Crimea Group N 1897 1921 1939 1979 1989 Russian 558,481 1,460,980 1,629,542 274,724 370,888 (49.6) (68.4) (67.0) Ukrainians (45.3) (51.5) 154,123 547,336 625,919 (13,7) (25.6) (25,8) Crimean 186,212 184,568 218,879 5,422 38,365 Tatars (34.1) (25.9) (19.4) (0.3) (1.6) Source: Naselenie Krymskoi oblasti po dannym perepisei (Simferopol, 1989), 7-10. (The population of Krimean region according to census data (Simferopol, 1989), 7- 10)). Dynamics of Ethnic Settlement In the context of changes in the quantitative correlation among the different ethnic groups, it is worthwhile to emphasize the dynamics of ethnic settlement in Crimea. Under the influence of the two colonizing waves mentioned above, two main frameworks in the settlement of ethnic groups were formed: the northern region, where the Russians were in the majority, and the southern region, which was populated mainly by Crimean Tatars. The third structural element was forming until the beginning of World War II. This was the Ukrainian element, mostly found in the steppes of the Kerch region (20 percent of its population) and the Yevpatoriia region (21.5 percent of its population). Even before the war, there was a displacement in the northern (Russian) structural element. The Russians permeated the southern part of
  • 8. the peninsula, weakening the foundation of the Crimean Tatar structural element. After World War II, significant changes occurred in the quantitative correlation as well as in the internal structure of Crimea's ethnic groups. First, there was a virtually total replacement of the Russian and Ukrainian prerevolutionary populations. After the war, a great mass of people living in the oblasts of central Russia, ruined during the war, were resettled in Crimea, and after 1954 (the year that Crimea was transferred to Ukraine), the migration of Ukrainians to the peninsula intensified, especially from the regions of western Ukraine, where there was a labor surplus. Incidentally, in the earliest censuses (until 1939), Ukrainians were grouped with the Russians (Table 4.3). (This explains why it is not easy to determine the size of the Ukrainian population from earlier periods.) Based on a book published in Berlin in 1918, Ukrainians constituted 42 percent of the 1,880,000 people living on the territory of Tavria, the major part of which was Crimea2. Second, the deportation in 1944 of the Crimean Tatars, Germans, Armenians, Bulgarians, and several other nationalities meant that their representation as members of the population of the peninsula declined sharply. As a result, the Crimean Tatar component virtually disappeared from the ethnic structure of Crimea. Third, the return of the deported Crimean Tatars, which intensified in the late 1980s and early 1990s, changed to some extent the quantitative correlation among the three basic ethnic groups on the peninsula. Their return, substantially strengthened the peninsula's Crimean Tatar component. Strengthening the structural element is connected with the migration processes on the peninsula itself, including that of the Crimean Tatars. This has led to a recent change in the dynamics of the ethnic settlement system, which brings about certain peculiarities in interethnic relations. Incidentally, based on ethnological laws, systems of settlement of ethnic groups play a significant role in the formation of the character and essence of interethnic relations. 2 Heinrich Lanz, Ukraina (Berlin: Georg Stilke, 1918), 10.
  • 9. Regional Formation Looking at the present-day settlements of Crimea's ethnic groups, we can define three types of regions, placing at the base of our structure the level of ethnic diversity or the level of the population mix of various ethnic origins:3 1. Monoethnic regions are places where one type of group is predominant (and very visible). Incidentally, if until the deportation of the Crimean Tatars it was characteristic for them to live in this type of region (for example, Bakhchysarai and Sudak), today the only places that can be referred to as such regions are separate locations with Russian populations (for example, Sevastopol and Yalta). 2. Regions of "mixed diversity" are places where one of the ethnic groups is dominant, but it constitutes less than two-thirds of die population. Simferopol and a part of the central region of Crimea, where Russians predominate, are such regions today. 3. The remaining regions of Crimea fall under the classification of regions of substantially mixed populations. In some of these regions (northern, Kerch, Yevpatoriia), there is a considerable Ukrainian component, while in the others the Russian component is predominant. The proposed classification is, to a certain extent, conditional, especially with regard to monoethnic regions, because in actuality such regions are practically nonexistent today. Their emergence could be connected with the immigration of the Crimean Tatars, and they are limited by an insignificant amount of territory (for example, the rise of the Crimean Tatar towns near Simferopol). Regarding the two other types, they have been generally biethnic – Russian and Ukrainian – for a long time insofar as after the deportation in 1944, the position of the exiled nationalities was not significant enough to influence the substance of interethnic relations. Today, with the return of Crimean Tatars, Germans, Armenians, and other peoples, the picture is changing. The third and fourth components of the ethnic mosaic of these regions are growing larger. 3 Boris Ekkels methodology is the basis for my typology. See A.I.Kliachyn, «Dinamika ethnicheskih system rasselenia v Krymu» Ethnograficheskoe obozrenie, № 2 (1992) (A.I.Kliachyn, “The Dynamics of ethnic settling systems in Crimea” Ethnograficheskoe obozrenie, № 2 (1992)).
  • 10. The previous existence of two elements clearly defined by specific geographic boundaries caused their isolationism and weakened the interethnic activity of their representatives, which was intensive perhaps only in the border area between the Russian and Crimean Tatar frameworks. The settlement of Crimean Tatars in compact villages stimulated the emergence of closed ethnic systems, along with their limited possibilities for direct interaction between their representatives and other ethnic groups. Tendencies in Crimean Tatar Migration Processes The dynamics of ethnic systems of settling about a country and their migration processes (generally among the deported Crimean groups) formed interesting ethnic contact zones on the peninsula, which were different in content from previous ones. First among these zones are the big cities: Simferopol, Sevastopol, Yevpatoriia, Feodosiia, and Kerch. Since nearly 80 percent of the deported Crimean Tatars lived in cities, the cities of Crimea are, for them, the desired places of settlement. Thus, in big cities, the proportion of the Crimean Tatar population will, without a doubt, increase, which will lead to the creation of ethnic contact zones where a significant role will be played not by two ethnic groups (the Russians and the Ukrainians), but by three (where the third is the Crimean Tatars). Some Crimean Tatars are returning to the steppes and parts of the mountain regions, particularly to those places where Crimean Tatar settlements emerged in the postwar years. Another tendency in Crimean Tatars' migration processes is connected with their desire to explore those regions where, prior to their deportation, there was no Crimean Tatar population. The first of these are the regions of Old Crimea. Old Crimea is denned by its geographic location, which is as near to Simferopol as it is to the tourist area. As a result of this migration structure of the Crimean Tatars, three groups of ethnic contact zones have emerged where the Crimean Tatar element plays a significant role: 1. Big cities with triethnic structures, where the Russian ethnic component is the strongest. 2. Central and northern regions, where the Ukrainian component is fairly perceptible.
  • 11. 3. Simferopol, Bakhchysarai, Bilohirsk, and Kirov regions (based on sociological polling data, nearly half of the Crimean Tatars who are returning desire to live in these very regions), where the Crimean Tatar ethnic element has always had a strong base and, according to my prognosis, will be strengthening. Other Factors in Analyzing the Intensity of Interethnic Relations In analyzing the intensity of interethnic relations in Crimea, aside from the dynamics of ethnic systems of settlement, we must consider three additional essential factors: 1. The ethnocultural distance between groups that interact 2. The ethnopolitical revival in Ukraine 3. The ethnic revival among the groups inhabiting the Crimean peninsula We understand "ethnocultural distance" in terms of kinship or so-called common features; a distancing in ethnic origin, culture, customs, and traditions; and, finally, the mentality of the groups, whose representatives live in permanent contact. At first glance, ethnocultural distance appears to be a barrier to interethnic relations between Slavic and Muslim groups. There is too large an ethnocultural distancing between Russians and Crimean Tatars and between Crimean Tatars and Ukrainians, but it is comparatively small between Russians and Ukrainians and among Crimean Tatars, Krymchaks, and Karaites. In keeping with the conditions of a significant ethnocultural distancing under the interethnic-relations paradigm, at the base of which is Peter Rose's "they and we" concept4 conflict can easily develop in unstable economic and political conditions. From this point of view, interethnic relations in Crimea can be considered as potentially conflictual. In this context, conflict has several stages, and it is not necessary to associate it with the use of force. (Recent events in the former Yugoslavia, Georgia, and Tajikistan lead to such narrow interpretations of ethnic conflict.) In our case, we are dealing with ethnopsychological factors, among which ethnocultural distancing plays a decisive role, in the formation of ethnic stereotypes, which are fairly often negative. Understanding the essence of these stereotypes and the regularity of their actions allows for the "neutralization" of the negative aspects of the appearance of 4 Peter Isaac Rose, They and We: Racial and Ethnic Relations in the United States (New York: Random House, 1964).
  • 12. ethnocultural distancing, especially as a result of cultivating a tolerant attitude and appreciation of other people and alien cultures. Incidentally, familiarity with the ethnic history of Crimea and its territory, where both Russian and Ukrainian ethnoses have settled, attests to the fact that ethnocultural distancing between opposite cultures has been diminishing as a result of the interaction of these ethnoses with Tatars, beginning from early times. That is why today, in Russian as well as Ukrainian cultures, one can uncover the Tatar adstratum (elements of Tatar culture or modifications under Ukrainian or Russian spheres of influence). Up until the present, this interactivity has shown itself in other ways, when, from time to time, it has taken on a forceful character (Tatar conquests of other territories, the Soviet regime's deportation of the Crimean Tatars, and the suppression by force of the natural aspirations of the Crimean Tatars for historical justice). Another significant factor which currently plays a very important role is the ethnopolitical revival in Ukraine, which is connected with the construction of an independent state. The Ukrainians, with the exception of Ukrainians in Crimea, are the driving force of this revival. However, the processes of national revival in Ukraine are having a significant effect on the revival of the ethnic self-awareness of the Ukrainians who live in Crimea. Signs of this revival include the creation and activities of Ukrainian ethnic organizations, from the Ukrainian Citizens Congress of Crimea to branches of the National Rukh Movement of Ukraine, Prosvita, the Ukrainian Republican Party, and the Ukrainian National Assembly. All these organizations favor the "Ukrainization" of the peninsula. Ukrainization is the process of winning a deserving place for Ukrainian ethnicity in Crimea and liberating it from the consequences of the all-encompassing Russification policies of the former Soviet Union. There are indications that this movement will have adherents, judging by the relatively high number of native Ukrainian speakers among Ukrainians living in Crimea in 1989 (Table 4). However, the Ukrainian sense of ethnicity on the peninsula today is strengthening too slowly, because the Soviet empire's Russification policy had a very favorable environment in Crimea, where the majority of the population was Russian. The integration of Crimea into me Ukrainian ethnic fold remains, for now, a matter for the insignificant number of patriotically inspired public and
  • 13. political organizations (a few of which are mentioned above), as very few Ukrainian state organs are concerned about it. And this, to a great extent, impedes progress toward the realization of the natural aspirations of the once Russified Ukrainians to return to their ethnic roots and to create appropriate conditions for them to satisfy their needs (linguistic, cultural, and political) connected with their ethnic origin. Despite these conditions, however, one can say that the ethnopolitical revival in Ukraine is playing a positive role in the formation of Ukrainian ethnicity in Crimea, and this will have certain consequences for interethnic relations on the peninsula, particularly as they will be seen in the role and in the place of Ukrainians, Russians, Crimean Tatars, and other groups in these relations. Table 4 Composition of Crimea’s major populations by language in 1989 Group Total N N of individuals who consider Percentage of individuals who their native language to be: consider their native language to be: Language Ukrainian Russian Language of Ukrainian Russian to be: of their their nationality nationality Russian 1,629,542 1,626,821 1,220 - 99.9 0.1 - Ukrainian 625,919 328,897 - 296,491 52.6 – 47.4 Belarusian 50,054 17,282 269 32,428 34.5 0.5 64.8 Crimean 38,365 35,806 43 1,071 93.3 0.1 2.8 Jewish Tatar 17,731 1,080 41 16,551 6.1 0.2 93.3 Tatar 10,762 7,482 7 3,224 69.5 0.1 30.0 Moldovan 6,609 3,670 76 2,837 55.5 1.2 42.9 Polish 6,157 605 1,296 4,129 9.8 21.0 67.1 Chuvash 4,621 2,161 5 2,432 46.8 0.1 52.6 Mordvin 4,582 1,713 3 2,853 37.4 0.1 62.3 Armenian 2,794 1,792 2 987 64.2 0.1 35.3 Greek 2,684 597 4 2,051 22.3 0.2 76.4 Korean 2,423 942 3 1,467 38.9 0.1 606
  • 14. Azerbaijani 2,415 1,887 9 495 78.1 0.4 20.5 German 2,356 523 17 1,809 22.2 0.7 76.8 Bulgarian 2,186 598 24 1,551 27.4 1.1 71.0 Man 1,906 934 964 49.0 50.6 Georgian 1,780 823 5 925 462 0.3 52.0 Total 2,430,495 2,041,126 3,155 381,778 84.0 0.2 15.7 Source: Ministerstvo Statystyky Ukrainy, Natsional'nyi sklad naselennia Ukrainy, Chastyna II (Kyiv, 1992), 196, 254. (Ministry of Statistics of Ukraine, National composition of Ukraine, Part II (Kyiv, 1992), 196, 254). Before reaching a conclusion about trends in interethnic relations in Crimea, it is worth mentioning something about the ethnic revival taking place among other minorities who live in this region. Today, a process of their constitutionalization as sturdy structural elements of Crimean society has begun. This was inspired by the ethnopolitical revival in Ukraine and the proclamation by that independent state of the principles of equal rights for all ethnic groups, as well as the provision of the possibility to freely choose one's own ethnic identity and the realization of aspirations for ethnic self-organization. Ethnic self-organization, particularly, was confirmed in the Law On National Minorities in Ukraine, which was written and ratified by the Parliament of Ukraine in 1992. The return to Crimea of once deported representatives of non-Russian and non-Ukrainian ethnoses strengthens certain ethnicities and stimulates their ethnic self-organizational processes. This is apparent in the creation of ethnic organizations for Karaites, Krymchaks, Armenians, and Bulgarians, in the organization of courses to learn their ethnic languages, in their striving to sustain their traditions and ethnic customs, and in the preservation of the elements of their cultures through art. The Resultant Impact Processes of returning a significant part of the population of Crimea to its ethnicity, which are connected with the ethnopolitical revival in Ukraine in general and which are found among some of the ethnic groups in the peninsula, will, without a doubt, appear in the quantitative correlation among ethnic groups. Today, one can already foresee that the number of people identifying themselves as Russian will be
  • 15. diminishing, even though they will remain Russian speaking, and, instead, Crimean Tatar, Ukrainian, and other ethnic groups will be increasing in number. In the first case, this is the direct impact of the migratory processes – the return of the deported Crimean Tatars and their descendants to their homeland or to the lands of their forefathers. It is predicted that by the year 2000, their number will grow to 400,000, because the Crimean Tatars currently living on the territory of the former Soviet Union will return to Crimea. According to the Mejlis of the Crimean Tatar people, in Crimea the number of Crimean Tatars should be equal to the number of Russians. This, of course, can be attained when the descendants of the Crimean Tatars who presently live in Turkey also begin to move to Crimea.5 In the second case, an increase in the number of ethnic groups will occur as a result of the return to their ethnic roots by representatives who live in Crimea as well as those who are returning from their places of deportation. Regarding the Ukrainians, their potential, as noted above, depends on the processes of de-Russification – in other words, the liberation from the Russifying influences which played a role for decades. The end result of all these factors, of course, will be changes in the dynamics of the interethnic relations on the peninsula. If the axiom that Russians determined the character of interethnic relations in Crimea was incontrovertible up until recently, then today, and particularly looking forward, we can make the assumption that their dominant role will be diminishing. In a parallel sense, the role of Crimean Tatars will grow visibly, and the role of Ukrainians may gradually become more influential. The expressed assumption is based not only on the changes in the quantitative correlation of the principal ethnic groups; it also takes into account the spheres of influence of all ethnic groups (in addition to a variety of political and economic factors), which to a great extent depend on the levels of internal self-organization of the groups – that is, on the effectiveness of constitutional completeness.6 The latter means the presence of ethnic organizations, the press, churches, art associations, and other indicators of ethnic identification and generators of appropriate ethnicity among groups of ethnic organizations. United on this basis, groups will have stronger spheres of ethnic 5 6 R.Breton, “Institutional completeness of Ethnic Communities and the Personal Relations of Immigrants”, American Journal of Sociology 70, № 2 (1964).
  • 16. influence, which, if not subdued by the absolute influences of other groups, will at least be able to resist being swallowed up by other, more numerous (let us say, Russian) groups. From this point of view, Crimean Tatars have the best prospects, and Russians have the weakest. The prospects for Ukrainians are somewhere in the middle. The Crimean Tatars The clearest constitutional completeness can be found in Crimean Tatars: they have their own strong ethnic organizations, press, art associations, schools, and religious organizations, in addition to which Islam is becoming a strong unifying element. On the basis of all this, a sturdy ethnic self-awareness among Crimean Tatars is forming. Historical experience (deportation, dispersal all over the world, discrimination) is an additional factor which spurs Crimean Tatars to support a high level of self-organization. Moreover, they need to depend on themselves due to their current economic difficulties in realizing their plans to return to their homeland. When one considers the fact that Crimean Tatars do not have an ethnic territory other than Crimea where the core of their ethnos could exist, uniting them in Crimea has a decisive significance for the prospects of their survival as a nation. Thus, the effect of a sphere of influence focused on keeping the ethnos whole is not contradictory, and it creates a base for political goals, such as the possibility of gaining national or territorial self-rule. The Russians Regarding the Russians, there is practically an absence of an ethnic base (an organizational base) on which they could unite as an ethnic group with their own distinctive features. The Russian population of Crimea is motivated by political processes. Settling political problems – such as recognizing Sevastopol as a Russian city or making demands that Crimea be returned to Russia (a demand probably without any prospects) – pulls Russians away from their self-organization as a group which functions under polyethnic conditions. At present, the ethnic self-awareness of the Russians is also marginalized as a consequence of their ethnic interaction with Ukrainians, Crimean Tatars, and representatives of other groups. Based on level and
  • 17. content, the ethnic self-awareness of the Russians of Crimea differs from that of the Russians from the Volga Region or even the Central Chernozem Region insofar as the surrounding ethnic environment with which they are in constant contact differs from one to the other. The marginalization of Russian ethnic awareness is demonstrated by the fact that at certain important political moments, Russians have declared their support for the nation-building process (substant) in Ukraine This occurred during their participation in the referendum supporting Ukraine's independence in 1991 and in Ukraine's presidential elections in July 1994 (14,017,684, or 52.14 percent, voted in favor; 12,756,277, or 47.45 percent, voted against). Incidentally, this is an important moment in evaluating Crimea's interethnic relations, because it is a good starting point from which to construct peaceful relations on the peninsula. Neither the politicians in Crimea nor those in the rest of Ukraine, however, have taken advantage of this favorable situation for constructing peaceful relations. In the context of this statement, the results of the opinion poll on autonomy among the population of Crimea which was taken by Crimea's Center for Humanitarian Research were interesting. Only 17 percent were in favor of maintaining Crimea's autonomy, 32 percent believed that they could get by without it, and another 21 percent could not decide; the remaining 30 percent were indifferent.7 Determinants of the Dynamics of Interethnic Relations The dynamics of interethnic relations in Crimea can be defined by the following criteria: The unusually diverse ethnic composition of the population The ethnopolitical revival in Ukraine The ethnic revival of the minorities The resettlement processes of Crimean Tatars, Armenians, Bulgarians, and Germans The status of Ukrainian-Russian relations 7 Vseukrainskie Vedomosti, № 146 (1994), 1
  • 18. Based on these determinants, today's interethnic relations in Crimea can be evaluated as being close to tense, and they stimulate disintegrating tendencies in the development of the peninsula's society. Is There Potential for Tension? A certain tension, at this point only potential, may be caused in particular by the resettlement processes and by the unpreparedness of the Crimean leaders (who, in this, are like Ukrainian leaders) for the integration of the newly arrived people into the economic, political, and cultural framework that exists today in Crimea. First, this refers to the peninsula's economic infrastructure, which cannot painlessly incorporate the Crimean Tatars. Strictly speaking, the niches of active economic life are practically filled by people who lived there before the process of returning the deported peoples began. In the history of the world's multiethnic countries, we find abundant evidence that the competition for prestigious or simply valuable niches in the economic, political, and cultural spheres of life, due to certain social conditions, turns into antagonism and very often into ethnic conflict. Let us say that efforts by Crimean Tatars to resolve their problems by using forceful methods in places of new settlement (during 1992 and 1993), particularly their own willful buildup around several cities (including Simferopol and Alushta), necessitated responsible forceful action on the part of local administrators. In addition, chauvinistic circles have been using this situation to spread negative ethnic stereotyping of Crimean Tatars. The leaders of the Crimean Tatar National Movement have recently begun directing their activity toward more productive channels and avoiding skirmishes with city officials and groups which oppose the return of the Crimean Tatars. There are tendencies in the Crimean Tatar National Movement toward cooperation with the Ukrainian National Movement, with the democratic forces of the Russian majority, and with representatives of other groups on the peninsula. Certain positive shifts have occurred, and in the political sphere, especially during the last Crimean parliamentary elections in 1993, Crimean Tatars received 15 percent of the votes, even though they represent only 10 percent of the electorate on the peninsula. It is true that the
  • 19. conditions that can easily create ethnic antagonism – such as competition for jobs in the labor market (according to Edna Bonacich, this is the main cause of ethnic antagonism in a multiethnic society),8 lack of housing, and refusal by the authorities to allow Crimean Tatars to settle where they wish – remain today. Conclusion A conclusion about the connection of the status of interethnic relations with disintegrative tendencies in the social development of Crimea leads not only to certain resistance – not necessarily clearly demonstrated by Russian and Crimean Tatar, Ukrainian and Russian groups – but also, to a certain extent, to the dynamics of ethnic processes of settlement. It is about a certain isolationism of some representatives of various groups, one from another, and the retarded functioning of ethnic contact zones, especially in places of settlement of Crimean Tatars after their return from deportation. Add to this the support given to the ethnic stereotyping of Crimean Tatars as traitors during the Second World War by extremists in the Russian national movement and the labeling of the Ukrainians as nationalists, using the negative connotation of this term, and the result is that it stimulates the above- mentioned isolationism. To overcome certain isolationism in the peninsula's interethnic relations and to prevent confrontational tendencies from developing, the following preventive measures should be considered: 1. The creation in the cities of Crimea of multicultural centers where history, culture, customs, and traditions of various ethnic groups can be showcased, with the dissemination of information about these ethnic groups to the general population through mass media and cultural means (this type of measure has shown positive results in multiethnic Canada). 2. The creation of a special permanent workshop where experts in the field of ethnonational problems could teach employees from the state apparatus, the social 8 Edna Bonacich, "A Theory of Ethnic Antagonism: The Split Labor Market", American Sociological Review 37, № 5 (1972).
  • 20. sphere, the cultural sphere, and education the methods used in working with representatives from ethnic groups, for example, skills to regulate conflicts that appear to be ethnically related. 3. The introduction (of course, with an explanation in advance to the majority ethnic group of the necessity of such a program) of "positive action" (based on the American model of "affirmative action," but not identical in content).9 This would, on one hand, stimulate the participation of the once deported Crimean Tatars and representatives of other ethnic groups in the social life of Crimea and, on the other, demonstrate the willingness of the administration and the politically active part of the Russian majority to cooperate and coexist peacefully in the political environment. The willingness very often is lacking, and this results in the inability of the Crimean infrastructure to integrate those who are returning to Crimea after being deported for many years and in the strengthening of the Russian idea (such as "Sevastopol is Russia's glory" or "Crimea is Russian land") among radically oriented groups as the dominant, categorical, and obligatory one for acceptance by other ethnic groups. 4. Use of Ukrainian diplomatic efforts for constructive cooperation with other countries, especially those that, in one form or another, have had to deal with issues of resettling deported people and with the fate of Russian, Crimean Tatar, and other ethnic groups of the peninsula (such as Russia, Turkey, and the former republics of the Soviet Union, where deported people lived) and, more importantly, for preserving security and peace in the Black Sea region. 9 Volodymyr Yevtukh, Kontseptsi'i etnosotsial'noho razvitiya SShA i Kanady: typolohiia, tradytsii, evoliutsiia (Kyiv: Naukova dumka, 1991), 102-125. (Volodymyr Yevtukh, The Conceptions of USA and Canada ethnosocial development: typology, traditions, evolution (Kyiv: Naukova dumka, 1991), 102-125.).