Download as PDF, PPTX
![Good metrics
Are Actionable ] optimize
Can be Audted
Are Accessible ]! understand!
An actionable metric is one that ties!
specific and repeatable actions !
to observed results.!
—Ash Maurya!](https://image.slidesharecdn.com/thedata-drivenstartup-141118053043-conversion-gate01/85/The-data-driven-startup-16-320.jpg)

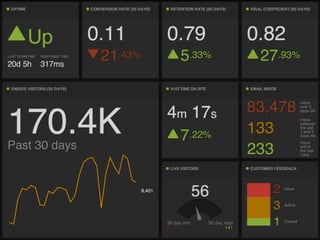
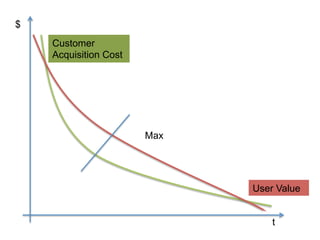

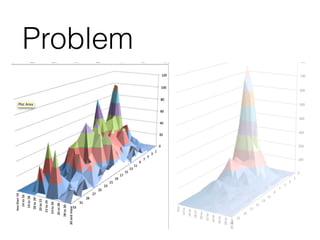
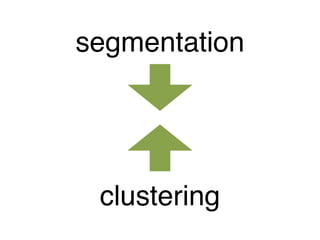

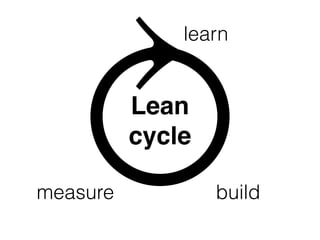
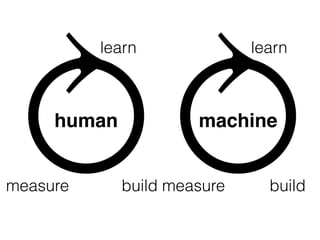

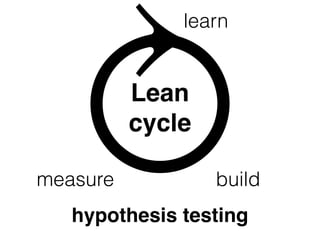
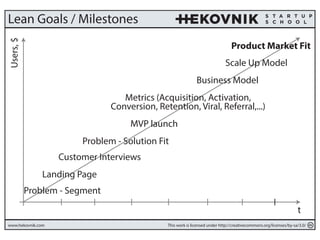
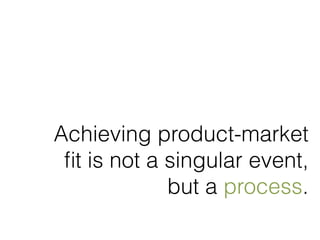
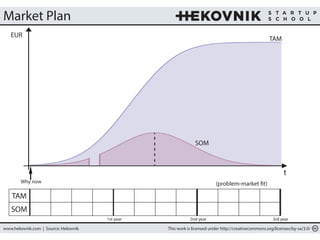
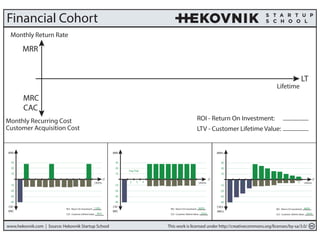
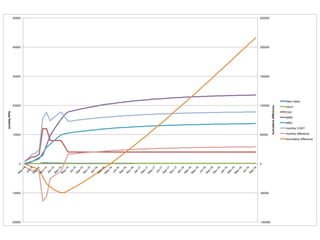
The document discusses lean startup methodology and achieving product-market fit. It emphasizes that product-market fit is a process, not a single event. It also stresses the importance of using data and metrics to guide decisions and measure progress towards product-market fit over time. Key metrics mentioned include customer acquisition cost, monthly recurring revenue, churn, and the financial impact of metrics.


![[DSC Europe 25] Paula Garcia Esteban -Building the Future: The Role of Data S...](https://cdn.slidesharecdn.com/ss_thumbnails/9ld1r1bsqpwve8qfvphy-paula-garcia-esteban-building-the-future-260122103838-4171f5cb-thumbnail.jpg?width=640&height=640&fit=bounds)

![[DSC Europe 25] Borko Kozomora - Optimizing business workflows with advances ...](https://cdn.slidesharecdn.com/ss_thumbnails/hbgekyb0txw0xpo4yfml-borko-kozomora-leading-ai-transformation-260122103838-cc29ee38-thumbnail.jpg?width=640&height=640&fit=bounds)


![[DSC Europe 25] Milos Belcevic - Product Professional's Journey to Full-Stack...](https://cdn.slidesharecdn.com/ss_thumbnails/1zovd6fgsycdg4wvgvls-milos-belcevic-product-professionals-journey-to-full-stack-product-developer-260123083019-d993120d-thumbnail.jpg?width=640&height=640&fit=bounds)


