Impact of Taxation on MSE Performance in Nedjo Town

The study is entitled the Assessment of taxation on performance of micro and small enterprise (MSE) in Nedjo town. The main objective of this study is to assess the taxation on performance of micro and small enterprise in the case of Nedjo town using descriptive research design. The total population of the study is 94 MSE firms running their business in Nedjo town. The study used stratified sampling procedures using the five sectors of the MSE firms as a stratum. In order to collect data, most MSE owners working in the position of manager and few MSE firm owner that work in the position accountants were contacted for data collection where MSE firms’ managers were not available at the time of data collection and data was analyzed by using statistical package for social science. The finding shows that age of respondents, tax system, tax rate, tax administration, tax level and tax education and training shows statistically significant positive impact on the performance of the MSE firms in correlation analysis. Also, the study found sex of respondents, age of respondents, educational status of respondents, tax system, tax administration, tax level and training shows a significant positive Assessment whereas tax compliance cost shows a significant negative Assessment on the performance of the MSE firms in regression analysis. Finally, the study recommended that tax administrators and tax policy makers are advised to improve existing tax system, tax rate, tax administration system, tax level, tax compliance costs as well as tax education and training so as to increase the performance of the MSE firms in the study area.

Recommended
Recommended
More Related Content
What's hot
What's hot (19)
Similar to Impact of Taxation on MSE Performance in Nedjo Town
Similar to Impact of Taxation on MSE Performance in Nedjo Town (20)
More from Premier Publishers
More from Premier Publishers (20)
Recently uploaded
Recently uploaded (20)
Impact of Taxation on MSE Performance in Nedjo Town
- 1. THE ASSESSMENT OF TAXATION ON PERFORMANCE OF MICRO AND SMALL ENTERPRISE IN THE CASE OF NEDJO TOWN, ETHIOPIA The ASSESSMENT of TAXATION on PERFORMANCE of MICRO and SMALL ENTERPRISE in the CASE of NEDJO TOWN, ETHIOPIA 1Abdeta Wakgari*, 2Admassu Tesso 1Oromia Special Zone around Finfinne Economist in construction Office, Ethiopia P.O Box. 31303 Finfinne, 2Wollega University, Department of Economics, Nekemte, Ethiopia P.O. Box. 395 Nekemte The study is entitled the Assessment of taxation on performance of micro and small enterprise (MSE) in Nedjo town. The main objective of this study is to assess the taxation on performance of micro and small enterprise in the case of Nedjo town using descriptive research design. The total population of the study is 94 MSE firms running their business in Nedjo town. The study used stratified sampling procedures using the five sectors of the MSE firms as a stratum. In order to collect data, most MSE owners working in the position of manager and few MSE firm owner that work in the position accountants were contacted for data collection where MSE firms’ managers were not available at the time of data collection and data was analyzed by using statistical package for social science. The finding shows that age of respondents, tax system, tax rate, tax administration, tax level and tax education and training shows statistically significant positive impact on the performance of the MSE firms in correlation analysis. Also, the study found sex of respondents, age of respondents, educational status of respondents, tax system, tax administration, tax level and training shows a significant positive Assessment whereas tax compliance cost shows a significant negative Assessment on the performance of the MSE firms in regression analysis. Finally, the study recommended that tax administrators and tax policy makers are advised to improve existing tax system, tax rate, tax administration system, tax level, tax compliance costs as well as tax education and training so as to increase the performance of the MSE firms in the study area. Keywords: impact, MSE, Nedjo, performance, taxation, INTRODUCTION In recent years, Micro and Small Enterprises (MSE) are widely recognized for the role they played in social, political and economic development of nations (Mbugua & Moronge, 2016; Tee, Boadi, & Opoku, 2016). The MSE business contribute significantly to the employment creations, innovation, uplifting of people’s standard of living and financial contribution to Gross Domestic Product (GDP) of the countries (Mwangi & Nganga, 2013). The MSEs are the engine that drives world economies and become the stepping stone to industrialization of developing and developed economies (Muriithi, 2017). The MSE sector is regarded as the driving forces that spur the economic growth and innovations (Radzi, Mohdnor, & Ali, 2017) and become the major instruments in poverty reduction, income generation, job creation and social progress (Mahadalle & Kaplan, 2017; Tee, Boadi, & Opoku, 2016; Kusi, Opata, & Narh, 2015) that enhances the sustainable economic growth of the nations (Mwangi & Nganga, 2013). Also, MSEs are important force for economic development and industrialization (Tee, Boadi, & Opoku, 2016). The role and importance of MSE sector has been widely recognized all over the world (Kithae, Maganjo, & Kavinda, 2013). The MSE sector represent more than 95 percent of all firms (Mbugua & Moronge, 2016) and become the most prolific sources of employment as well as the breeding ground for industrialization of medium and large industries (Kithae, Maganjo, & Kavinda, 2013). *Corresponding Author: Abdeta Wakgariromia Special Zone around Finfinne Economist in construction Office, Ethiopia P.O Box. 31303 Finfinne, E-mail: abdetawakgarig@gmail.com, Co-Author Email: kerajterfa@gmail.com Research Article Vol. 6(2), pp. 166-194, October, 2020. © www.premierpublishers.org. ISSN: 3012-8103 World Journal of Economics and Finance
- 2. THE ASSESSMENT OF TAXATION ON PERFORMANCE OF MICRO AND SMALL ENTERPRISE IN THE CASE OF NEDJO TOWN, ETHIOPIA Abdeta & Admassu. 167 The MSEs account for a large proportion of total employment and contribute significantly to national and global economic growth (OECD, 2015). Moreover, elements of human capital like education and training are other key factors in the achievements of organizational objectives to perform effectively (Mbugua & Moronge, 2016). The demographic characteristic of the MSE owner such as education, age gender, and others plays a vital role in the success of the business and enhances performance of MSE firms (Radzi, Mohdnor, & Ali, 2017; Sajilan, Tehseen, & Adeyinka, 2016). Empirically, the study by (Sarwoko, Armanu, & Hadiwidjojo, 2013) revealed that the characteristics of the MSE owners significantly impact performance of MSE firms. Thus, this study tried to assess the impact of taxation on performance of MSE firms in the case of Nedjo town found in west Wollega Zone. Statement of the Problem Despite the MSE businesses are essential in their contribution to employment creation, economic growth, innovation, and generating of significant share of all taxable business income, they are often facing challenges to their viability and growth for various reasons (OECD, 2015). Many of the MSE firm faces challenges of lack of capital, poor management skills, lack of competencies and corruption (Muriithi, 2017). Also, high tax rates, tax administration, corruption, informality, access to finance and electricity are among the top constraints of doing MSE business (IFC, WB, & DFID, 2009). High tax rate and corrupted tax administration has a negative impact on the business’ ability to sustain and to expand their operation (Atawodi & Ojeka, 2012). Existing literature shows that there are various factors that affect the performance of the MSE business. For instance, the study by (Adebisi & Gbegi, 2013) found that MSE firms are faced with the problem of high tax rates, multiple taxation, complex tax regulations and lack of proper enlightenment or education about tax related issues that consume large chunk of their revenues generated and hinder their growth and survival. Also, the study by (Mwangi & Nganga, 2013) found significant positive correlation between taxation and lack of MSE growth in which the impact of taxes on sales, stock, capital, investment, profitability and employment was varying in the level of influence on the performance and growth of the MSE sector. Similarly, the study by (Kusi, Opata, & Narh, 2015) found performance of the MSE in Ghana have been overwhelmed by high taxes and bureaucratic red tapes. Moreover, the study by (Tee, Boadi, & Opoku, 2016) fund that tax policies have an adverse impact of on the growth of MSEs in Ghana. Taxation is among the major constraint of doing business all over the world among which regulatory requirements and the costs of tax compliance are the most important tax related issues disproportionately affecting the performance of the MSE business (IFC, WB, & DFID, 2009). The significant fixed costs associated with tax compliance represent a higher cost for the MSE firms as a percentage of sales and income and consequently have a greater adverse impact upon the MSEs than the larger businesses (OECD, 2015). In addition, unfavorable tax system, complicated rules and regulations negatively obstruct the performance of the MSE firms (Muriithi, 2017). The MSE firms are often faces higher tax compliance costs associated with tracking eligibility, keeping specific records and interacting with the tax system for multiple different preferences due to their smaller size (OECD, 2015; Atawodi & Ojeka, 2012). Similarly, the complexity of the tax system makes the MSE firms spend considerable time and money in fulfilling their tax liabilities which would be better spent in performing the primary task of conducting business (IFC, WB, & DFID, 2009). Empirically, the study by (Mbugua & Moronge, 2016) found taxation shows significant negative impact on the MSE performance while training has significant positive influence on the MSE performance. They also found high tax rates, tax complexity, tax compliance cost and bureaucratic tax payment procedures influence the performance of MSE businesses in Kenya. Similarly, the study by (Atawodi & Ojeka, 2012) found that high tax rates, multiple taxation, complex tax regulations and lack of proper tax education are the main problems that MSEs faced with in Nigeria. Similar study by (Yesegat, Coolidge, & Corthay, 2017) found that the use of cash register machine and computers in their tax accounting systems requires technical skill of MSE owners and imposes higher compliance costs on the MSE firms operation in Ethiopia. Albeit, a good tax system should be based on the principles of certainty, convenience, economy and simplicity (Nwamuo, 2017), most of the above studies argued that taxation of the MSE firms does not meet all of the above good tax system requirements and thus imposes high burden on the performance of MSE firms. Previous studies on the impact of taxation on the MSE performance were unable to provide a clear cut results about the association and magnitudes of their results which are mostly of foreign counties work in its nature where the dynamics of the MSE activities are different from that of Ethiopian context. Thus, there is scant literature that empirically tested the impact of taxation on the MSE performance in Ethiopia in general and in the study area in particular. The inconsistence of the finding of the study and the scanty situation of the literature in Ethiopia triggers the need for an in-depth study on the impact of taxation on the MSE performance. Thus, this study tried to assess the impact of taxation on the performance of MSE business in Nedjo town.
- 3. THE ASSESSMENT OF TAXATION ON PERFORMANCE OF MICRO AND SMALL ENTERPRISE IN THE CASE OF NEDJO TOWN, ETHIOPIA World J. Econs. Fin. 168 Objectives of the Study General objective The general objective of the study is to assess the assessment of taxation on performance of micro and small enterprises in the case of Nedjo town Specific objectives Specifically, the study tries: To describe the socio-economic characteristics of MSE operators (managers) To identify the assessment of demographic variables (age, sex and education) on the performance of the MSE business in Nedjo town; To examine the assessment of taxation (tax system, tax rate, tax administration, tax level, tax compliance cost, multiple taxation and tax education and training) on the performance of the MSE business in the study area; To examine the association between tax related factors and the performance of the MSE business in the study area Research Hypothesis To answer the above specific objectives, the study tried to answer eight null research hypotheses (Ho) that were stated in the following manner. H1: Demographic characteristics of respondent have no significant assessment on the performance of MSE firms in the study area H2: Tax system has no significant assessment on the performance of MSE firms in Nedjo town. H3: Tax rate has no significant assessment t on the performance of MSE firms in Nedjo town. H4: Tax administration has no significant assessment on the performance of MSE firms H5: Tax level has no significant assessment on the performance of MSE business in Nedjo town. H6: Tax compliance cost has no significant assessment on the MSE performance in Nedjo town. H7: Multiple taxations have no significant assessment on the performance of the MSE firms. H8: Tax education and training has no significant assessment on the MSE performance. Hypothesis-testing will result in either accepting the hypothesis or in rejecting the hypothesis based on the P-values (Kothir, 2004) Scope of the Study As the main objective of the study was to assess the taxation on the performance of the MSE business, the scope of the study was limited to an assessment of the impact of demographic characteristics of MSE owner, tax system, tax rate, tax administration, tax level, tax compliance cost, multiple taxation and tax education and training variables on the performance of the MSE business in the study area but there was time constrain, the collections of data were undertaken in the month of December 2018 for 10 days. Important information on the assessment of taxation on performance of MSE business was collected from the MSE owners operating their business in Nedjo town. Significance of the Study The major contribution of this study was associated with the assessment of taxation on the performance of MSE business. Since there were no previous studies conducted on the assessment of taxation on the performance of MSE firms, the result of the study may act as the stepping stone for further studies to be conducted in areas of the assessment of taxation on the performance of the MSE firms. Therefore, individuals or organizations that have an interest on the assessment of taxation on the performance of the MSE firms may help to clearly understood. In addition, the information generated in this research might be helpful for management of the MSE sectors, tax authority, research institutions and policy makers. Finally, the findings of the study may add both the theoretical and the empirical literature to the body of knowledge. Limitation of the Study Since the study was conducted on the assessment of taxation on the performance of the MSE firm only in Nedjo town, it is difficult to generalize the finding of the study to the national level based on the findings from a single town. Also, data collected from the MSE owner manager and others relies on the genuine response about their MSE performance, the reality behind the the assessment of taxation on the performance of MSE firm may be encountered with reporting bias that may reduce the reliability and the validity of the study. Moreover, the shortage of finance and time were another important factor that hindered the researcher from expanding the study to similar tows found in the region. Organization of the Paper Following the above brief introduction on the background of the study, the remaining part of this research work was organized as follows. Chapter two presents review of literature related to the assessment of taxation on the performance of the MSE business. Chapter three deals with research methodology which includes: the setting of the study area; research designs; sources and types of data; population of the study; sample size determination; sampling procedures; research instrument; data collection procedures; description of variables and model specification; data testing and method of data analysis. Chapter four describes the result and discussion of the study findings. The last chapter, chapter five summaries, concludes and recommended based on the finding of the study. All the reference materials used in the study were listed under the reference section of the study.
- 4. THE ASSESSMENT OF TAXATION ON PERFORMANCE OF MICRO AND SMALL ENTERPRISE IN THE CASE OF NEDJO TOWN, ETHIOPIA Abdeta & Admassu. 169 MATERIALS AND METHODS This study was undertaken in Nedjo town found in west Wollega Zone. Nedjo town is located to the western region of Oromia regional state at distance of 497 km from Addis Ababa and 72 km from Ghimbi town. The town was established since 1893 G.C. by a person Nejo Muraram from which name of the town was derived. The town was recognized as municipal in 1937 E.C and the transport routes to Assosa and many woredas such as Jarso, Babo Gambel, Begie, Kondela, Boji Dirmeji, Boji Chokorsa, Kiltu Kara and Mana Sibu. The town has an average altitude 1841m above sea level at 9030’ north longitude and 35030’ east latitude. The town is surrounded by Eba Wakeyo in the southern, Humna Wakeyo in the northern, Welitate Agar in the western, Gida Kumbie in the eastern and Homie Goromti in the southern east peasant associations. Nedjo town has 4,508 hectares of land area. The maximum, minimum and average temperature of the town is about 350c, 11.20c and 23.10c respectively (FEDRO, 2017). Like any towns of the region country, Nedjo town is also facing challenges like high population growth due to the migration of people from rural to urban center. According to the census conducted by the Central Statistics Authority (CSA) of Ethiopia, the total population of Nedjo town is 24, 497 of which 12, 474 of them are male and the remaining 12, 032 of them are female people residing in Nedjo town (CSA, 2008). The Ethiopian CSA estimated that the total population of Nedjo town is to be 39, 546 populations of which 19,954 of them are male and the remaining 19, 592 of them are female residents in 2017 in Nedjo town (FDRECSA, 2013). Currently, Nedjo town is divided into four urban kebele administrations. Like any other towns, Nedjo town has all government administrative structure which includes municipal office, revenue office, finance and economic cooperation, MSE agency and other public sector offices. The MSE agency are actively engaged in the MSE support starting from its establishment through providing support service in areas of training, licensing, providing work premises, monitoring and reporting activities of MSE firms (FEDRO, 2017). Research Design Research design is the detailed blue print used to guide a research study towards its objectives. It is a detailed plan of work to be done to achieve the research objectives (Kothir, 2004). Based on this, this study used descriptive and explanatory research design. Since the purpose of this study was intended to assess the assessment of taxation on the performance of the MSE business, quantitative research method was used as the method was proper and suitable for the collection and analyzing of primary data collected from the MSE managers or owners. The study employed survey method for data collection because the survey methods facilitated the collection of original data that represented of the real situation of the study population for the investigation of the assessment of taxation on performance of the MSE firm in Nedjo town. Data Source and Type The sources of data used in this study were collected from primary and secondary sources. Secondary data was collected from organizational documentary report and other materials that were unpublished and prepared on quarterly and annual bases. Also, secondary data was collected from published documents and articles that are pertinent for the study. To conduct an assessment on taxation of performance of the MSE firms, primary data was collected from all MSE firms operating in Nedjo town using structured questionnaires adopted from existing relevant literature that were previously done their research work in areas of the assessment of taxation variables on performance of MSE within and outside of the county. The Target Population of the Study The study has tried to assess the assessment of taxation on the performance of the MSE firm by using information collected from the MSE owner managers/accountants. Thus, the target populations of the study 94 MSE firms operating their MSE firm in Nedjo town. The total populations consist of 31 MSE firms operating in the trade sector, 26 MSE firms engaged in the service MSE sector, 22 MSE firms operating in agricultural sector of the MSE, 9 MSE firms engaged in the industry sector of the MSE business and 6 MSE firms running in the construction sector of the MSE business that was used as the strata for data collection as shown by table 1 of the study. Table1: Distribution of the population of the study No Sectors of MSE business No of MSE firms Total number of participants 1 Agriculture 22 22 2 Construction 6 6 3 Industry 9 9 4 Service 26 26 5 Trade 31 31 Total 94 94 Source: Nedjo town June 30, 2018 compiled annual MSE office report Sample Size The sample size was determined from the total population of 94 MSE firms running their business in Nedjo town. Knowing the population size with which the researcher is dealing is important in sample size determination. If the population is small, usually 200 or less, it may be preferable to do a census of everyone in the population rather than a sample (Watson, 2001).In line with this, the total number of MSE firms becomes the sample size for the study.
- 5. THE ASSESSMENT OF TAXATION ON PERFORMANCE OF MICRO AND SMALL ENTERPRISE IN THE CASE OF NEDJO TOWN, ETHIOPIA World J. Econs. Fin. 170 Sample Size The sample size was determined from the total population of 94 MSE firms running their business in Nedjo town. Knowing the population size with which the researcher is dealing is important in sample size determination. If the population is small, usually 200 or less, it may be preferable to do a census of everyone in the population rather than a sample (Watson, 2001).In line with this, the total number of MSE firms becomes the sample size for the study. Sampling Procedure In order to collect the required data for the study, first the total study participants are categorized in to five strata based on the sector of the MSE business as shown by table 2 of the study. . Table 2: Distribution of the sample size among the MSE sectors No Sectors of MSE business No of MSE firms Total number of participants 1 Agriculture 22 22 2 Construction 6 6 3 Industry 9 9 4 Service 26 26 5 Trade 31 31 Total 94 94 Source: Own calculation based on Nedjo town June 30, 2018 annual MSE office report Following this, the required data was collected from the total MSE firms’ owner manager/ accountant. The determined sample size was allocated for the five MSE business sectors of which 31 MSE firms owner manager/accountant operating in the trade sector of the MSE business, 26 MSE firms owner manager/accountant engaged in the service MSE sector, 22 MSE firms owner manager/accountant operating in agricultural sector of the MSE, 9 MSE firms owner manager/accountant engaged in the industry sector of the MSE business and 6 MSE firms owner manager/accountant running in construction sector of the MSE business that was used as the strata for data collection in the study. Data Collection Tool This study was based on primary data collected using structured questionnaires adopted from previous study such as (Radzi, Mohdnor, & Ali, 2017; Mbugua & Moronge, 2016; Mwangi & Nganga, 2013) in areas of the assessment of taxation on performance of the MSE firms. For data collection on the assessment of taxation on the MSE performance, the performance of the MSE firm is compared with other competing firms on employment growth, investment and profit as previous researchers such as (Sajilan, Tehseen, & Adeyinka, 2016) used in their study. Data collection tool consists of the MSE owners’ personal information, the MSE business information, the performance, taxation questions and taxation factors that affect the MSE performance. The research tool consists of closed ended and five point likert scale types of questionnaires on which the MSE owners compare their MSE performance with similar MSE firms found in their area. In order to measure the relative performance of the MSE firms in comparison with other rivals MSE business, the MSE owner manager were asked to compare and rate their own MSE performance using five-point Likert scale type of questionnaires ranging from strongly decreasing (with value of 1) to strongly increasing (with value of 5 points). Also, they were asked to rate their own agreement on performance of their own MSE business relative to similar business found in the study area using five-point Likert scale type (where 1= strongly disagree, 2= Disagree, 3=Neutral, 4=agree and 5=strongly agree) of questionnaires on the MSE business employment growth, investment growth and profit growth of the MSE business. Method of Data Collection First, the research instrument was tested with small representative for the sample (5 respondents one from each MSE sector) whether the tool collects the required data for the realization of the research objectives. For data collectors with a minimum of first degree holders were recruited for data collection. Training was given for one day on the objective, relevance, confidentiality of information, respondent’s right, informed consent and techniques of interview in data collection. The subject matter is requested from MSE owners and their responses were recorded in the presence of data collector in the field. The researcher was closely followed the overall data collection process throughout the data collection period. All field questionnaires were reviewed every night and errors were corrected and data collectors preceded their work. The collections of data were undertaken in the month of December 2018 for 10 days. Variable Description and Model Specification The data collected on the three variables (employment growth, investment growth and the profit growth) are transformed as a single variable, PMSE, using SPSS for data analysis. Description of variables Based on extensive review of literature in the areas of the effect of taxation on performance of MSE business, demographic variables, tax system, high tax rate, tax administration, tax level, tax compliance cost, multiple taxation and tax education and training were selected for explanatory variables for the study.
- 6. THE ASSESSMENT OF TAXATION ON PERFORMANCE OF MICRO AND SMALL ENTERPRISE IN THE CASE OF NEDJO TOWN, ETHIOPIA Abdeta & Admassu. 171 Demographic Variables (DV): The demographic characteristics of MSE owner like age, gender and education are the most influential factors related to performance of MSE firms (Mahadalle & Kaplan, 2017; Gerli, Gubitta, & Tognazzo, 2011) and found that gender, age, education and marital status of MSE owners are positively associated with performance of MSE firms. Tax System (TS): encourages growth, investment and innovation. The study by (Mbugua & Moronge, 2016) found that the complexity of tax system significantly influences the MSE performance in Kenya. Also, the study by (OECD, 2015) found tax rules significantly influences the investment, employment and growth of MSE business in OECD and G20 countries. Tax Rate (TR): is the most important factor that affects the growth of MSE firms. The study by (European Commission, 2017) found an increase in the tax rate negatively affects the growth of the MSE firms. Similarly, (Lazar & Istrate, 2018; Mbugua & Moronge, 2016) found that tax rate negatively and significantly affects MSE firms performance. Tax Administration (TA): is the most important factor that affects the growth of MSE firms. The study by (Mbugua & Moronge, 2016) found bureaucratic tax payment shows significant negative assessment on performance of MSE firm. Also, (Kusi, Opata, & Narh, 2015) found MSE firms have been plagued with bureaucratic red tapes in Ghana. Tax Level (TL): Tax level directly affects business costs and capital allocation and hence performance of MSE firms (Nwamuo, 2017). The study by (Mbugua & Moronge, 2016) found that taxation shows significant negative influence on the MSE performance. Also, (Tee, Boadi, & Opoku, 2016; Atawodi & Ojeka, 2012) found that tax paid significantly impacts MSE profit. Tax Compliance Cost (TCC): are all tax related costs incurred by taxpayers other than taxes paid to government (IFC, WB, & DFID, 2009) and the burdensome to performance of MSE firm (Engelschalk & Loeprick, 2015). The study by (Mbugua & Moronge, 2016) found that tax compliance costs significantly affect performance of MSE firms. Finally, (Yesegat, Coolidge, & Corthay, 2017) found tax compliance costs are burden to the MSE firms in Ethiopia. Multiple Taxations (MT): is the case where the same income is taxed more than once and imposes burden on micro than small enterprises (Nwamuo, 2017). The study by (Adebisi & Gbegi, 2013) found multiple taxations have significant negative effect on MSEs’ survival. Also, (Nwamuo, 2017) found that the incidence of multiple taxations has increased the cost of business operations, reduce profit margin of firms and increased unemployment. Tax Training and Education (TET): Tax education helps taxpayers to comply with basic tax requirements and reduces compliance costs (IFC, WB, & DFID, 2009). Basic training contributes positively to the MSE firms’ performance (Mbugua & Moronge, 2016). A well trained MSE owner increase sales volume and employment (Kithae, Maganjo, & Kavinda, 2013). Also, (Mbugua & Moronge, 2016) found training is positively and significantly affect MSE performance. Model specification: The model for the study was specified based on the previous studies conducted by (Yesegat, Coolidge, & Corthay, 2017; Tee, Boadi, & Opoku, 2016; Atawodi & Ojeka, 2012) and others that done their work in the areas of taxation and performance of MSE business and analyzed data collected by using either correlation and/or regression model. The specified Ordinary Least Square (OLS) regression model was described as follows: 𝑃𝑀𝑆𝐸 = 𝑎0 + 𝑏(𝐷𝑉) + 𝑐(𝑇𝑆) + 𝑑(𝑇𝑅) + 𝑒(∑𝑇𝐴) + 𝑓(∑𝑇𝐿) + 𝑔(∑𝑇𝐶𝐶) + ℎ(∑𝑀𝑇) + 𝑖(∑𝑇𝐸𝑇) + 𝜀 … … … … … … … … … … … … … … … … … … … … … … . . . . (1) Where; PMSE is the performance of the MSE business used as dependent variable and the independent variables used in the regression model includes: DV: Demographic variables includes age, sex and educational level of the MSE owners; TS: Tax system TR: Tax rate TA: Tax administration TL: Tax level TCC: Tax compliance cost MT: Multiple taxation (tax cascading) TET: Tax education and training The 𝒂 𝟎 is the constant values of the estimated model The coefficients b, c, d, e, f, g, h, and i were the estimated values of each factors 𝜺 is the stochastic or random error term Validity and Reliability Explanatory Data Tests: The reliability test concerns the extent to which the instrument produces consistent results in repeated measurements. In line with this, the empirical data test for the Likert scale types of questions shows that the value of Cronbach’s α is 0.728 for the 25 explanatory variables and 0.770 for 28 variables including the three dependent question that are used in the analysis indicating the collected sufficiently reliable to conduct empirical data analysis as suggested by (Garson, 2012). Also, the principal component analysis for each of the Likert scale types of question reveals that the output of all the explanatory variables used in the study shows that the communalities of all variable is above 0.60 (Annex 1) with the minimum value of 0.601 observed by
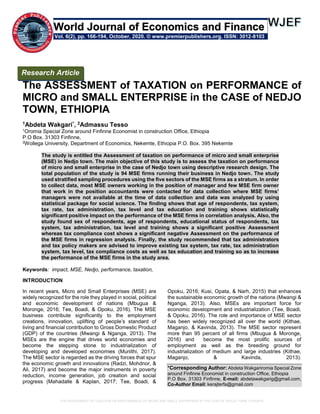
- 7. THE ASSESSMENT OF TAXATION ON PERFORMANCE OF MICRO AND SMALL ENTERPRISE IN THE CASE OF NEDJO TOWN, ETHIOPIA World J. Econs. Fin. 172 one variable which is above the cut of points relative to the sample size used as suggested by (Field, 2009). Methods of Data Analysis: Data collected was checked for the completeness and consistency, edited and then entered in to Statistical Package for Social Science (SPSS) version 20 software for the descriptive analysis, correlation and regression analysis. Following the required explanatory diagnostic tests for data collected, correlation and regression analysis were conducted to assess the association of taxation factors on the performance of the MSE firms in the study area. The interpretation of the study was done based on the result of the correlation and the regression coefficients. Finally, the required recommendation on the assessment of taxation on the performance of the MSE firms was conducted based on the coefficients of the correlation output and the estimated regression results. RESULTS, DISCUSSIONS AND INTERPRETATIONS Demographic Characteristics of Respondents First, when the demographic characteristics of respondents was considered, the result of the study on table 3 shows that 78 (83.0%) of respondents were male whereas 16 (17.0%) of them were female. The result of the study shows that 49 (52.2%) of respondents were found in the age categories of 25 to 29 years old followed by 32 (34.0%) of them were found in the age category of 30 to 34 years old respondents. The study on table 5 was also shows that 7 (7.4%) respondents were found in the age category of 18 to 24 years whereas 6 (6.4%) of them were found above 34 years old. In addition, the result of the study on table 5 shows that 84 (89.4%) of respondents were married MSE owners whereas 10 (10.6%) of respondents were single MSE owners. Also, when the educational status of respondents was considered, the result of the study on table 3 shows that 31 (33.0%) of respondents were TVET level in educational achievements followed by 21 (22.3%) of respondents were high school in academic achievement. The result of the study also shows that 19 (20.3%) of respondents were Diploma holders whereas 13 (13.8%) of respondents were Degree and above level of MSE firm owners and the remaining 10 (10.6%) of respondents were elementary level in educational achievements. Similarly, the result of the study on table 3 shows that 47 (50.0%) of respondents were MSE owners with 3 to 6 years of MSE business work experience whereas 35 (37.2%) of respondents were MSE firm owners with 1 to 3 years of business work experience and the remaining 12 (12.8%) of respondents were MSE firm owner with above 6 years of business work experience in the MSE business. Similarly, the result of the study on table 5 shows that 85 (90.4%) of respondents were working in the position of managers whereas 9 (9.6%) of them were working on the position of accountant in their MSE firm as show by table 5 of the study. Table 3: Demographic characteristics of respondents Characteristic Variable Frequency (%age) Sex of respondent Male 78 (83.0%) Female 16 (17.0%) Age of the study participant 18-24 years 25-29 years 30-34 years Above 34 years 7 (7.4%) 49 (52.2%) 32 (34.0%) 6 (6.4%) Marital status of respondents Married Single 84 (88.4%) 10 (210.6%) Educational status of respondents Elementary level High school level TVET level Diploma level Degree & above 10 (10.6%) 21 (22.3%) 31 (33.0%) 19 (20.3%) 13 (13.8%) Business experience owned by the MSE owners 1-3 years 4-6 years Above 6 years 35 (37.2%) 47 (50.0%) 12 (12.8%) Position of respondents in the MSE firms Manager Accountant 85 (90.4%) 9 (9.6%) Whether the MSE owner acquired tax related training Yes No 84 (89.4%) 10 (10.6%) Training that MSE owners mostly attended (From 84 trained) Tax requirement Tax rules & laws Tax calculation Record keeping 31 (36.9%) 27 (32.1%) 16 (19.1%) 10 (11.9%) Source: Own survey, 2019
- 8. THE ASSESSMENT OF TAXATION ON PERFORMANCE OF MICRO AND SMALL ENTERPRISE IN THE CASE OF NEDJO TOWN, ETHIOPIA Abdeta & Admassu. 173 Moreover, regarding the tax education/training, the result of the study on table 3 shows that 84 (89.4%) of respondents were acquired tax education and training whereas 10 (10.6%) of respondents were not. Among respondents acquired tax education/training, the study shows that 31(36.9%) of respondents mostly attended on tax requirement training whereas 27 (32.1%) of respondents mostly attended training on tax rules and laws. In addition, the study found that 16 (19.1%) of respondents were attended tax education/training on tax calculation and the remaining 10 (11.9%) of them attended tax education/training on record keeping. Finally, the comparison of the gender distribution among the educational achievements of the study participants shows that 24 (25.53%) of male respondents were with TVET level of educational achievements compared to 7 (7.45%) of female respondents with TVET educational level of achievements as shown by figure 2 of the study. Figure1: Comparison of sex of respondent among the educational level of respondents Source: Survey output, 2019 In addition, the result of the study on figure 1 shows that 17 (18.09%) of male respondents were Diploma holder respondents compared to 2 (2.13%) of Diploma holder female study participants. Similarly, the result of the study shows that 15 (15.96%) of male respondents were high school complete compared to 6 (6.38%) of female respondents with high school compete MSE firms owner respondents in the study. Moreover, the finding of the study shows that 13(9.54%) of male respondents were holders of first degree and above compared to none of female respondents with first degree and above level of educational achievements in the MSE firms. To the end, the result of the study reveals that 9 (9.57%) of male study participants were with elementary level of educational achievements in the study participants compared to 1 (1.06%) of female respondents with elementary level of educational achievements working in the MSE firms. The finding revealed that only male respondents are with the Degree and above level and majority of female respondents were with TVET level of the highest educational achievements in the study. The Characteristics of the MSE Firms The study participants were also asked to respond about the characterization of their MSE business. In line with this, the result of the study on table 4 shows that 31 (33.0%) of respondents were owners of the trade sector MSE firm whereas 26 (27.7%) of respondents were operating in the service sector of the MSE firm in the study area. The result of the study also shows that 22 (23.4%) of respondents were from the agricultural sector of the MSE firm whereas 9 (9.6%) of respondents were from industry sector of the MSE firm and the remaining 6 (6.3%) of respondents were opertining in construction sector of the MSE firm in Nedjo town. The finding of the study shows that respondents were from the five major MSE sectors which were in line with the proposed work plan for the study. Also, when the age categories of the MSE firm was considered, the result of the study on table 6 shows that 61 (64.9%) of respondents reported that their MSE firm was in operation of the MSE business for 3 years to 5 years whereas 17 (18.1%) of them reported that their MSE firm was in operation of the MSE business for the last 1
- 9. THE ASSESSMENT OF TAXATION ON PERFORMANCE OF MICRO AND SMALL ENTERPRISE IN THE CASE OF NEDJO TOWN, ETHIOPIA World J. Econs. Fin. 174 year to 2 years and the remaining 16 (17.0%) of respondents were reported that their MSE firm was in the operation of the MSE business for more than 5 years. Similarly, when the number of members of the MSE firm was considered, the result of the study on table 6 shows that 61(64.9%) of respondents reported that their MSE firm is operating with 1 to 5 members as owner of the MSE firm whereas 33 (35.1%) of respondents reported that their MSE business was running with 6 to 30 owners of the MSE firms. The finding of this study shows that despite most of the MSE firms have relatively better business experience, they are still operating with micro level of MSE members in the study area. When the total capital of the MSE firm during the survey period was considered, the study shows that 51 (54.3%) of respondents were operating with a total capital of less than 50,000 Birr whereas 27 (28.7%) of respondents reported that the total capital of their MSE firm during the survey period was found in the range of 50,001 to 100,000 Birr. The finding the study also revealed that 14 (14.9%) of respondents were operating with a total capital that is found in the range of 100,001 to 500,000 Birr and the remaining 2 (2.1%) of respondents were operating their MSE firm with a total capital found in the range of 500,000 to 1,500,000 Birr. The finding of the study reveals that most (83%) of the MSE firm owners are operating their MSE firms with a total capital found in the range of micro level as shown by table 6 of the study. . Table 4: Characterizations of the MSE firms Characteristic Variable Frequency (%age) The sector of the MSE business Agriculture Construction Industry Service Trade 22 (23.4%) 6 (6.3%) 9 (9.6%) 26 (27.7%) 31 (33.0%) Age category of the MSE firms 1-2 years 3-5 years Above 5 years 17 (18.1%) 61(64.9%) 16 (17.0%) Number of MSE members during the survey time 1-5 members 6-30 members 61 (64.9%) 33 (35.1%) The total capital of MSE during the survey period Less than 50,000 Birr 50,001-100,000 Birr 100,001-500,000 Birr 500,000-1,500,000 Birr 51 (54.3%) 27 (28.7%) 14 (14.9%) 2 (2.1%) The legal status of the MSE business Partnership Cooperative 81 (86.1%) 13 (13.8%) The growth stage of the MSE firm Micro enterprise Small enterprise 89 (94.7%) 5 (5.3%) Whether the MSE firm has renewed business license Yes No 91 (96.8%) 3 (3.2%) Whether the MSE firm keeps accounting records for tax purpose Yes No 87 (92.6%) 7 (7.4%) Source: Own survey, 2019 Similarly, when the legal status of the MSE firm was considered, the result of the study on table 4 shows that 81 (86.2%) of respondents were reported that their MSE firm was organized as partnership of types of business whereas 13 (13.8%) of them reported that their MSE firms were organized as cooperative types of business in the study. With respect to the growth stage of the MSE firm, the result of the study on table 4 shows that 89 (94.7%) of respondents were reported that their MSE firms were found at micro enterprise level of MSE firms growth stage whereas 5 (5.3%) of respondents reported that their MSE firms were small enterprise in the level of MSE firm growth stage in the study area. Similarly, the result of the study on table 4 shows that 91 (96.8%) of respondents were reported that their MSE firms business license was renewed whereas 3(3.2%) of respondents reported that their business license was not renewed. Moreover, the result of the study on table 6 shows that 87 (92.6%) of respondents were reported that their MSE business keeps accounting record for tax purpose whereas 7 (7.4%) of respondents reported that their MSE business have no separate accounting record kept for the tax purpose. Finally, when the number of members of MSE firm was compared among the five MSE sectors, the result of the study on figure 1 shows that 26 (27.66%) of respondents were operating their MSE business with 1 to 5 number of members in the trade sector compared to 5 (5.32%) of
- 10. THE ASSESSMENT OF TAXATION ON PERFORMANCE OF MICRO AND SMALL ENTERPRISE IN THE CASE OF NEDJO TOWN, ETHIOPIA them operating with 6 to 30 number of members in the trade sector as shown by figure 3 of the study. Figure 2: Comparison of the number of members of the MSE across the five MSE sectors Source: Survey output, 2018 In addition, the result of the study on figure 2 shows that 20 (21.28%) of respondents were operating their MSE business with 1 to 5 number of members in the service sector of the MSE firm compared to 6 (6.38%) of respondents that were operating their MSE business with 6 to 30 number of members in the MSE firms. Similarly, the result of the study on figure 3 shows that 15 (15.96%) of repspondents were operating their MSE business with 6 to 30 number of members in the agricultural sector of the MSE firm compared to 7 (7.45%) of respondents that are operating their MSE business with 1 to 5 number of members in the MSE firms. Moreover, the result of the study on figure 2 shows that 5 (5.32%) of respondents were operating their MSE business with 1 to 5 number of members in the industry sector of the MSE firm compared to 4 (4.26%) of respondents that are operating their MSE business with 6 to 30 number of members in the MSE firms. Finally, the result of the study shows that the construction sector of the MSE firm that operates with the same number of members among the MSE sectors. The finding of this study indicates that the construction sector was better in employments opportunity followed by the industry and agricultural sector relative to the number of MSE firms in the study area. Perception of Respondents on the Performance of the MSE Firms In this study, respondents were requested to respond about the performance of their MSE firms relative to other similar MSE firms on eight variables. In line with this, when the performance of their own MSE firm relative to similar other MSE firms, the result of the study on table 3 shows that 48 (51.1%) of respondents reported that their own MSE firm was successful in their MSE business performance relative to other MSE firm whereas 43 (45.7%) of respondents reported that their MSE business was unsuccessful in their MSE firm performance relative to similar other MSE firms and the remaining 3 (3.2%) of respondents reported that their MSE firm was very successful in the performance of their MSE firm. The finding of the study shows that more than half of the MSE firms were successful in their MSE performance in the study area. Also, when the operation capacity of the MSE firms relative to other similar MSE firms operating in the study area was considered, the result of the study on table 7 shows that 63 (67.0%) of respondents reported that their own MSE firms were operating with full capacity compared to similar other MSE firm whereas 27 (28.7%) of respondents were operating their MSE business with below capacity compared to similar other MSE firm and the remaining 4 (4.3%) of respondents were opertining their MSE business with above full capacity compared to similar other MSE firm in the study area. Similarly, when the investment of the MSE firms were considered, the result of the study on table 5 shows that 28 (29.8%) of respondents were reported that their MSE firms were undertaken new investment in their MSE firms whereas 66 (70.2%) of respondents were reported that their MSE firms were not undertaken new investment in the MSE business in the past one year as shown by table 5 of the study.
- 11. THE ASSESSMENT OF TAXATION ON PERFORMANCE OF MICRO AND SMALL ENTERPRISE IN THE CASE OF NEDJO TOWN, ETHIOPIA World J. Econs. Fin. 176 Table 5: Perception of respondents on the performance of the MSE firms Characteristic Variable Frequency (%) Performance of the MSE firms relative to similar MSEs found in the study area Unsuccessful Successful Very successful 43 (45.7%) 48 (51.1%) 3 (3.2%) The level of MSEs operation capacity relative of other MSEs was Below capacity Full capacity Above capacity 27 (28.7%) 63 (67.0%) 4 (4.3%) Whether MSEs undertaken new investment Yes No 28 (29.8%) 66 (70.2%) The purpose of new investment conducted was (for 28 respondents) Expand business Purchase of fixed asset Working capital 16 (57.2%) 10 (35.7%) 2 (7.1%) The reason why new investment was not conducted (for 66 respondents) Lack of fund Tax expenditure 59 (89.4%) 7 (10.6%) The employment growth of MSEs compared to similar MSE firms Significantly decreasing Moderately decreasing About the same Moderately increasing Significantly increasing 9 (9.6%) 26 (27.6%) 39 (41.5%) 16 (17.0%) 4 (4.3%) The investment growth of MSE compared to similar MSE firms Significantly decreasing Moderately decreasing About the same Moderately increasing Significantly increasing 8 (8.5%) 25 (26.6%) 41 (43.6%) 17 (18.1%) 3 (3.2%) The profit growth of MSE compared to similar MSE firms Significantly decreasing Moderately decreasing About the same Moderately increasing Significantly increasing 9 (9.6%) 27 (28.7%) 38 (40.4%) 17 (18.1%) 3 (3.2%) Source: Own survey, 2019 Among the MSE firms that were undertaken new investment (28 MSE firms) in their MSE firms, the result of the study on table 5 shows that 16 (57.2%) of respondents reported that their MSE firms were invested on expansion the MSE firms whereas 10 (35.7.6%) of respondents reported that their MSE firms were invested on the purchase of fixed asset and the remaining 2 (7.1%) of respondents reported that their MSE firms were invested on working capital in the study area. In addition, when the reason behind why MSE firm were not undertaken new investment was considered, the study result on table 5 shows that 59 (89.4%) of respondents reported that their MSE firms were not undertaken new investment due to lack of fund whereas 7 (10.6%) of respondents reported that their MSE firms were not undertaken new investment for the tax expenditure reason. The finding revealed that most MSE firms were not undertaken new investment for various reasons among which lack fund is the most cited problem. Similarly, when employment growth of the MSE firm was compared to similar other MSE firms operating in the study area was considered, the result of the study on table 5 shows that 9 (9.6%) of respondents were reported that employment growth of their MSE firm was significantly decreasing compared to similar other MSE firms whereas 4 (4.3%) of respondents were reported that the employment growth of their MSE firm was significantly increasing relative to similar MSE firms found in the study area. Also, the result of the study on table 5 shows that 26 (27.6%) of respondents reported that the employment growth of their MSE firm was moderately decreasing relative to similar other MSE firms whereas 16 (17.0%) of respondents were reported that the employment growth of their MSE firm was moderately increasing compared to similar MSE firms and the remaining 39 (41.5%) of respondents were reported that the employment growth of their MSE firm was about the same when compared to similar other MSE firms. The finding revealed that most respondents perceived as the employment growth of their MSE firm was about the same as that of similar MSE firms operating in the study area. Moreover, regarding the investment growth of the MSE firm relative to similar other MSE firms operating n the study area, the result of the study on table 5 shows that 8 (8.5%) of respondents were reported that the investment growth of their MSE firm was significantly decreasing compared to similar other MSE firms whereas 3 (3.2%) of respondents were reported that the investment growth of their MSE firm was significantly increasing compared to similar other MSE firms. Also, the result of the study shows that 25 (26.6%) of respondents were reported that the investment growth of their MSE firm was moderately decreasing relative to similar other MSE firms whereas 17 (18.1%) of respondents reported that the investment growth of their MSE firm was moderately increasing compared to similar other MSE firms
- 12. THE ASSESSMENT OF TAXATION ON PERFORMANCE OF MICRO AND SMALL ENTERPRISE IN THE CASE OF NEDJO TOWN, ETHIOPIA and the remaining 41 (43.6%) of respondents reported that the investment growth of their MSE firms were about the same compared to similar other MSE firms found in the study area. The finding revealed that around 44 percent of respondents perceived as the investment growth of their MSE firm was about the same when compared to similar other MSE firms followed by about 27 percent of respondents that perceived their MSE firm investment was moderately decreasing indicating that respondents were negatively perceived the investment growth of their MSE firm compared to similar other MSE firms operating in the study area. Finally, with respect to the profit growth of the MSE firms relative to similar MSE firms found in the study area, the result of the study on table 5 shows that 9 (9.6%) of respondents were perceived that the profit growth of their MSE firms were significantly decreasing compared to similar other MSE firms whereas 3 (3.2%) of respondents were reported that the profit growth of their MSE firms were significantly increasing compared to similar MSE firms. Also, the study result shows that 27 (28.7%) of respondents were reported that the profit growth of their MSE firms were moderately decreasing relative to similar other MSE firms whereas 17 (18.1%) of respondents reported that the profit growth of their MSE firms were moderately increasing compared to similar MSE firms and the remaining 38 (40.4%) of respondents reported that the profit growth of their MSE firms is about the same compared to similar other MSE firms. The Nature of Taxation and the Types of Tax Paid by the MSE Firms Regarding the perception of respondents about the nature of taxation and the types of tax paid by the MSE firms, the result of the study was summarized by table 5 of the study. When the tax payment status of MSE firm was considered, the result of the study on table 8 shows that 85 (90.4%) of respondents reported that their MSE firm was pay tax to the tax authority whereas 9 (9.6%) of them were not. Separately, the result of the study shows that 40 (42.6%) of respondents were paid business income (profit) tax to the tax and revenue authority whereas 54 (57.4%) of respondents were not paid business income (profit) tax to the tax authority. Also, the result of the study on table 6 shows that 6 (6.4%) of respondents reported that their MSE firms were paid Value Added Tax to the tax authority whereas 88 (93.6%) of respondents reported their MSE firms were not. Finally, the study shows that 46 (48.9%) of respondents reported their MSE firms were paid municipal service tax whereas 48 (51.1%) of respondents were not paid municipal service tax to the tax authority. The finding revealed that above 90 percent of the MSE firms’ owners were paid tax to tax authority such as business income tax, value added tax and municipal services tax indicating existence of multiple taxation system on the MSE firms as shown by the following table. Table 6: The types of tax paid and the nature of taxation Characteristic Variable Frequency (%age) Whether the MSE firm have pay tax or not Yes No 85 (90.4%) 9 (9.6%) Whether the MSE firm have paid business income (profit) tax or not Yes No 40 (42.6%) 54 (57.4%) Whether the MSE firm have paid value added tax (VAT) or not Yes No 6 (6.4%) 88 (93.6%) Whether the MSE firm have paid municipal service tax or not Yes No 46 (48.9%) 48 (51.1%) Perception of respondents on the tax system applicable to the MSE firms Simple Normal Complex 7 (7.4%) 45 (47.9%) 42 (44.7%) Perception of respondents on the tax rate levied on the MSE firms Low Equitable High 16 (17.0%) 63 (67.0%) 15 (16.0%) Perception of respondents on tax administrators support on the MSE firms Weak Supportive Corruptive 17 (18.0%) 73 (77.7%) 4 (4.3%) The tax level levied on the MSE firms relative to other MSE firms Low Equitable High 15 (16.0%) 71 (75.5%) 8 (8.5%) The tax compliance cost associated with tax compliance Low Equitable High 26 (27.6%) 62 (66.0%) 6 (6.4%) The multiplicity of taxation levied on the MSE firms in the study area was Low Equitable High 15 (16.0%) 23 (24.5%) 56 (59.5%) Source: Own survey, 2019
- 13. THE ASSESSMENT OF TAXATION ON PERFORMANCE OF MICRO AND SMALL ENTERPRISE IN THE CASE OF NEDJO TOWN, ETHIOPIA World J. Econs. Fin. 178 When the applicability of the tax system to the MSE firms was considered, the study result on table 8 shows that 45 (47.9%) of respondents perceived that the tax system applicable to the MSE firm was normal whereas 42 (47.7%) of respondents perceived that the tax system applicable to MSE firms was complex and the remaining 7 (7.4%) of respondents perceived that the tax system applicable to MSE firm was simple. Also, the result of the study on table 8 shows that 63 (67.0%) of respondents perceived that the tax rate levied on the MSE firm was equitable whereas 16 (17.0%) of respondents that perceived the tax rate levied on the MSE firm was low and the remaining 15 (16.0%) of respondents perceived that the tax rate levied on the MSE firm was high relative the level of business operation. From this study, nearly half of respondents perceived as the tax system applicable to MSE firm was normal and 67 percent of them perceived as the tax rates were equable that implies respondents have positive attitude to the tax system and tax rates applicable to the MSE firms in the study area. Similarly, with respect to the perception of respondents on tax administrators support to their MSE firms, the result of the study on table 8 shows that 73 (77.7%) of respondents perceived that the tax administrators support for the MSE firm was supportive whereas 17 (18.0%) of respondents perceived that the tax administrators support to the MSE firm was weak and the remaining 4 (4.3%) of respondents perceived that the tax administrators were corruptive in their support to the MSE firms. In addition, regarding the amount of tax level levied on the MSE firm, table 8 shows that 71(75.5%) of respondents perceived that the amount of the tax level levied on MSE firm was equitable whereas 15 (16.0%) of respondents perceived that the amount of tax level levied on MSE firm was low and the remaining 8 (8.5%) of respondents perceived that the amount of tax level levied on MSE firm was high. The findings revealed that more than three fourth of respondents perceived that tax administrators were supportive indicating that respondents have positive attitude towards the support of tax administrators in the study area. Moreover, when the perception of respondents on the tax compliance cost was considered, the result of the study on table 8 shows that 62 (66.0%) of respondents perceived that the tax compliance cost incurred by the MSE firm was equitable whereas 26 (27.6%) of respondents perceived that the tax compliance cost of their MSE firm was low and the remaining 6 (6.4%) of respondents perceived that the tax compliance cost of their MSE firm was high. In addition, regarding the multiplicity of taxation on the MSE firm, the result of the study on table 8 shows that 56 (59.5%) of respondents perceived as the multiplicity of taxation was high whereas 23 (24.5%) of respondents perceived as the multiplicity of taxation was equitable and the remaining 15 (16.0%) of respondents perceived as the multiplicity of taxation was low in the study area. Finally, when respondents were requested to select one out of the seven tax related factor with the perception that the selected factor have the highest impact on performance of MSE firms, the result of the study shows that 22 (23.40%) of respondents selected tax administration as the highest factor that have an impact on performance of MSE firms followed by 20 (21.28%) of respondents that selected tax level as the highest taxation factor that have the highest impact on performance of the MSE firms in the study area as shown by figure 4 of the study. Figure 3: Taxation related factors that have the highest effect on performance of MSE firms Source: Survey output, 2019
- 14. THE ASSESSMENT OF TAXATION ON PERFORMANCE OF MICRO AND SMALL ENTERPRISE IN THE CASE OF NEDJO TOWN, ETHIOPIA Abdeta & Admassu. 179 Also, the result of the study on figure 3 shows that 16 (17.02%) of respondents were selected tax rate as the most influential factor that have an impact on performance of the MSE firm whereas 13 (13.83%) of respondents were selected tax education and training as the most influential factor that affects performance of the MSE firms accounting for the 3rd and 4th level respectively. In addition, the study result on figure 4 shows that 11 (11.70%) of respondents selected tax system as the most influential factor that have an impact on performance of the MSE firms whereas 7 (7.45%) of respondents selected multiple taxation as the most influential factor that have an impact on performance of MSE firms and the remaining 5 (5.32%) of respondents selected tax compliance cost was the most influential factor that have an impact on performance of MSE firms accounting from the 5th to 7th level respectively in the study area. Taxation Factors that Affects the Performance of the MSE Firms Studies on the assessment of taxation found that tax system (Muriithi, 2017), tax level (Adebisi & Gbegi, 2013), tax rates, multiple taxation (Nwamuo, 2017) and tax administration (IFC, WB, & DFID, 2009) are the top constraints to the performance the MSE firms. Tax system: Good tax system based on the principles of equity, convenience and certainty possesses the qualities of fairness, convenience and simplicity (Nwamuo, 2017) that encourage the growth, investment and innovation of MSE (Mbugua & Moronge, 2016) for which the effect of tax system on performance of MSE firms is summarized by four variables in table 9 of the study. Table 7: Tax system related factors that affect performance of MSE firms Tax system related characteristic Variable Frequency (%age) The amount of tax to be paid by MSE firm is certain and enhances firm performance Strongly disagree Disagree Neutral Agree Strongly agree 4 (4.3%) 23 (24.5%) 37(39.3%) 25 (26.6%) 5 (5.3%) The means of tax payment by MSE firm is convenient that encourages the MSE firms performance Strongly disagree Disagree Neutral Agree Strongly agree 5 (5.3%) 23 (24.5%) 39 (41.4%) 23 (24.5%) 4 (4.3%) The calculation of tax liability by the MSE firm is simple that encourages the MSE firms performance Strongly disagree Disagree Neutral Agree Strongly agree 7 (7.4%) 24 (25.5%) 36 (38.3%) 23 (24.5%) 4 (4.3%) The tax system applicable to MSE firm is transparent that encourages MSE firms performance Strongly disagree Disagree Neutral Agree Strongly agree 7 (7.4%) 28 (29.8%) 37 (39.4%) 19 (20.2%) 3 (3.2%) Source: Own survey, 2019 In line with this, when the effect of the certainty of the amount of tax paid by the MSE firms on performance of the MSE firms was considered, table 7 shows that 5 (5.3%) of respondents strongly agree that the certainty of the amount of tax to be paid by the MSE firms enhances performance of the MSE firms whereas 4 (4.3%) of them strongly disagree on the certainty of the amount of tax to be paid enhancing the performance of the MSE firm. Also, the study shows that 25 (26.6%) of respondents agree that the certainty of the amount of tax to be paid by the MSE firms enhances the performance of the MSE firms whereas 23 (24.5%) of respondents were disagree on the certainty of the amount of tax to be paid enhancing the performance of the MSE firms in the study area. Nevertheless, the result of the study shows that the remaining 37 (39.3%) of respondents were indifferent on the certainty of the amount of tax to be paid by the MSE firms in enhancing the performance of the MSE firms in the study area. Also, regarding the effect of the convenience of the tax payment system on the performance of the MSE firms, the result of the study on table 7 shows that 4 (4.3%) of respondents were strongly agree that the convenience of the tax payment system by the MSE firms encourages the performance of the MSE firms whereas 5 (5.3%) of respondents were strongly disagree that whether the convenience of the tax payment system by the MSE firms encourages the performance of the MSE firm. Also, the result of the study shows that 23 (24.5%) of respondents were agree that the convenience of the tax payment
- 15. THE ASSESSMENT OF TAXATION ON PERFORMANCE OF MICRO AND SMALL ENTERPRISE IN THE CASE OF NEDJO TOWN, ETHIOPIA World J. Econs. Fin. 180 system by the MSE firms encourages the performance of the MSE firms whereas 23 (24.5%) of respondents were disagree whether the convenience of the tax payment system by the MSE firms encourages the performance of the MSE firms. However, the remaining 39 (41.4%) of respondents were indifferent whether the convenience of the tax payment system by the MSE firms encourages the performance of the MSE firms in the study area. Similarly, when the effect of tax liability calculation on performance of the MSE firms was considered, the result of the study on table 9 shows that 4 (4.3%) of respondents were strongly agree that the calculation of tax liability by the MSE firms was simple that encourages performance of the MSE firms whereas 7 (7.4%) of respondents were strongly disagree whether the calculation of tax liability by the MSE firms was simple that encourages performance of the MSE firms. Also, the result of the study shows that 23 (24.5%) of respondents were agree that the calculation of tax liability by the MSE firms was simple that encourages performance of the MSE firms whereas 24 (25.5%) of respondents were disagree whether the calculation of tax liability by the MSE firms was simple that encourages the performance of the MSE firms and the remaining 36 (38.3%) of respondents were indifferent whether the calculation of tax liability by the MSE firms was simple that encourages performance of the MSE firms. The finding of this study revealed more than 38 percent of respondents were indifferent on the effect of tax liability calculation on performance of the MSE firm in the study area. Finally, when the effect of the transparency of the tax system on performance of the MSE firms was considered, the result of the study on table 7 shows that 3 (3.2%) of respondents were strongly agree that the transparency of the tax system applicable to the MSE firms encourages the performance of the MSE firms whereas 7 (7.4%) of respondents were strongly disagree whether the transparency of the tax system applicable to the MSE firms encourages the performance of the MSE firms. Also, the study result shows that 19 (20.2%) of respondents were agree that the transparency of the tax system applicable to the MSE firms encourages performance of MSE firms whereas 28 (29.8%) of respondents disagree whether transparency of tax system applicable to MSE firms encourages performance of MSE firms and the remaining 37 (39.4%) of respondents were indifferent whether the transparency of the tax system applicable to the MSE firms encourages the performance of the MSE firms in the study area. Tax rate: Tax rate is another major factor considered by far as the most important factor that affects the growth of the MSE business. To assess the perception of respondents on the role of tax rate on the performance of the MSE firm, respondents were requested to rate their own perception on three variables for the study. Accordingly, when the effect of the tax rate levied on the MSE on the performance of the MSE firms were considered, the result of the study on table 8 shows that 8 (8.5%) of respondents were strongly agree that the tax rate lived on the MSE firms was low that enhances the performance of MSE firms whereas 5 (5.3%) of respondents were strongly disagree whether the tax rate lived on the MSE firms was low that that enhances the performance of the MSE firms. Also, the result of the study shows that 18 (19.2%) of respondents were agree that the tax rate lived on the MSE firms was low that that encourages performance of MSE firms whereas 22 (23.4%) of respondents were disagree whether the tax rate lived on the MSE firm was low that encourages performance of MSE firm and 41 (43.6%) of respondents were indifferent whether the tax rate lived on MSE firms was low that encourages performance of MSE firms in the study area as shown by table 10 of the study. Table 8: Tax rate related factors that affect performance of the MSE firms Tax rate related characteristic Variable Frequency (%age) The tax rate levied on MSE firm was low that encourages performance of the MSE firms Strongly disagree Disagree Neutral Agree Strongly agree 5 (5.3%) 22(23.4%) 41 (43.6%) 18 (19.2%) 8 (8.5%) The tax rate lived on MSE firm was equitable that enhances performance of the MSE firms Strongly disagree Disagree Neutral Agree Strongly agree 7 (7.4%) 23 (24.5%) 39 (41.5%) 18 (19.2%) 7 (7.4%) Tax rate of MSE was effective after deduction that encourage performance of the MSE firms Strongly disagree Disagree Neutral Agree Strongly agree 9 (9.6%) 25 (26.6%) 33 (35.1%) 19 (20.2%) 8 (8.5%) Source: Own survey, 2019
- 16. THE ASSESSMENT OF TAXATION ON PERFORMANCE OF MICRO AND SMALL ENTERPRISE IN THE CASE OF NEDJO TOWN, ETHIOPIA Abdeta & Admassu. 181 Also, regarding the effect of equitable tax rate levied on the MSE firm on the performance of MSE firms, the result of the study on table 10 shows that 7 (7.4%) of respondents were strongly agree that the tax rate lived on MSE firm was equitable that enhances the performance of the MSE firms whereas 7 (7.4%) of respondents were strongly disagree whether the tax rate lived on MSE firm was equitable that enhances performance of MSE firms in the study area. Also, the result of the study shows that 18 (19.2%) of respondents were agree that the tax rate lived on MSE firm was equitable that enhances MSE performance whereas 23 (24.5%) of them disagree whether the tax rate lived was equitable that enhances MSE firms’ performance and 39 (41.5%) of them indifferent whether the tax rate lived was equitable that enhances MSE performance. Finally, when the effect of tax rate after deduction on the performance of MSE firms was considered, the result of the study on table 10 shows that 8 (8.5%) of respondent were strongly agree that the tax rate of MSE firm effective after deduction encourage the performance of the MSE firms whereas 9 (9.6%) of respondents were strongly disagree whether the tax rate after deduction encourage the performance of the MSE firms. Also, the result of the study shows that 19 (20.2%) of respondents were agree that tax the tax rate effective after deduction encourage the performance of the MSE firms whereas 25 (26.6%) of respondents were disagree whether the tax rate of MSE firm effective after deduction encourage performance of the MSE firms. However, the remaining 33 (35.1%) of respondents were indifferent whether the tax rate of MSE firm effective after deduction encourage the performance of the MSE firms in the study area. Tax administration: Tax administrations imposes a burdensome of reporting, record keeping, inspections, auditing and failing to provide transparency in tax administration operations (Atawodi & Ojeka, 2012). In order to assess the effect of tax administration on performance of the MSE firms, study participants were requested to rate their own perception from strongly agree to strangely disagree for which the results of the study were summarized by table 11 of the study. Table 9: Tax administration related factors that affect performance of MSE firms Tax administration related factors Variable Frequency (%age) The information provided by the tax administrators enhances performance of the MSE firms Strongly disagree Disagree Neutral Agree Strongly agree 5 (5.3%) 22 (23.4%) 37 (39.4%) 24(25.5%) 6 (6.4%) The technical assistance of tax administrators enhances the performance of the MSE firms Strongly disagree Disagree Neutral Agree Strongly agree 4 (4.3%) 25(26.6%) 42 (44.7%) 18 (19.1%) 5 (5.3%) The capacity of tax administrators enhances the performance of the MSE firms Strongly disagree Disagree Neutral Agree Strongly agree 7 (7.4%) 24(25.5%) 31 (33.0%) 27 (28.8%) 5 (5.3%) The honesty of tax administrators increases the performance of the MSE firms Strongly disagree Disagree Neutral Agree Strongly agree 8 (8.5%) 21 (22.3%) 37 (39.4%) 22 (23.4%) 6 (6.4%) Source: Own survey, 2019 Accordingly, the study result on table 11 shows that 6 (6.4%) of respondent were strongly agree that the information provided by tax administrators enhances the performance of the MSE firms whereas 5 (5.3%) of respondents were strongly disagree whether the information provided by the tax administrators enhances the performance of the MSE firms. Also, study shows that 24 (25.5%) of respondents were agree that the information provided by the tax administrators enhances the performance of the MSE firms whereas 22 (23.4%) of them disagree whether the information provided by the tax administrators enhances the performance of the MSE firms. However, the remaining 37 (39.4%) of respondents were indifferent whether the information provided by tax administrators enhances the performance of the MSE firms in the study area. Also, with respect to the effect technical assistance of the tax administrators on the performance of the MSE firms,
- 17. THE ASSESSMENT OF TAXATION ON PERFORMANCE OF MICRO AND SMALL ENTERPRISE IN THE CASE OF NEDJO TOWN, ETHIOPIA World J. Econs. Fin. 182 the result of the study on table 11 shows that 5 (5.3%) of respondents were strongly agree that the technical assistance of the tax administrators enhances the performance of the MSE firms whereas 4 (4.3%) of respondents were strongly disagree whether the technical assistance of the tax administrators enhances performance of the MSE firms. Also, the result of the study shows that 18 (19.1%) of respondents were agree that the technical assistance of the tax administrators enhances performance of the MSE firms whereas 25 (26.6%) of respondents were disagree whether the technical assistance of the tax administrators enhances performance of the MSE firms and the remaining 42 (44.7%) of respondents were indifferent whether the technical assistance of tax administrators enhances the performance of the MSE firms in the study area. Similarly, with respect to the effect of the capacity of tax administrators on the performance of the MSE firms, the result of the study on table 11 shows that 5 (5.3%) of respondents were strongly agree that the capacity of the tax administrators enhances the performance of the MSE firms whereas 7 (7.4%) of respondents were strongly disagree whether the capacity of the tax administrators enhances the performance of the MSE firms in the study area. Also, the result of the study shows that 27 (28.8%) of respondents were agree that the capacity of the tax administrators enhances performance of the MSE firms whereas 24 (25.5%) of respondents were disagree whether the capacity of the tax administrators enhances the performance of the MSE firms and the remaining 31 (30.0%) of respondents were indifferent whether the capacity of the tax administrators enhances performance of the MSE firms in the study area. Finally, when the effect of tax administrator’s honesty on MSE performance is considered, the result of the study on table 11 shows that 6 (6.4%) of respondent were strongly agree that the honesty of the tax administrators encourages the performance of the MSE firms whereas 8 (8.5%) of respondents were strongly disagree whether the honesty of the tax administrators encourages their MSE performance. Also, the study shows 22 (23.4%) of respondents were agree that the honesty of tax administrators encourages the performance of the MSE firms whereas 21 (22.3%) of them disagree whether the honesty of the tax administrators encourages performance of the MSE firms and 37 (37.4%) of respondents were indifferent whether the honesty of the tax administrators encourages the performance of the MSE firms in the study area. Tax level: Tax level is another factor that directly affects the business costs and capital allocation and hence the performance and the growth of the MSE firms (Nwamuo, 2017). In order to assess the effect of tax level on the performance of the MSE firms, respondents were requested to rate their own perception on four variables using structured questionnaires as shown by table 10 of the study . Table 10: Tax level related factors that affect performance of the MSE firms Tax level related factors Variable Frequency (%age) The taxes levied on MSE was fair that encourage the performance of the MSE firms Strongly disagree Disagree Neutral Agree Strongly agree 9 (9.6%) 26 (77.7%) 37 (39.3%) 18 (19.1%) 4 (4.3%) The taxes levied on MSE firms based on current tax laws boosts performance of the MSE firms Strongly disagree Disagree Neutral Agree Strongly agree 5 (5.3%) 23 (24.5%) 38 (40.4%) 22 (23.4%) 6 (6.4%) Personal income tax levied based on level of income increases the performance of the MSE firms Strongly disagree Disagree Neutral Agree Strongly agree 5 (5.3%) 22 (23.4%) 35 (37.3%) 24 (24.5%) 8 (8.5%) Business profit tax levied on the MSE firm based on the volume of profit that encourages the performance of the MSE firms Strongly disagree Disagree Neutral Agree Strongly agree 7 (7.4%) 26 (27.7%) 41 (43.6%) 15 (16.0%) 5 (5.3%) Source: Own survey, 2019 Accordingly, when the effect of fair tax levied on the MSE performance was considered, the result of the study on table 10 shows that 4 (4.3%) of respondents strongly agree that the tax levied was fair that encourage MSE
- 18. THE ASSESSMENT OF TAXATION ON PERFORMANCE OF MICRO AND SMALL ENTERPRISE IN THE CASE OF NEDJO TOWN, ETHIOPIA Abdeta & Admassu. 183 performance whereas 9 (9.6%) of them strongly disagree whether the tax levied was fair that encourage MSE performance. Also, the study shows that 18 (19.1%) of respondents were agree that the tax levied on the MSE firms was fair that encourage performance of the MSE firms whereas 26 (27.7%) of them disagree whether the tax levied on the MSE firms was fair that encourage the performance of the MSE firms and the remaining 37 (39.3%) of respondents were indifferent whether the tax levied on the MSE firms was fair that encourage performance of the MSE firms in the study area as shown by table 13 of the study. Also, with respect to the effect the tax levied on MSE performance, the study on table 12 shows that 6 (6.4%) of respondents were strongly agree that the taxes levied on MSE firm in line with the current tax laws boosts the performance of the MSE firms whereas 5 (5.3%) of respondents were strongly disagree whether the taxes levied on MSE firm in line with the current tax laws boosts performance of the MSE firms. Also, the study shows 22 (23.4%) of respondents were agree that the taxes levied on MSE firm in line with the current tax laws boosts the performance of the MSE firms whereas 23 (24.5%) of respondents were disagree whether the taxes levied on MSE firm in line with the current tax laws boosts performance of the MSE firms. Nevertheless, the remaining 38 (40.4%) of respondents were indifferent whether the taxes levied on MSE firm in line with the current tax laws boosts the performance of the MSE firms in the study area. Similarly, regarding the effect of personal income tax on MSE performance, the study on table 11 shows that 8 (8.5%) of respondents were strongly agree that personal income tax that was levied based on employee income enhances performance of the MSE firms whereas 5 (5.3%) of them strongly disagree whether personal income tax that was levied based on employee income enhances performance of the MSE firms. Also, 24 (25.5%) of respondents were agree that personal income tax that was levied based on employee income enhances performance of the MSE firms whereas 22 (23.4%) of them disagree whether personal income tax that was levied based on employee income enhances performance of the MSE firms. Conversely, the remaining 35 (37.3%) of respondents were indifferent whether personal income tax that was levied based on employee income enhances performance of the MSE firms in the study area. Finally, when the effect of business profit tax on MSE performance was considered, table 12 shows that 5 (5.3%) of respondent were strongly agree that business profit tax levied on MSE based on the volume of MSE profit encourages MSE performance whereas 7(7.4%) of respondents were strongly disagree whether business profit tax that was levied on MSE firms based on the volume of the profit of the MSE firms encourages performance of the MSE firms. Also, the result of the study shows that 15 (16.0%) of respondents were agree that business profit tax that was levied on MSE firms based on the volume of the profit of the MSE firms encourages performance of the MSE firms whereas 26 (27.7%) of respondents were disagree whether business profit tax that was levied on MSE firms based on the volume of the profit of the MSE firms encourages performance of MSE firms and the remaining 41 (43.6%) of respondents were indifferent whether business profit tax that was levied on MSE firms based on the volume of the profit of the MSE firms encourages performance of the MSE firms in the study area. Tax compliance cost: Tax compliance costs are all tax related costs incurred by the taxpayers other than the actual taxes paid to tax authority (IFC, WB, & DFID, 2009). To assess the effect of tax compliance cost on MSE performance, the finding was summarized by 13 of the study. Table 21: Tax compliance cost related factors that affect performance of MSE firms Tax compliance cost related factors Variable Frequency (%age) The timing of tax payment is convenient that encourages performance of MSE firms Strongly disagree Disagree Neutral Agree Strongly agree 7 (7.4%) 27 (28.8%) 38 (40.4%) 19 (20.2%) 3 (3.2%) The cost associated with the tax payment encourages MSE firm performance Strongly disagree Disagree Neutral Agree Strongly agree 6 (6.4%) 25 (26.5%) 36 (38.3%) 23 (24.5%) 4 (4.3%) The overall compliance cost of tax due is fair that encourages performance of MSE firms Strongly disagree Disagree Neutral Agree Strongly agree 7 (7.4%) 22 (23.4%) 36 (38.3%) 24 (25.6%) 5 (5.3%) Source: Own survey, 2019
- 19. THE ASSESSMENT OF TAXATION ON PERFORMANCE OF MICRO AND SMALL ENTERPRISE IN THE CASE OF NEDJO TOWN, ETHIOPIA World J. Econs. Fin. 184 In line with this, when the effect of the timing of tax payment on the performance of the MSE firms was considered, the result of the study on table 11 shows that 3 (3.2%) of respondents were strongly agree that the timing of tax payment was convenient that encourages the performance of the MSE firms whereas 7 (7.4%) of respondents were strongly disagree whether the timing of tax payment was convenient that encourages the performance of the MSE firms. Also, the result of the study shows that 19 (20.2%) of respondents were agree that the timing of tax payment was convenient that encourages the performance of the MSE firms whereas 27 (28.8%) of respondents were disagree whether the timing of tax payment was convenient that encourages the performance of the MSE firms in the study area. However, the remaining 38 (40.4%) of respondents were indifferent whether the timing of tax payment was convenient that encourages the performance of the MSE firms in the study area. Also, with respect to the effect of the cost associated with the tax payment on the MSE firm performance, the result of the study on table 11 shows that 4 (4.3%) of respondents were strongly agree that the cost associated with the tax payment encourages the performance the MSE firm whereas 6 (6.4%) of respondents were strongly disagree whether the cost associated with the tax payment encourages the performance the MSE firm. Also, the result of the study shows that 23 (24.5%) of respondents were agree that the cost associated with the tax payment encourages the performance the MSE firm whereas 25 (26.5%) of respondents were disagree whether the cost associated with the tax payment encourages the performance the MSE firm. Nevertheless, the remaining 36 (38.3%) of respondents were indifferent whether the cost associated with the tax payment encourages the performance the MSE firm operating in the study area. Finally, regarding the effect of the overall compliance cost of tax due on performance of the MSE firms, the result of the study on table 13 shows that 5 (5.3%) of respondents were strongly agree that the overall compliance cost of tax due was fair that encourages performance of the MSE firms whereas 7 (7.4%) of respondents were strongly disagree whether the overall compliance cost of tax due was fair that encourages performance of the MSE firms. Also, the result of the study shows that 24 (25.6%) of respondents were agree that the overall compliance cost of tax due was fair that encourages performance of the MSE firms whereas 22 (23.4%) of respondents were disagree whether the overall compliance cost of tax due was fair that encourages performance of the MSE firms. Conversely, the remaining 36 (38.3%) of respondents were indifferent whether the overall compliance cost of tax due was fair that encourages performance of the MSE firms in the study area. Multiple taxation: Multiple taxations are the phenomenon in which an income or a profit of the MSE firm is subjected to tax more than once, often by two or more different authorities in a way that may be unfair or illegal (Nwamuo, 2017; Adebisi & Gbegi, 2013). To assess the effect of multiple taxations on the performance of the MSE firms, respondents were requested to rate their own perception on three variables using structured questions summarized by table 14 of the study. Table 32: Multiple taxation related factors that affect performance of MSE firms Multiple taxation related factors Variable Frequency (%age) The prevailing tax regulation on MSE firms encourage performance of MSE firms Strongly disagree Disagree Neutral Agree Strongly agree 3 (3.2%) 19 (20.2%) 36 (38.3%) 28 (29.8%) 8 (8.5%) The multiple taxation system of MSE has no effect on performance of MSE firms Strongly disagree Disagree Neutral Agree Strongly agree 5 (5.3%) 22 (23.4%) 39 (41.5%) 21 (22.4%) 7 (7.4%) The licensing fees and costs on MSE is fair that encourages performance of MSE firms Strongly disagree Disagree Neutral Agree Strongly agree 7 (7.4%) 28 (29.8%) 39 (41.5%) 17 (18.1%) 3 (3.2%) Source: Own survey, 2019 In line with this, when the effect of the prevailing tax regulation on performance of the MSE firms was considered, the result of the study on table 12 shows that 3 (8.5%) of respondents were strongly agree that the prevailing tax regulation on the MSE firms encourage performance of the MSE firms whereas 3 (3.2%) of respondents were strongly disagree whether the prevailing tax regulation on the MSE firms encourage performance of the MSE firms. Also, the result of the study shows that 28 (29.8%) of respondents were agree that the prevailing tax
- 20. THE ASSESSMENT OF TAXATION ON PERFORMANCE OF MICRO AND SMALL ENTERPRISE IN THE CASE OF NEDJO TOWN, ETHIOPIA Abdeta & Admassu. 185 regulation on MSE firms encourage performance of the MSE firms whereas 19 (20.2%) of respondents were disagree whether the prevailing tax regulation on the MSE firms encourage the performance of the MSE firms and the remaining 36 (38.3%) of respondents were indifferent whether the prevailing tax regulation applicable to MSE firms encourage performance of the MSE firms in operating their business in the study area. Similarly, with respect to the effect of multiple taxation on performance of the MSE firms, the result of the study on table 14 shows that 7 (7.4%) of respondents were strongly agree that multiple taxation system levied on the MSE firms has no effect on performance of the MSE firms whereas 5 (5.3%) of respondents were strongly disagree whether multiple taxation system levied on the MSE firms has no effect on performance of the MSE firms. Also, the result of the study shows that 21 (22.4%) of respondents were agree that multiple taxation system levied on the MSE firms has no effect on performance of MSE firms whereas 22 (23.4%) of respondents were disagree whether multiple taxation system levied on the MSE firms has no effect on performance of the MSE firms in the study area. However, the remaining 39 (41.5%) of respondents were indifferent whether multiple taxation system levied on the MSE firms has no effect on the performance of the MSE firms in the study area. Finally, regarding the effect of the fair licensing fees and costs on performance of the MSE firms, the result of the study on table 14 shows that 3 (3.3%) of respondents were strongly agree that the licensing fees and costs was fair that encourages performance of the MSE firms whereas 7 (7.4%) of respondents were strongly disagree whether the licensing fees and costs was fair that encourages performance of the MSE firms in the study area. Also, the result of the study shows that 17 (18.1%) of respondents were agree that the licensing fees and costs was fair that encourages performance of the MSE firms whereas 28 (29.8%) of respondents were disagree the licensing fees and costs was fair that encourages performance of the MSE firms. Conversely, the remaining 39 (41.5%) of respondents were indifferent whether the licensing fees and costs was fair that encourages performance of the MSE firms in the study area. Tax education and training: Tax education and training helps taxpayers to comply with basic tax requirements, reduces errors in calculating tax liability, reduces the compliance costs and improves accounting adoption to comply with tax rules (IFC, WB, & DFID, 2009). In order to assess the effect of tax education and training on MSE performance, participants were rated on three variables using structured questions. In line with this, the study on table 16 shows that 4 (4.3%) of respondents were strongly agree that the training provided to MSE owners on tax calculation encourages the performance of the MSE firms whereas 6 (6.4%) of them strongly disagree whether the training provided on tax calculation encourages the performance of the MSE firms. Also, the study shows 18 (19.1%) of respondents were agree that the training provided to the MSE owners on tax calculation encourages the performance of the MSE firms whereas 25 (26.6%) of respondents were disagree whether the training provided to the MSE owners on tax calculation encourages the performance of the MSE firms. However, the remaining 41 (43.6%) of respondents were indifferent whether the training provided to the MSE owners on tax calculation encourages the performance of the MSE firms in the study area. Table 43: Tax education and training factors that affect performance of MSE firms Tax education and training factors Variable Frequency (%age) Training provided to MSE owners on tax calculation encourages performance of the MSE firms Strongly disagree Disagree Neutral Agree Strongly agree 6 (6.4%) 25 (26.6%) 41 (43.6%) 18 (19.1%) 4 (4.3%) Training provided to MSE owners on account record keeping enhances performance of the MSE firms Strongly disagree Disagree Neutral Agree Strongly agree 5 (5.3%) 21 (22.3%) 37 (39.4%) 25 (26.6%) 6 (6.4%) Training provided to MSE owners on audit and appeal enhances performance of the MSE firms Strongly disagree Disagree Neutral Agree Strongly agree 4 (4.3%) 23 (24.5%) 35 (37.2%) 21 (22.3%) 11 (11.7%) Training provided to MSE owners on interpretation of tax laws enhances performance of the MSE firms Strongly disagree Disagree Neutral Agree Strongly agree 8 (8.5%) 25 (26.6%) 35 (37.2%) 21 (22.4%) 5 (5.3%) Source: Own survey, 2019
- 21. THE ASSESSMENT OF TAXATION ON PERFORMANCE OF MICRO AND SMALL ENTERPRISE IN THE CASE OF NEDJO TOWN, ETHIOPIA Also, with respect to the effect of training provided on account record keeping on the performance of the MSE firms, the result of the study on table 13 shows that 6 (6.4%) of respondents were strongly agree that training provided to MSE owners on account record keeping enhances the performance of the MSE firms whereas 5 (5.3%) of respondents were strongly disagree whether training provided to MSE owners on account record keeping enhances the performance of the MSE firms. Also, the result of the study shows that 25 (26.6%) of respondents were agree that training provided to MSE owners on account record keeping enhances the performance of the MSE firms whereas 21 (22.3%) of respondents were disagree whether training provided to MSE owners on account record keeping enhances the performance of the MSE firms in the study area. Nevertheless, the remaining 37(39.4%) of respondents were indifferent whether training provided to MSE owners on account record keeping enhances the performance of the MSE firms in the study area. Similarly, regarding the effect of training provided on audit and appeal on the performance of the MSE firms, the result of the study on table 15 shows that 11 (11.7%) of respondents were strongly agree that training provided to MSE owners on audit and appeal enhances the performance of the MSE firms whereas 4 (4.3%) of respondents were strongly disagree whether training provided to MSE owners on audit and appeal enhances the performance of the MSE firms. Also, the result of the study shows that 21 (22.3%) of respondents were agree that training provided to MSE owners on audit and appeal enhances the performance of the MSE firms whereas 23 (24.5%) of respondents were disagree whether training provided to MSE owners on audit and appeal enhances the performance of the MSE firms in the study area. Conversely, the remaining 35 (37.2%) of respondents were indifferent whether training provided to MSE owners on audit and appeal enhances the performance of the MSE firms in the study area. Finally, when the effect of training provided on tax law interpretation on performance of the MSE firms was considered, the result of the study on table 15 shows that 5 (5.3%) of respondent were strongly agree that training provided to MSE owners on tax law interpretation enhances performance of the MSE firms whereas 8 (8.5%) of respondents were strongly disagree whether training provided to MSE owners on tax law interpretation enhances performance of the MSE firms. Also, the result of the study shows that 21 (24.4%) of respondents were agree that training provided to MSE owners on tax law interpretation enhances performance of the MSE firms whereas 25 (26.6%) of respondents were disagree whether training provided to MSE owners on tax law interpretation enhances performance of the MSE firms in this study. However, the remaining 35 (37.2%) of respondents were indifferent whether training provided to MSE owners on tax law interpretation enhances performance of the MSE firms in the study area. Empirical Data Analysis: Presenting the descriptive analysis alone on the assessment of taxation on performance of the MSE firm was not sufficient enough to grasp the overall association and strength that exist between Performance of the MSE firms and associated factors. To make the study complete, empirical analysis, the association of dependent (PMSE) and independent variables (factors that affect performance of MSE firms) has to be explained with the help of correlation and regression analysis. However, before proceeding the analysis, data collected has to be empirically tested. Empirical data tests: One way to ensure that measurement error is kept to a minimum is to determine properties of the measure that give us confidence that it is doing its job properly. The first property is validity, which is whether an instrument actually measures what it sets out to measure (Field, 2009). Validity is the test of how an instrument that is developed measures the particular concept it is intended to measure (Bajpai & Bajpai, 2014). Validity is a necessary but not sufficient condition of a measure. To be valid the instrument must first be reliable. The normal alpha is appropriate when items on a scale are summed to produce a single score for that scale (Field, 2009). To measure the goodness of the explanatory variable, a Cronbach’s alpha coefficient is used. A value of 0.70 to 0.80 is an acceptable value for Cronbach’s α (Garson, 2012) and values substantially lower than 0.70 indicate an unreliable scale (Field, 2009).The second is reliability, which is whether an instrument can be interpreted consistently across different situations (Field, 2009). Reliability is an indication of the stability or repeatability and consistency with which the instrument measures the concept and helps to assess the goodness of measure associated with the variances of the variables (Bajpai & Bajpai, 2014; Sekaran & Bougie, 2010). Communality presents the proportion of common variance in the variables and measure of the proportion of variance explained by the extracted factors using factor analysis. Factor analysis was dependent on the sample size. For relatively small samples (less than 100), the value of all communalities above 0.6 may be perfectly adequate (Field, 2009). In line with this, the empirical data test used for explanatory purpose commonly shown Cronbach’s α of 0.728 for 25 explanatory variable (Annex 1) which was found within the range of the acceptable ranges suggested by (Garson, 2012; Field, 2009) indicating the data used in the study was reliable for the study purposes. Similarly, the result of communalities generated by the principal component analysis for data reveals that the output of each explanatory variables shows communalities values which was above the cut of points (0.6) (Annex 2) for a sample size of 100 or less (Field, 2009) for all variables indicating data was safe to conduct empirical analysis. In addition,
- 22. THE ASSESSMENT OF TAXATION ON PERFORMANCE OF MICRO AND SMALL ENTERPRISE IN THE CASE OF NEDJO TOWN, ETHIOPIA another data test required was testing data for the problem of multicollinearity which is an unacceptable high level of inter-correlation among independent variables (Field, 2009). Multicollinearity reduces the predictive power of independent variables by the extent to which it is associated with other independent variables (Hair, Black, Babin, & Anderson, 2010). As a rule of thumb, inter correlation among independents of above 0.80 is a signal for the possible multi collinearity problem (Garson, 2012). In this study, the highest inter correlation was r=0.439 (Annex 3) observed between tax compliance cost and tax education and training independent variables which was by far below the rule of thumb (r=0.80) that was suggested by (Garson, 2012) indicating that there was no problem of multicollinearity among the independent variables used in the correlation analysis of the study. Finally, multi collinearity is another critical problem in the regression analysis. The problem of multicollinearity in regression analysis was detected by Variance Inflation Factor (VIF) and/or tolerance limit (Field, 2009). As a rule of thumb, the value of VIF has to be less than 4 and the value of tolerance limit has to be above 0.2 cut off point (Garson, 2012). In this study, the Collinearity diagnostic test shows that the maximum value of VIF was 1.530 and the lowest value of tolerance was 0.654 (Annex 4) that was observed on the tax compliance cost variable indicating as data is free from the problem of multicollinearity for the study. Correlation analysis: Correlation is the most important systems for bivariate relationships analysis that provide the yardstick whereby the intensity or strength of the relationship can be gauged (Bryman & Cramer, 2005). Bivariate analysis was conducted between each independent variable with the dependent variable to assess initial significant predictors (Hair, Black, Babin, & Anderson, 2010; Field, 2009). The two significance levels used in correlation analysis were 0.05 and 0.01. The estimates of the correlation coefficients vary between -1 and +1 values. According to Cohen and Holliday (1982) cited in (Bryman & Cramer, 2005), the correlation of 0.19 and below is very low; 0.20 to 0.39 is low; 0.40 to 0.69 is modest; 0.70 to 0.89 is high; and 0.90 to1 is very high that mostly used by most researchers in their research report writing (Bryman & Cramer, 2005). In this study, a matrix of correlation coefficients was generated along with its statistical significance using Pearson correlation to assess the association between independent variables and dependent variable (PMSE) and the finding was summarized by table 16 of the study. Table 54: Correlation (N=94) of tax related factors that affect performance of MSE firms Variables PMSE TS TR TA TL TCC MT TET SEX AGE EDCN Performance of MSE (PMSE) Corr. 1 Sig. Tax system (TS) Corr. .228* Sig. .027 Tax rate (TR) Corr. .235* .164 Sig. .023 .114 Tax administration (TA) Corr. .411** .260* .074 Sig. .000 .011 .477 Tax level (TL) Corr. .344** .126 .045 .375** Sig. .001 .225 .666 .000 Tax compliance cost (TCC) Corr. .060 .155 .017 .426** .173 Sig. .567 .135 .872 .000 .096 Multiple taxation (MT) Corr. .097 .142 -.085 .103 .132 .058 Sig. .351 .173 .418 .323 .203 .579 Tax education & training (TET) Corr. .264* -.018 .003 .261* .153 .439** .234* Sig. .010 .863 .979 .011 .142 .000 .023 Sex of respondent (SEX) Corr. .161 -.068 -.061 -.024 -.023 .094 -.068 .122 Sig. .122 .512 .561 .819 .828 .365 .515 .240 Ages in year’s (AGE) Corr. .233* -.036 .045 -.024 -.022 -.162 -.001 -.060 -.288** Sig. .024 .728 .664 .822 .833 .118 .989 .564 .005 Educational level (EDCN) Corr. .183 -.101 .062 -.070 -.004 .096 -.044 -.010 -.160 .055 Sig. .077 .333 .554 .503 .972 .355 .676 .926 .124 .596 Note: ** and * indicate that the correlation is significant at p<0.01 and p<0.05 level (2-tailed). Source: Own survey, 2019