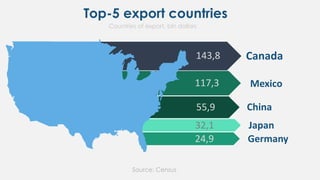
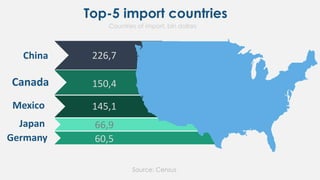
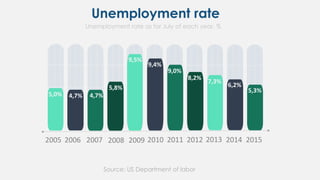
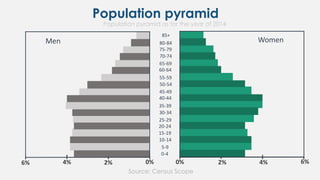
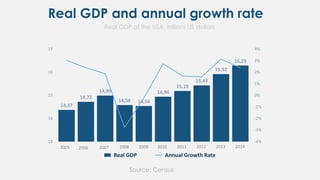
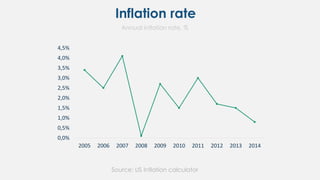
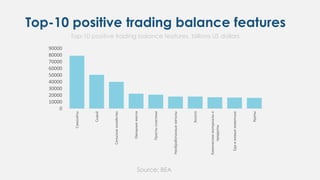
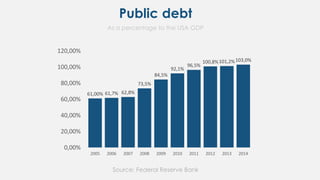
How does US economy work: 10
most important graphs
Top-5 export countries
Countries of export, bln dollars
Source: Census
143,8
55,9
117,3
24,9
32,1
Canada
Mexico
China
Japan
Germany
Top-5 import countries
Source: Census
Canada
Mexico
China
Japan
Germany
226,7
145,1
150,4
60,5
66,9
Countries of import, bln dollars
Unemployment rate
Source: US Department of labor
Unemployment rate as for July of each year, %
201520142013201220112010200920082005 2006 2007
5,0% 4,7% 4,7%
5,8%
9,5%
9,4%
9,0%
8,2%
7,3%
6,2%
5,3%
Population pyramid
Source: Census Scope
0% 2% 4% 6%
0-4
5-9
10-14
15-19
20-24
25-29
30-34
35-39
40-44
45-49
50-54
55-59
60-64
65-69
70-74
75-79
80-84
85+
6% 4% 2% 0%
Men Women
Population pyramid as for the year of 2014
Real GDP and annual growth rate
Source: Census
Real GDP of the USA, trillions US dollars
14,37
14,72
14,99
14,58 14,54
14,94
15,19
15,43
15,92
16,29
13
14
15
16
17
-4%
-3%
-2%
-1%
0%
1%
2%
3%
4%
Реальный ВВП Темпы роста ВВП
20142013201220112010200920082005 2006 2007
Real GDP Annual Growth Rate
Inflation rate
Source: US Inflation calculator
Annual inflation rate, %
0,0%
0,5%
1,0%
1,5%
2,0%
2,5%
3,0%
3,5%
4,0%
4,5%
2005 2006 2007 2008 2009 2010 2011 2012 2013 2014
Index of economic freedom
Source: 2015 Index of Economic Freedom
USA score dynamics and comparison of the rates
0-49,9
Repressed
50-59,9
Mostly unfree
60-69,9
Moderately
free
70-79,9
Mostly free
80-100
Free
Country comparisonUSA score dynamics
2011 2012 2013 2014 2015
74
75
76
77
78
79
20
World average
Region average
Free economies
0
USA
40 60 80 100
76,2
60,4
74
84,6
Top-10 positive trading balance features
Source: BEA
Top-10 positive trading balance features, billions US dollars
0
10000
20000
30000
40000
50000
60000
70000
80000
90000
Самолёты
Сырьё
Сельскоехозяйство
Овощныемасла
Простыпластики
Необработанныеметалы
Золото
Химическиематериалыи
продукты
Едаиживыеживотные
Крупы
Net direct investments in the world
Source: BEA
Net direct investments in the world and USA, trillions US dollars
-50 0,5
direct investments,
trillions dollars
Public debt
Source: Federal Reserve Bank
As a percentage to the USA GDP
61,00% 61,7% 62,8%
73,5%
84,5%
92,1%
96,5%
100,8%101,2%103,0%
0,00%
20,00%
40,00%
60,00%
80,00%
100,00%
120,00%
2005 2006 2007 2008 2009 2010 2011 2012 2013 2014

Danylo pyrogov us_economy

  • 1.
    How does USeconomy work: 10 most important graphs
  • 2.
    Top-5 export countries Countriesof export, bln dollars Source: Census 143,8 55,9 117,3 24,9 32,1 Canada Mexico China Japan Germany
  • 3.
    Top-5 import countries Source:Census Canada Mexico China Japan Germany 226,7 145,1 150,4 60,5 66,9 Countries of import, bln dollars
  • 4.
    Unemployment rate Source: USDepartment of labor Unemployment rate as for July of each year, % 201520142013201220112010200920082005 2006 2007 5,0% 4,7% 4,7% 5,8% 9,5% 9,4% 9,0% 8,2% 7,3% 6,2% 5,3%
  • 5.
    Population pyramid Source: CensusScope 0% 2% 4% 6% 0-4 5-9 10-14 15-19 20-24 25-29 30-34 35-39 40-44 45-49 50-54 55-59 60-64 65-69 70-74 75-79 80-84 85+ 6% 4% 2% 0% Men Women Population pyramid as for the year of 2014
  • 6.
    Real GDP andannual growth rate Source: Census Real GDP of the USA, trillions US dollars 14,37 14,72 14,99 14,58 14,54 14,94 15,19 15,43 15,92 16,29 13 14 15 16 17 -4% -3% -2% -1% 0% 1% 2% 3% 4% Реальный ВВП Темпы роста ВВП 20142013201220112010200920082005 2006 2007 Real GDP Annual Growth Rate
  • 7.
    Inflation rate Source: USInflation calculator Annual inflation rate, % 0,0% 0,5% 1,0% 1,5% 2,0% 2,5% 3,0% 3,5% 4,0% 4,5% 2005 2006 2007 2008 2009 2010 2011 2012 2013 2014
  • 8.
    Index of economicfreedom Source: 2015 Index of Economic Freedom USA score dynamics and comparison of the rates 0-49,9 Repressed 50-59,9 Mostly unfree 60-69,9 Moderately free 70-79,9 Mostly free 80-100 Free Country comparisonUSA score dynamics 2011 2012 2013 2014 2015 74 75 76 77 78 79 20 World average Region average Free economies 0 USA 40 60 80 100 76,2 60,4 74 84,6
  • 9.
    Top-10 positive tradingbalance features Source: BEA Top-10 positive trading balance features, billions US dollars 0 10000 20000 30000 40000 50000 60000 70000 80000 90000 Самолёты Сырьё Сельскоехозяйство Овощныемасла Простыпластики Необработанныеметалы Золото Химическиематериалыи продукты Едаиживыеживотные Крупы
  • 10.
    Net direct investmentsin the world Source: BEA Net direct investments in the world and USA, trillions US dollars -50 0,5 direct investments, trillions dollars
  • 11.
    Public debt Source: FederalReserve Bank As a percentage to the USA GDP 61,00% 61,7% 62,8% 73,5% 84,5% 92,1% 96,5% 100,8%101,2%103,0% 0,00% 20,00% 40,00% 60,00% 80,00% 100,00% 120,00% 2005 2006 2007 2008 2009 2010 2011 2012 2013 2014