Download to read offline


![197
frailty, causing individuals to be dependent
on others.121
The prevalence levels of
dependency have been shown to be an
important determinant of long-term care
expenditure. As in the field of health care,
there is an on-going debate on the future
developments of disability122
, defined as
some form of functional impairment of the
individual. Nevertheless, what determines the
demand for long-term care and therefore
expenditure is not only the measure of
disability, but also the extent to which this
disability transfers into dependency, and
therefore requires some kind of long-term
care provision.
Disability depends on a person’s perception
of his/her ability to perform activities
associated with daily living and eventually
this "subjective" need for long-term care will
not necessarily transfer into actual demand
and/or provision of LTC. This subjectivity is
related to social and cultural considerations.
In addition, the legal definition of
"dependency" – the level of dependency
opening a right to the provision of long-term
care – differs widely from one Member State
to another, preventing full data
comparability. It also contributes to
explaining the observed variations in
provision and expenditure across countries.
121
Dependency refers to the inability to perform daily
personal care tasks. It is often referred to as "ADL-
dependency" i.e. difficulties in performing at least one
Activity of Daily Living (ADL).
122
A key question for the purposes of making long-
term care projections is of course whether, as life
expectancy increases, dependency levels by (older)
age will increase, remain constant or decrease. Recent
empirical evidence has not come to a clear conclusion
regarding these hypotheses. International evidence
suggests that health may continue to improve, but
some causes of disability may at the same time
become more prominent. Some of those identified
have direct incidence on the frailty of longer-living
elderly. In particular, the number of people with a
diagnosis of dementia (Alzheimer) is expected to
increase. On the other hand, certain studies have noted
that, as life expectancy increases, the incidence of
severe disability is postponed, leading to a reduction
in the prevalence of severe disability for some age-
groups (see Robine and Michel, 2004).
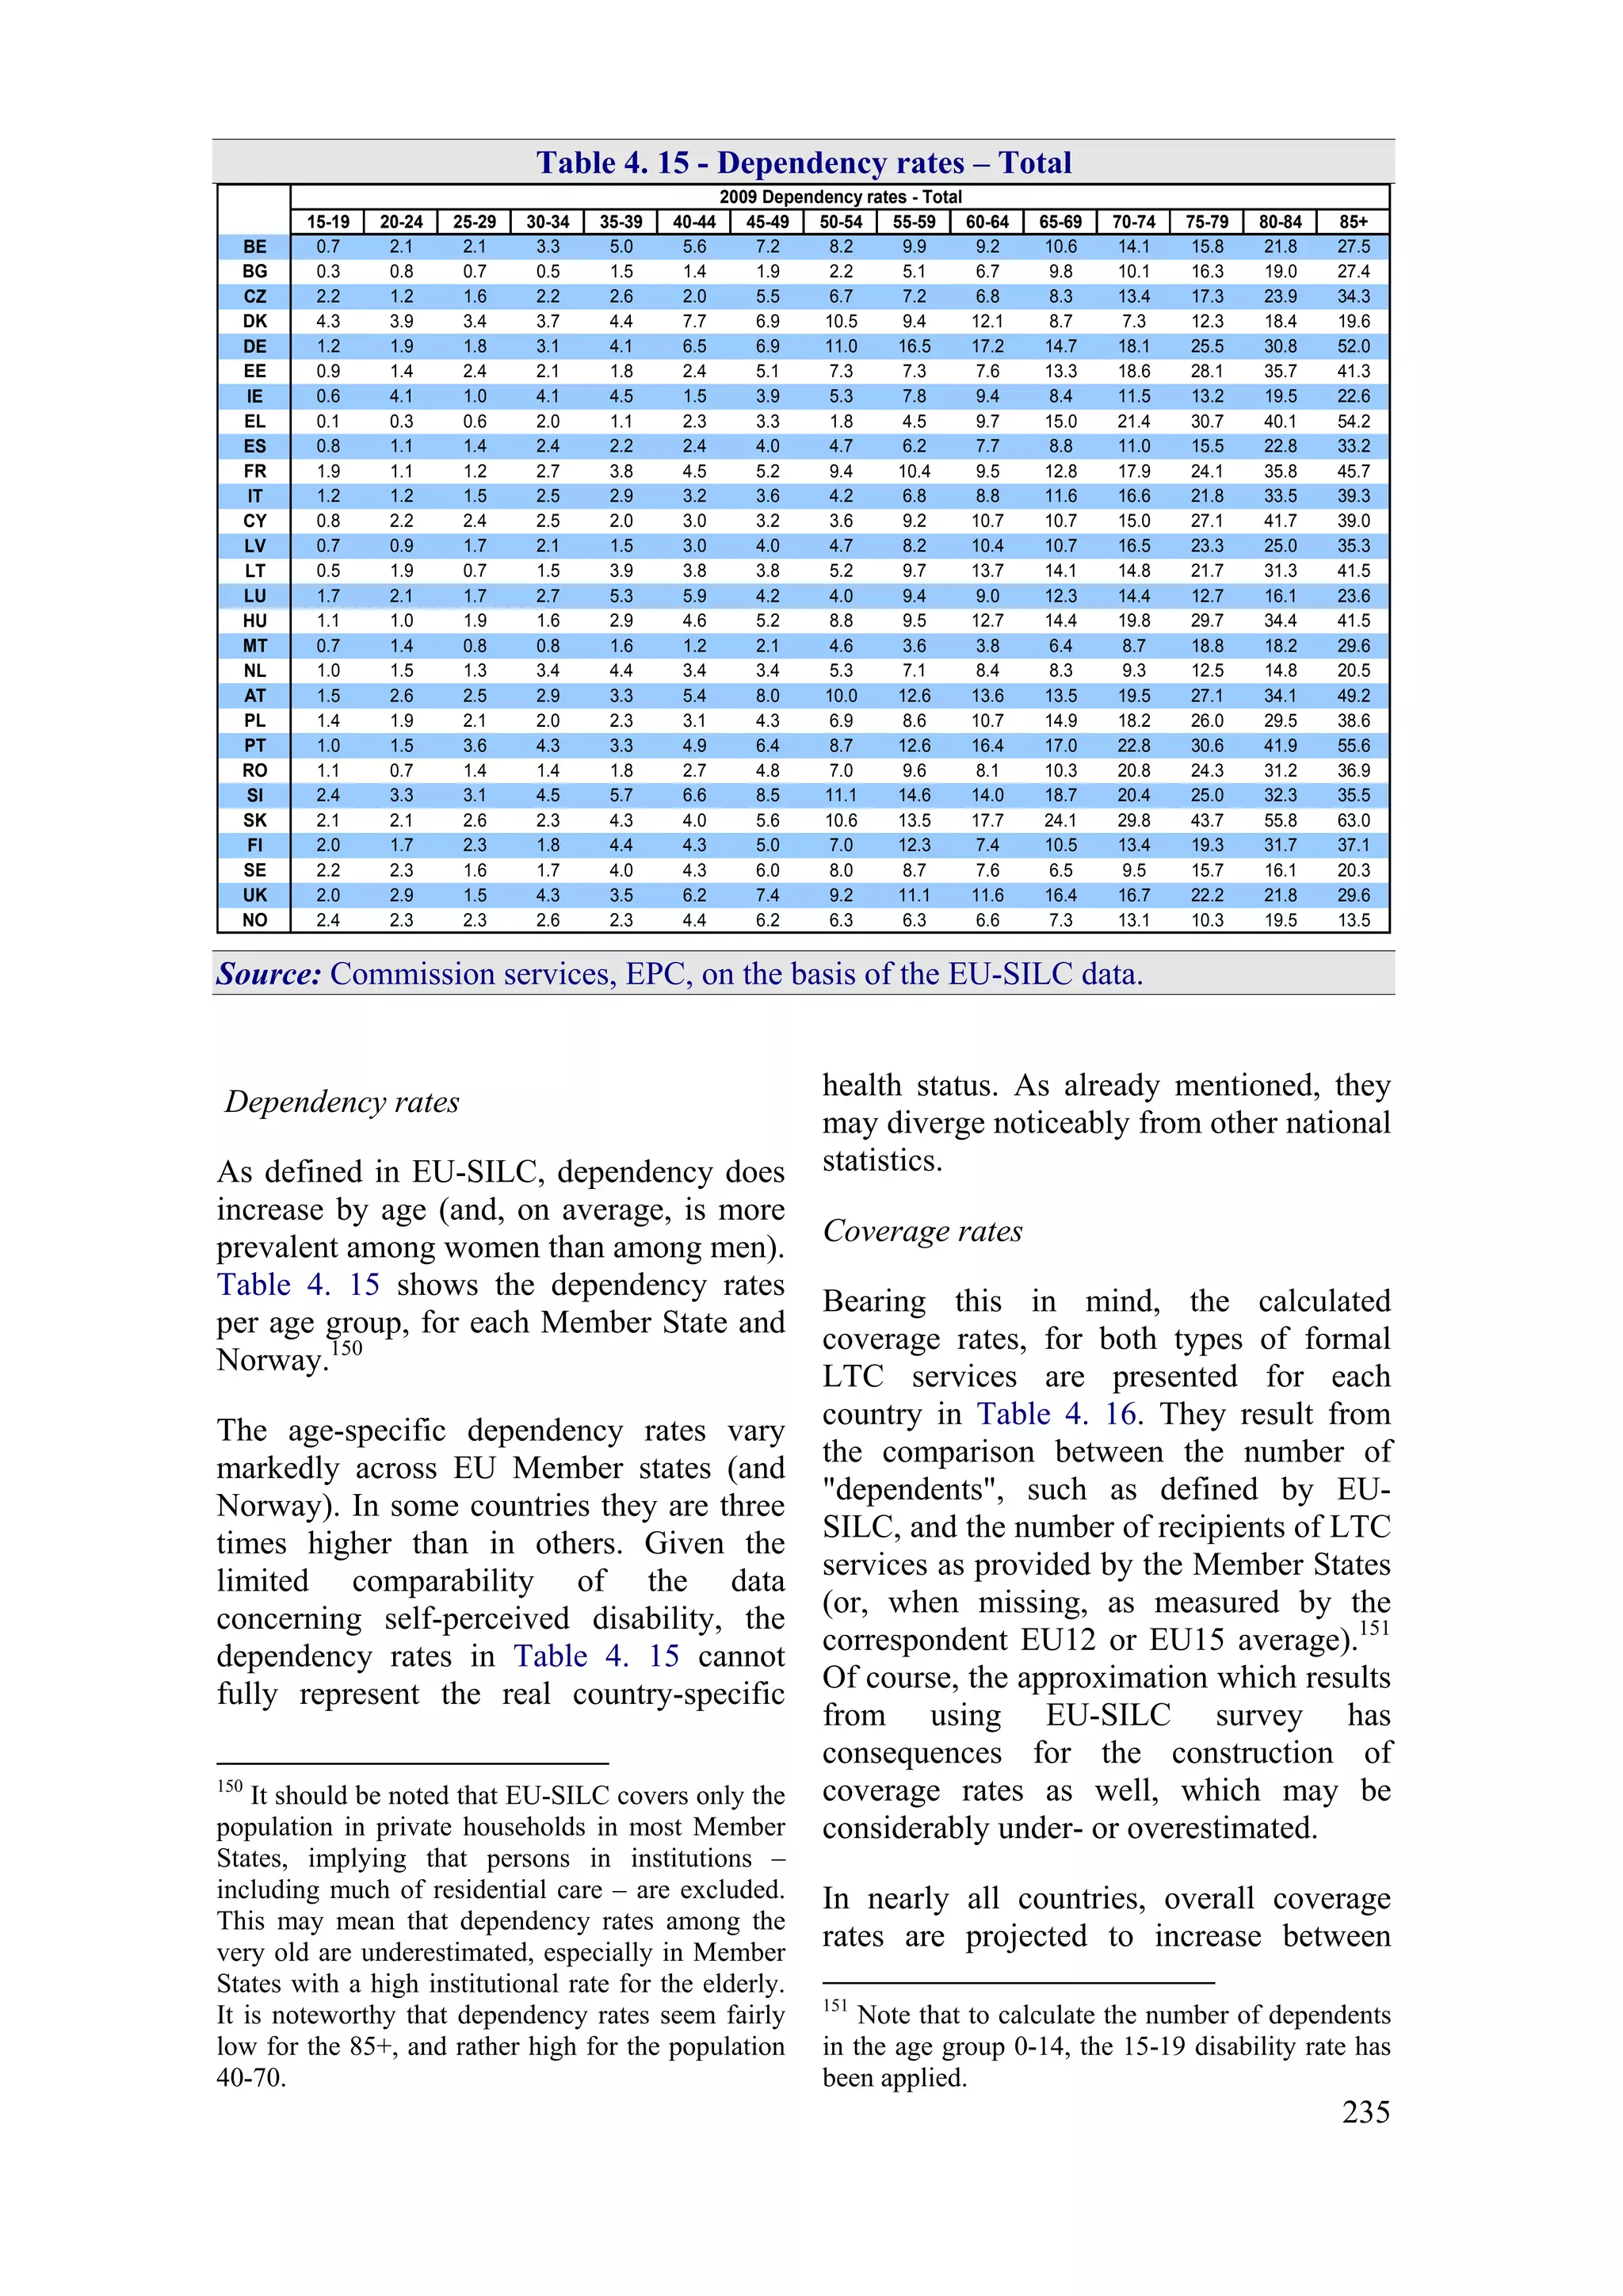
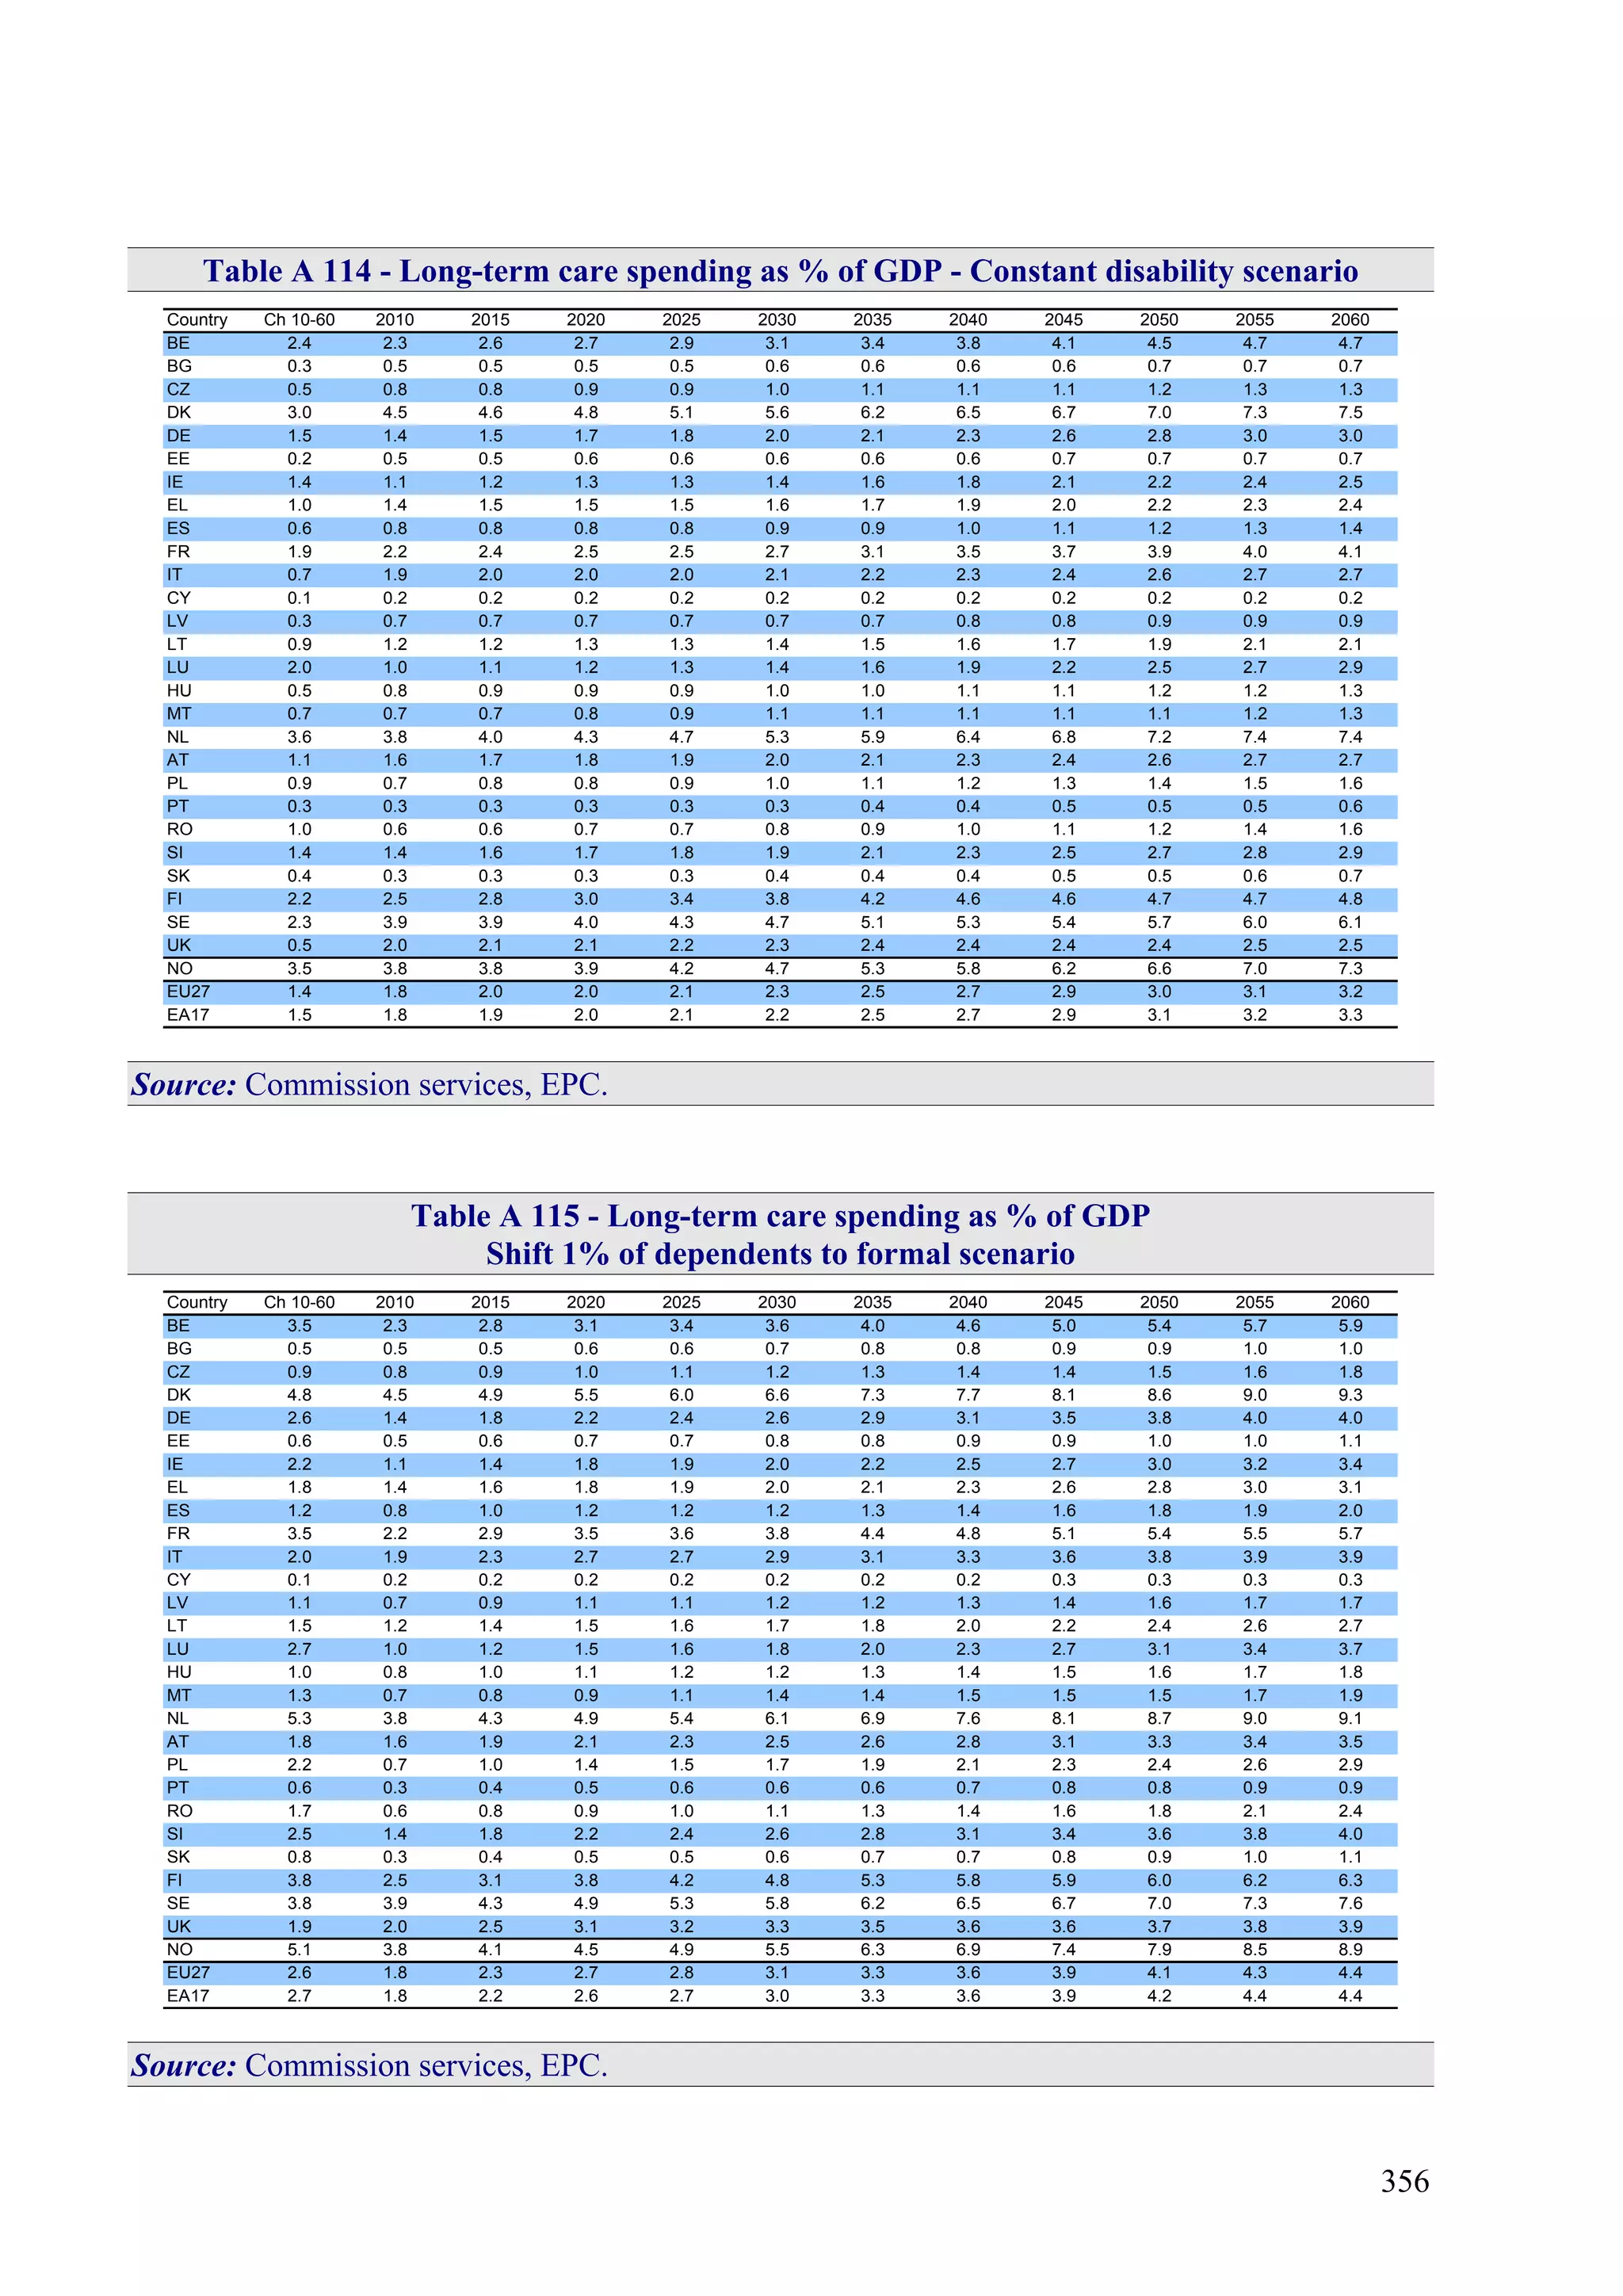
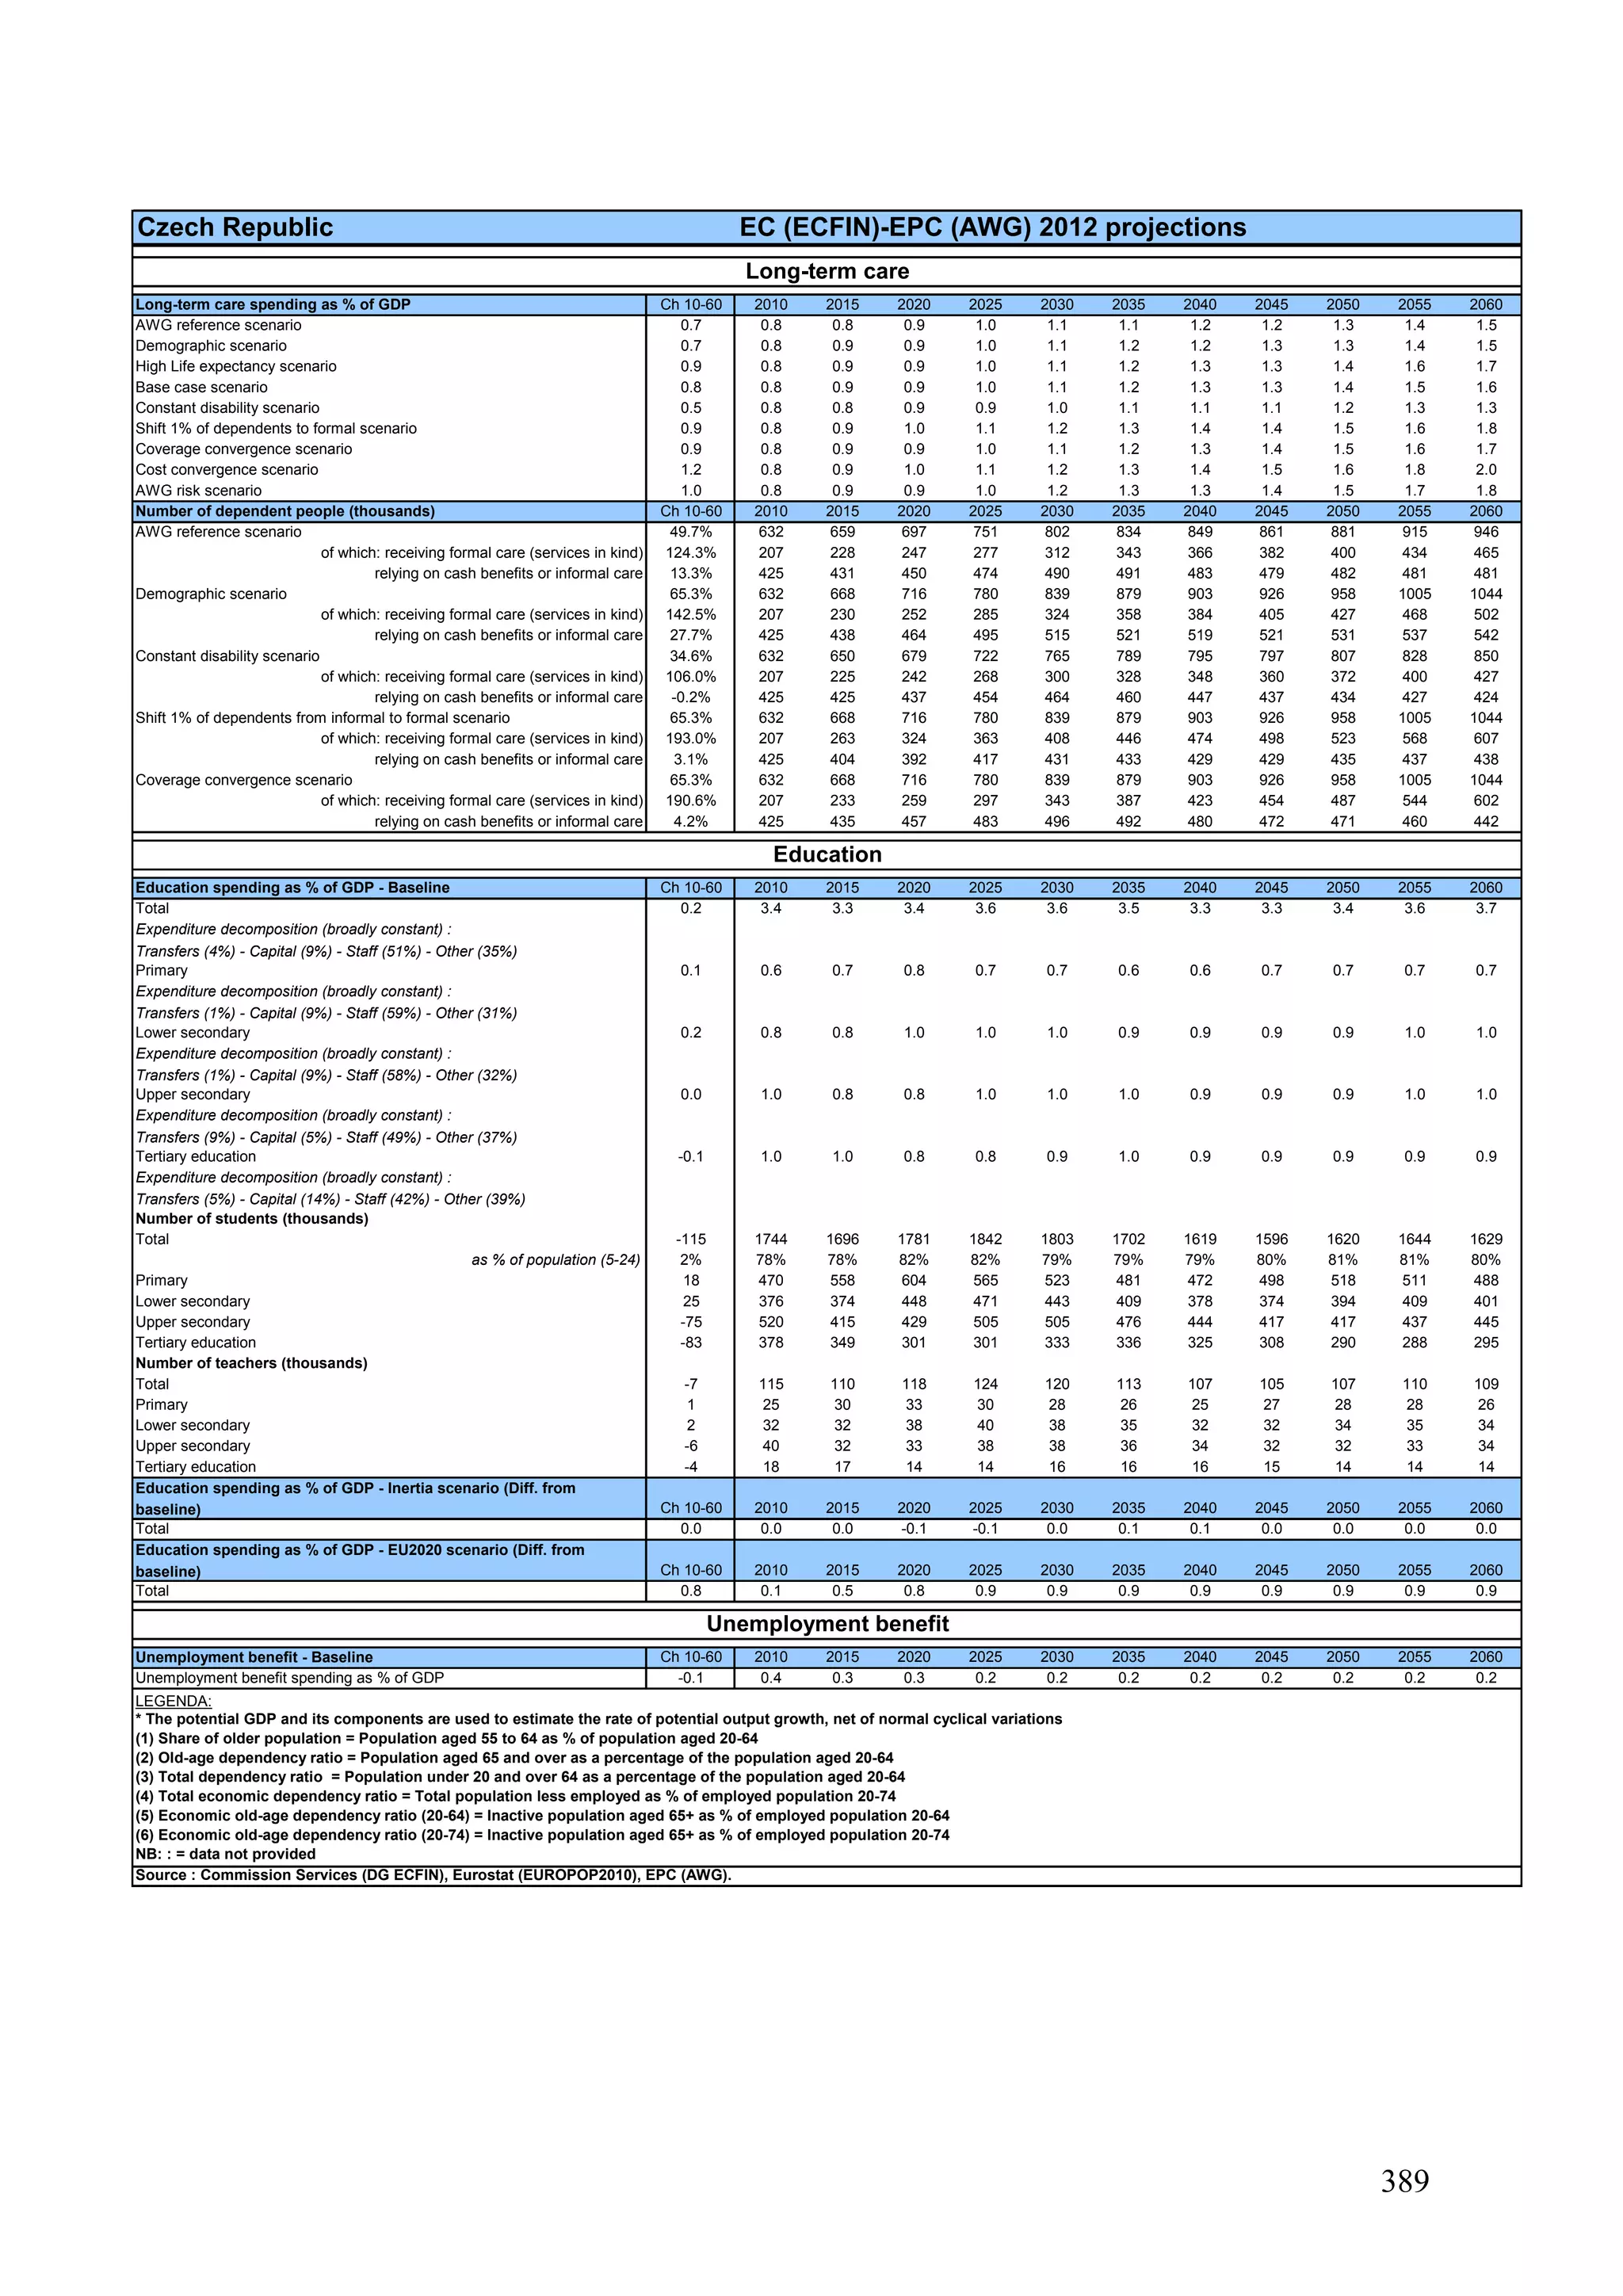
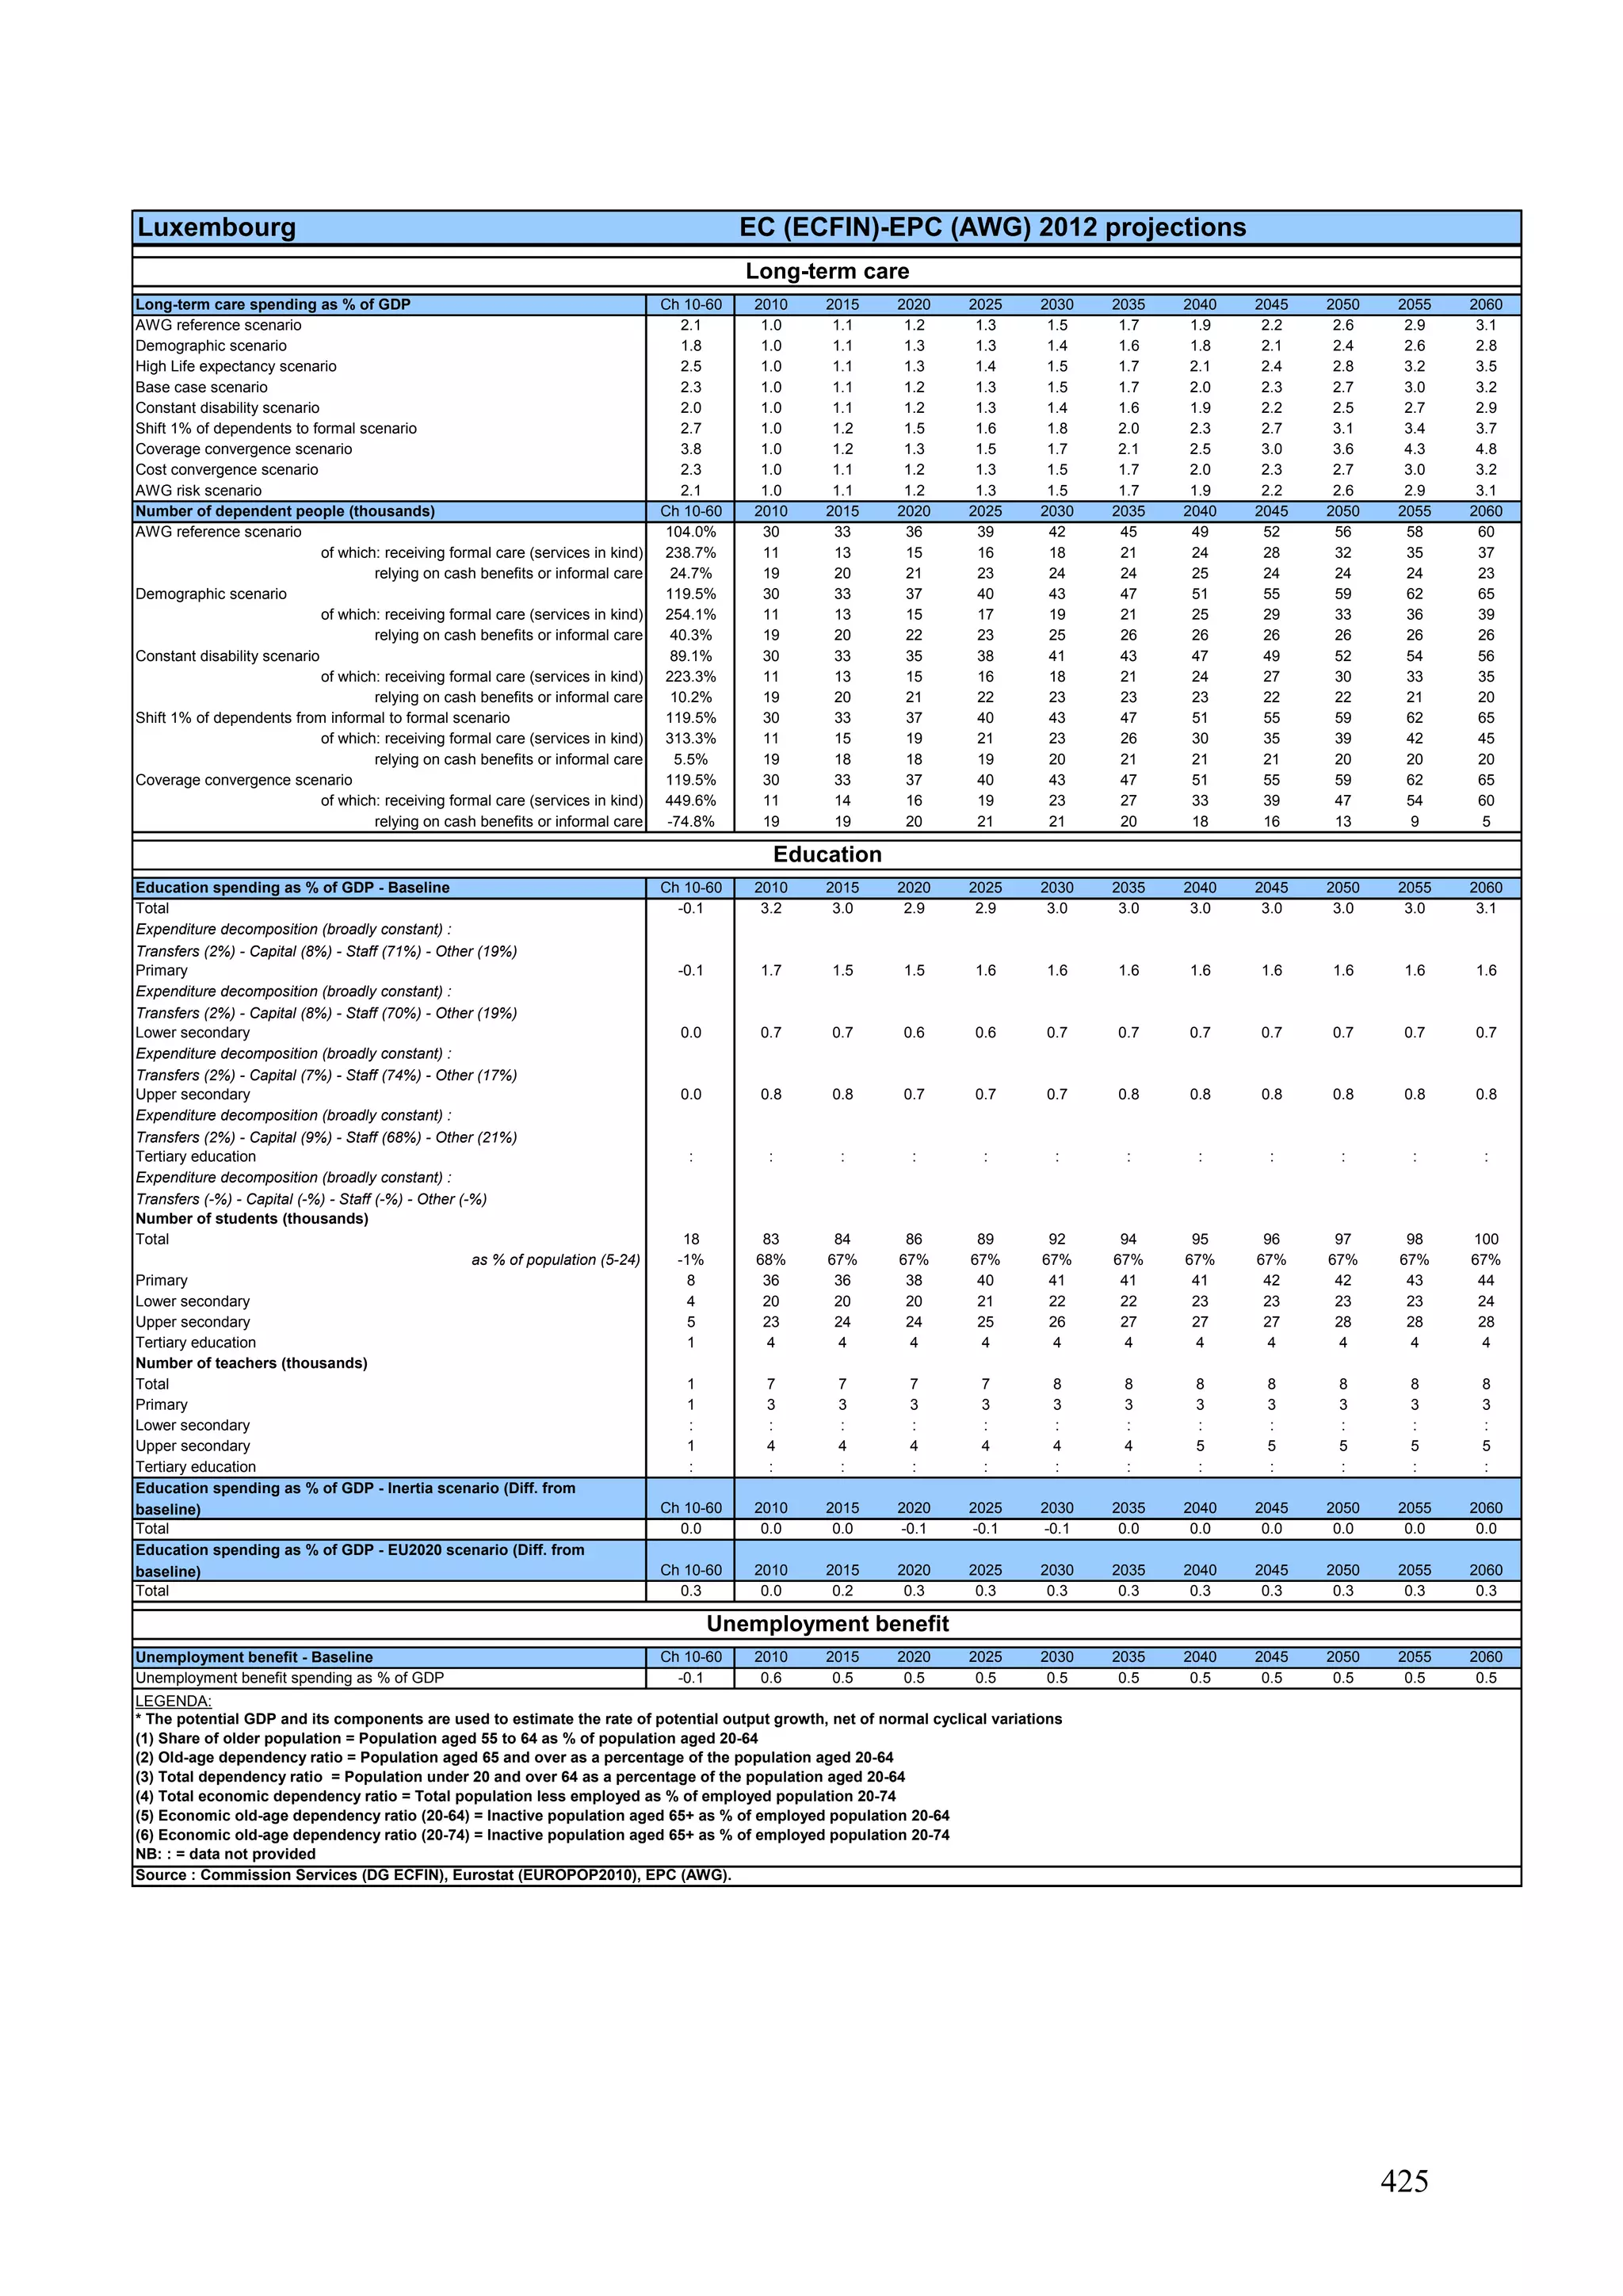
The projected numbers of dependent people
is a key element in the projected cost
developments. For this projection exercise, a
common definition of disability and therefore
dependency is used for all countries – the
EU-SILC definition123
- adjusted for each
country to the number of recipients (by age
groups) when this was provided.124
4.2.3. Patterns of long-term care
provision
The extent to which 1) a country relies on
formal care (rather than informal care), and
2) in-kind formal care is provided in
institutions or at home, is put forward as a
crucial determinant of public expenditure on
long-term care. Indeed, 1) informal care is
still often seen by governments as "free" –
i.e. privately paid – and 2) institutional care
is considered as much more costly than home
care, even though it still generally concerns
different levels of care, and the difference is
much less clear for very severe cases. Yet,
there is an increasing interest for the
"opportunity costs" derived from informal
care: the impact on labour market and
productivity, as well as on carers' health
status itself.
The governments of most EU Member States
are involved in either the provision or
financing of long-term care services, or often
both, although the extent and nature of their
123
To calculate disability rates, the AWG, based on
the proposal in the February 2011 Commission's note
on HC and LTC data availability, decided to use the
EU-SILC item "Limitation in activities because of
health problems [for at least the last 6 months]". In
order to clarify the relation and to follow the usual
eligibility conditions of public schemes, it is
commonly accepted that the disability levels
accounted for are those categorized as "severe". This
is the only measure of dependency available for all
Member States and Norway. Note, though, that the
relevant EU-SILC question does not specify the
activities that the respondent should consider, nor
offer a description of what is meant by "severe
limitation". This implies that the subjective
assessment by the respondent plays a more important
role than is typically the case when assessing legal
eligibility for public LTC.
124
See Annex I.](https://image.slidesharecdn.com/the2012ageingreport-140627171641-phpapp01/75/The-2012-ageing-report-199-2048.jpg)
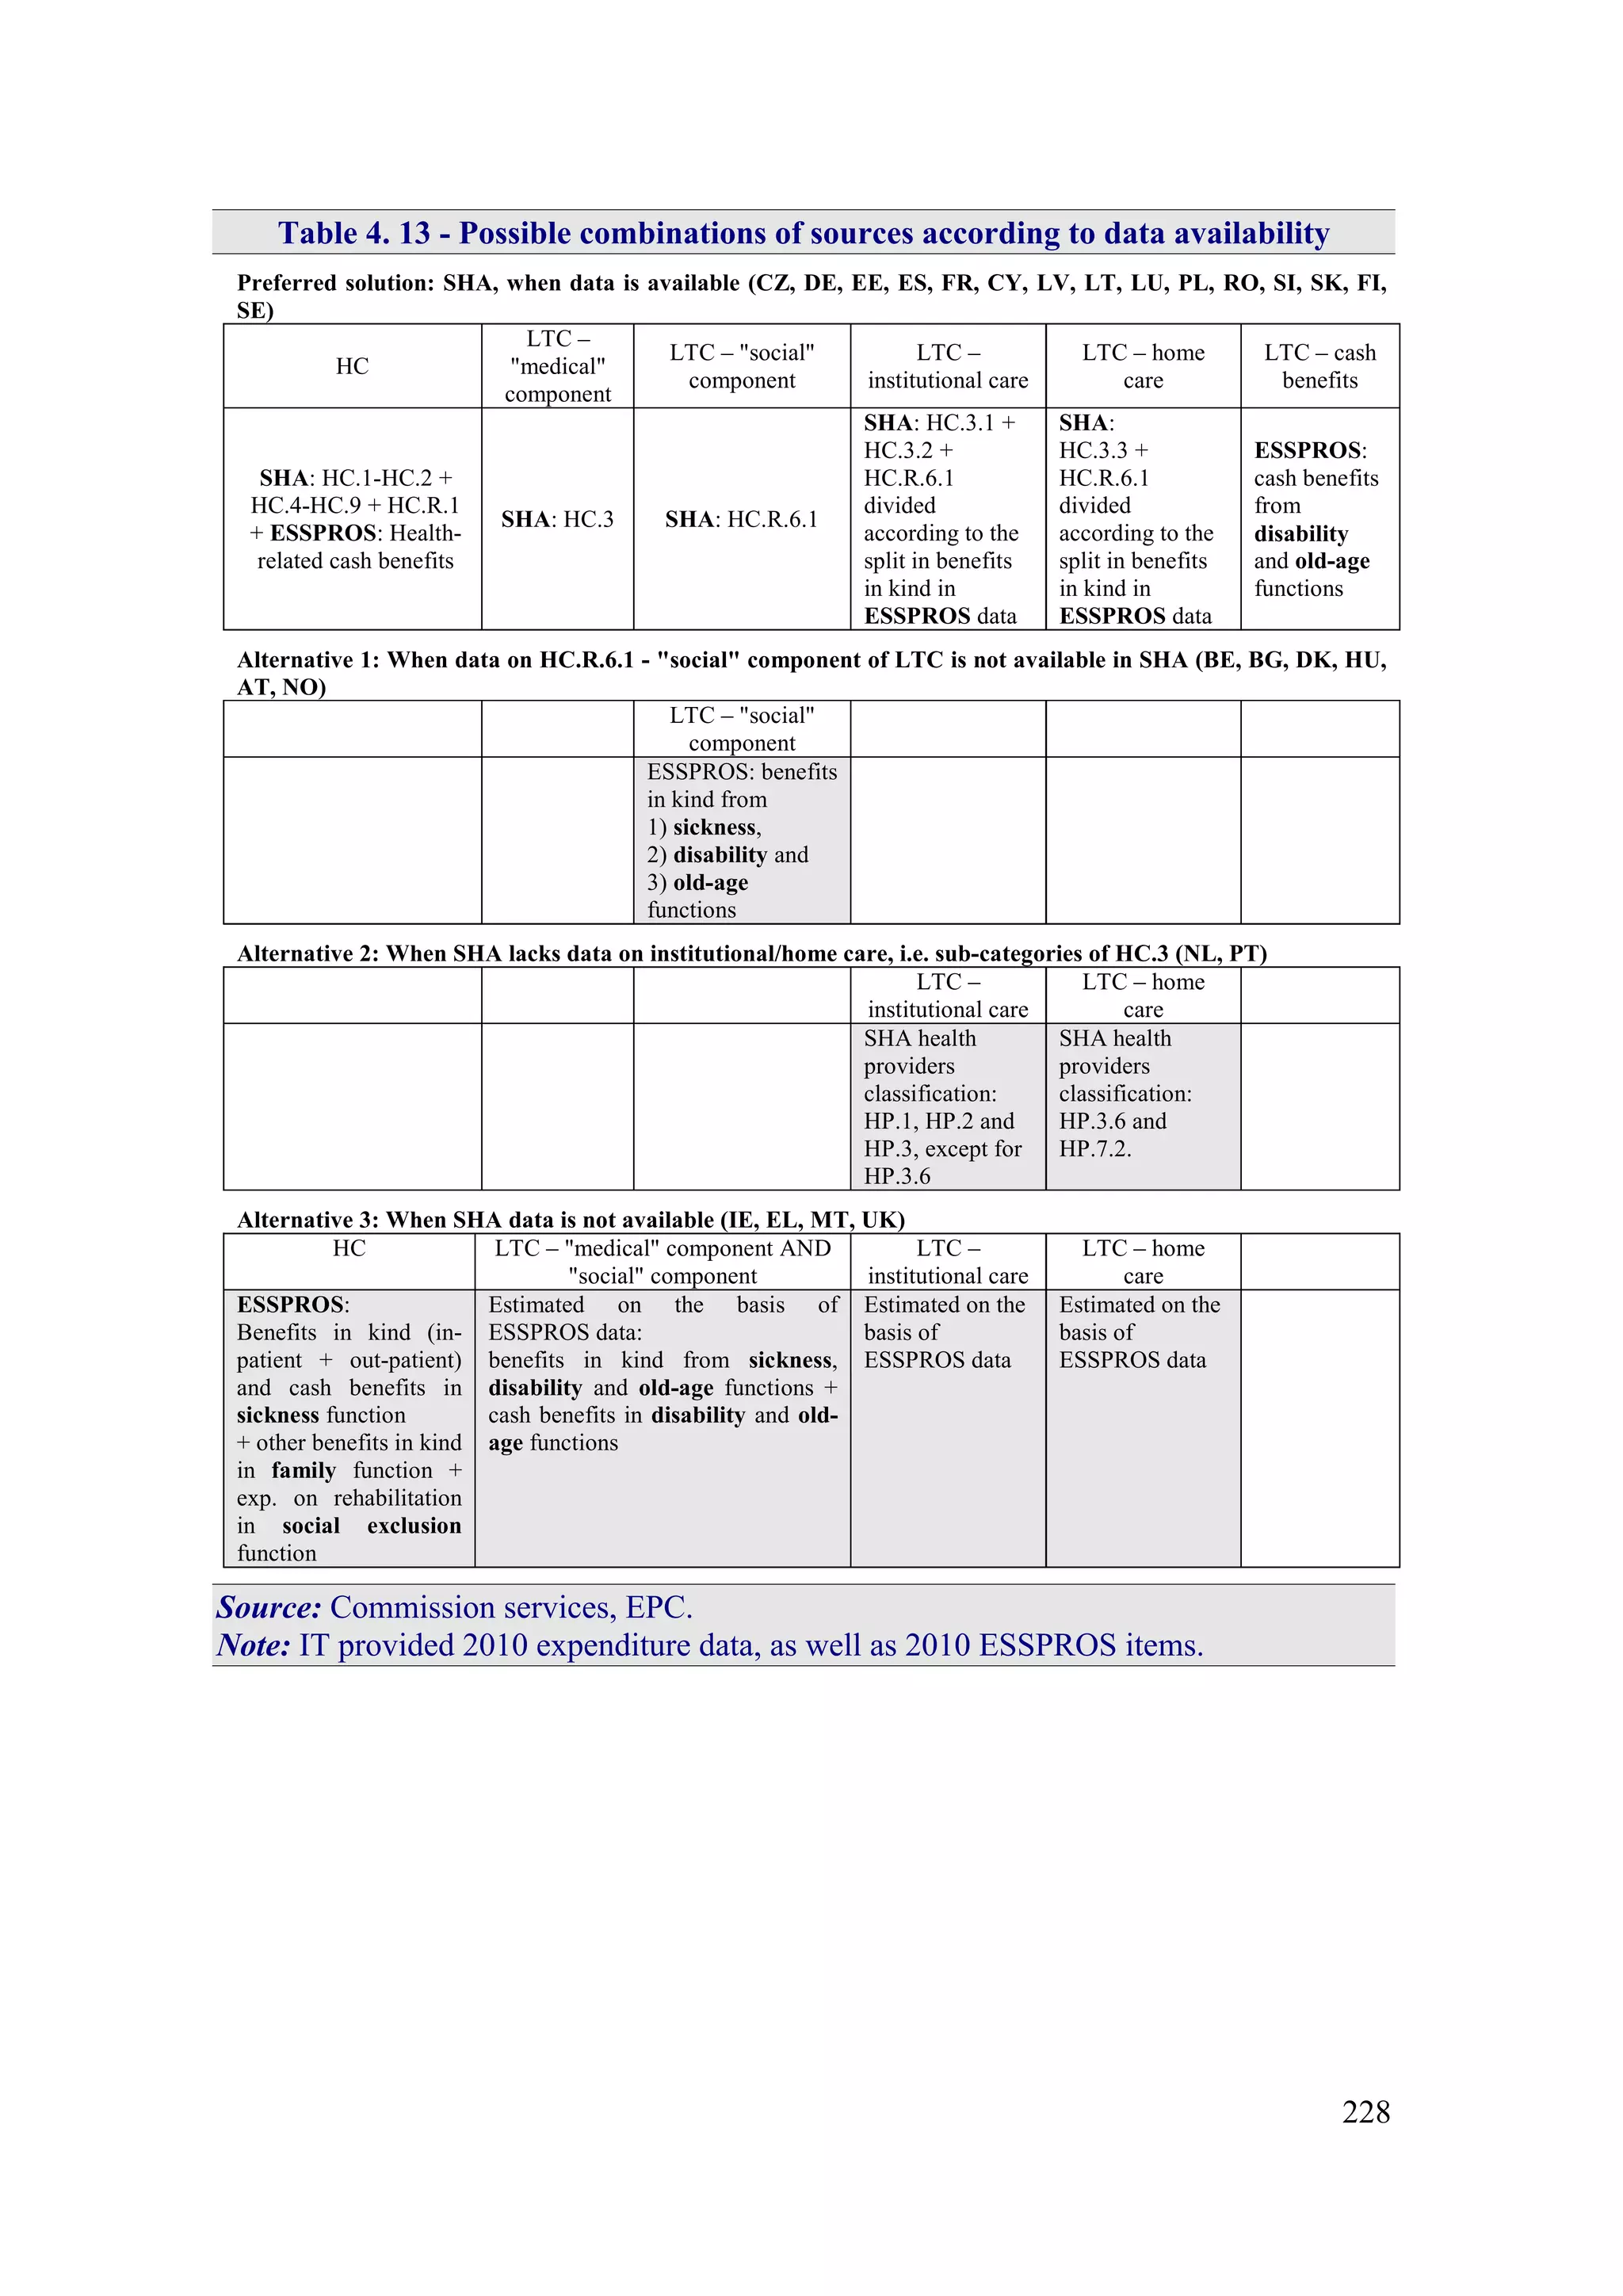
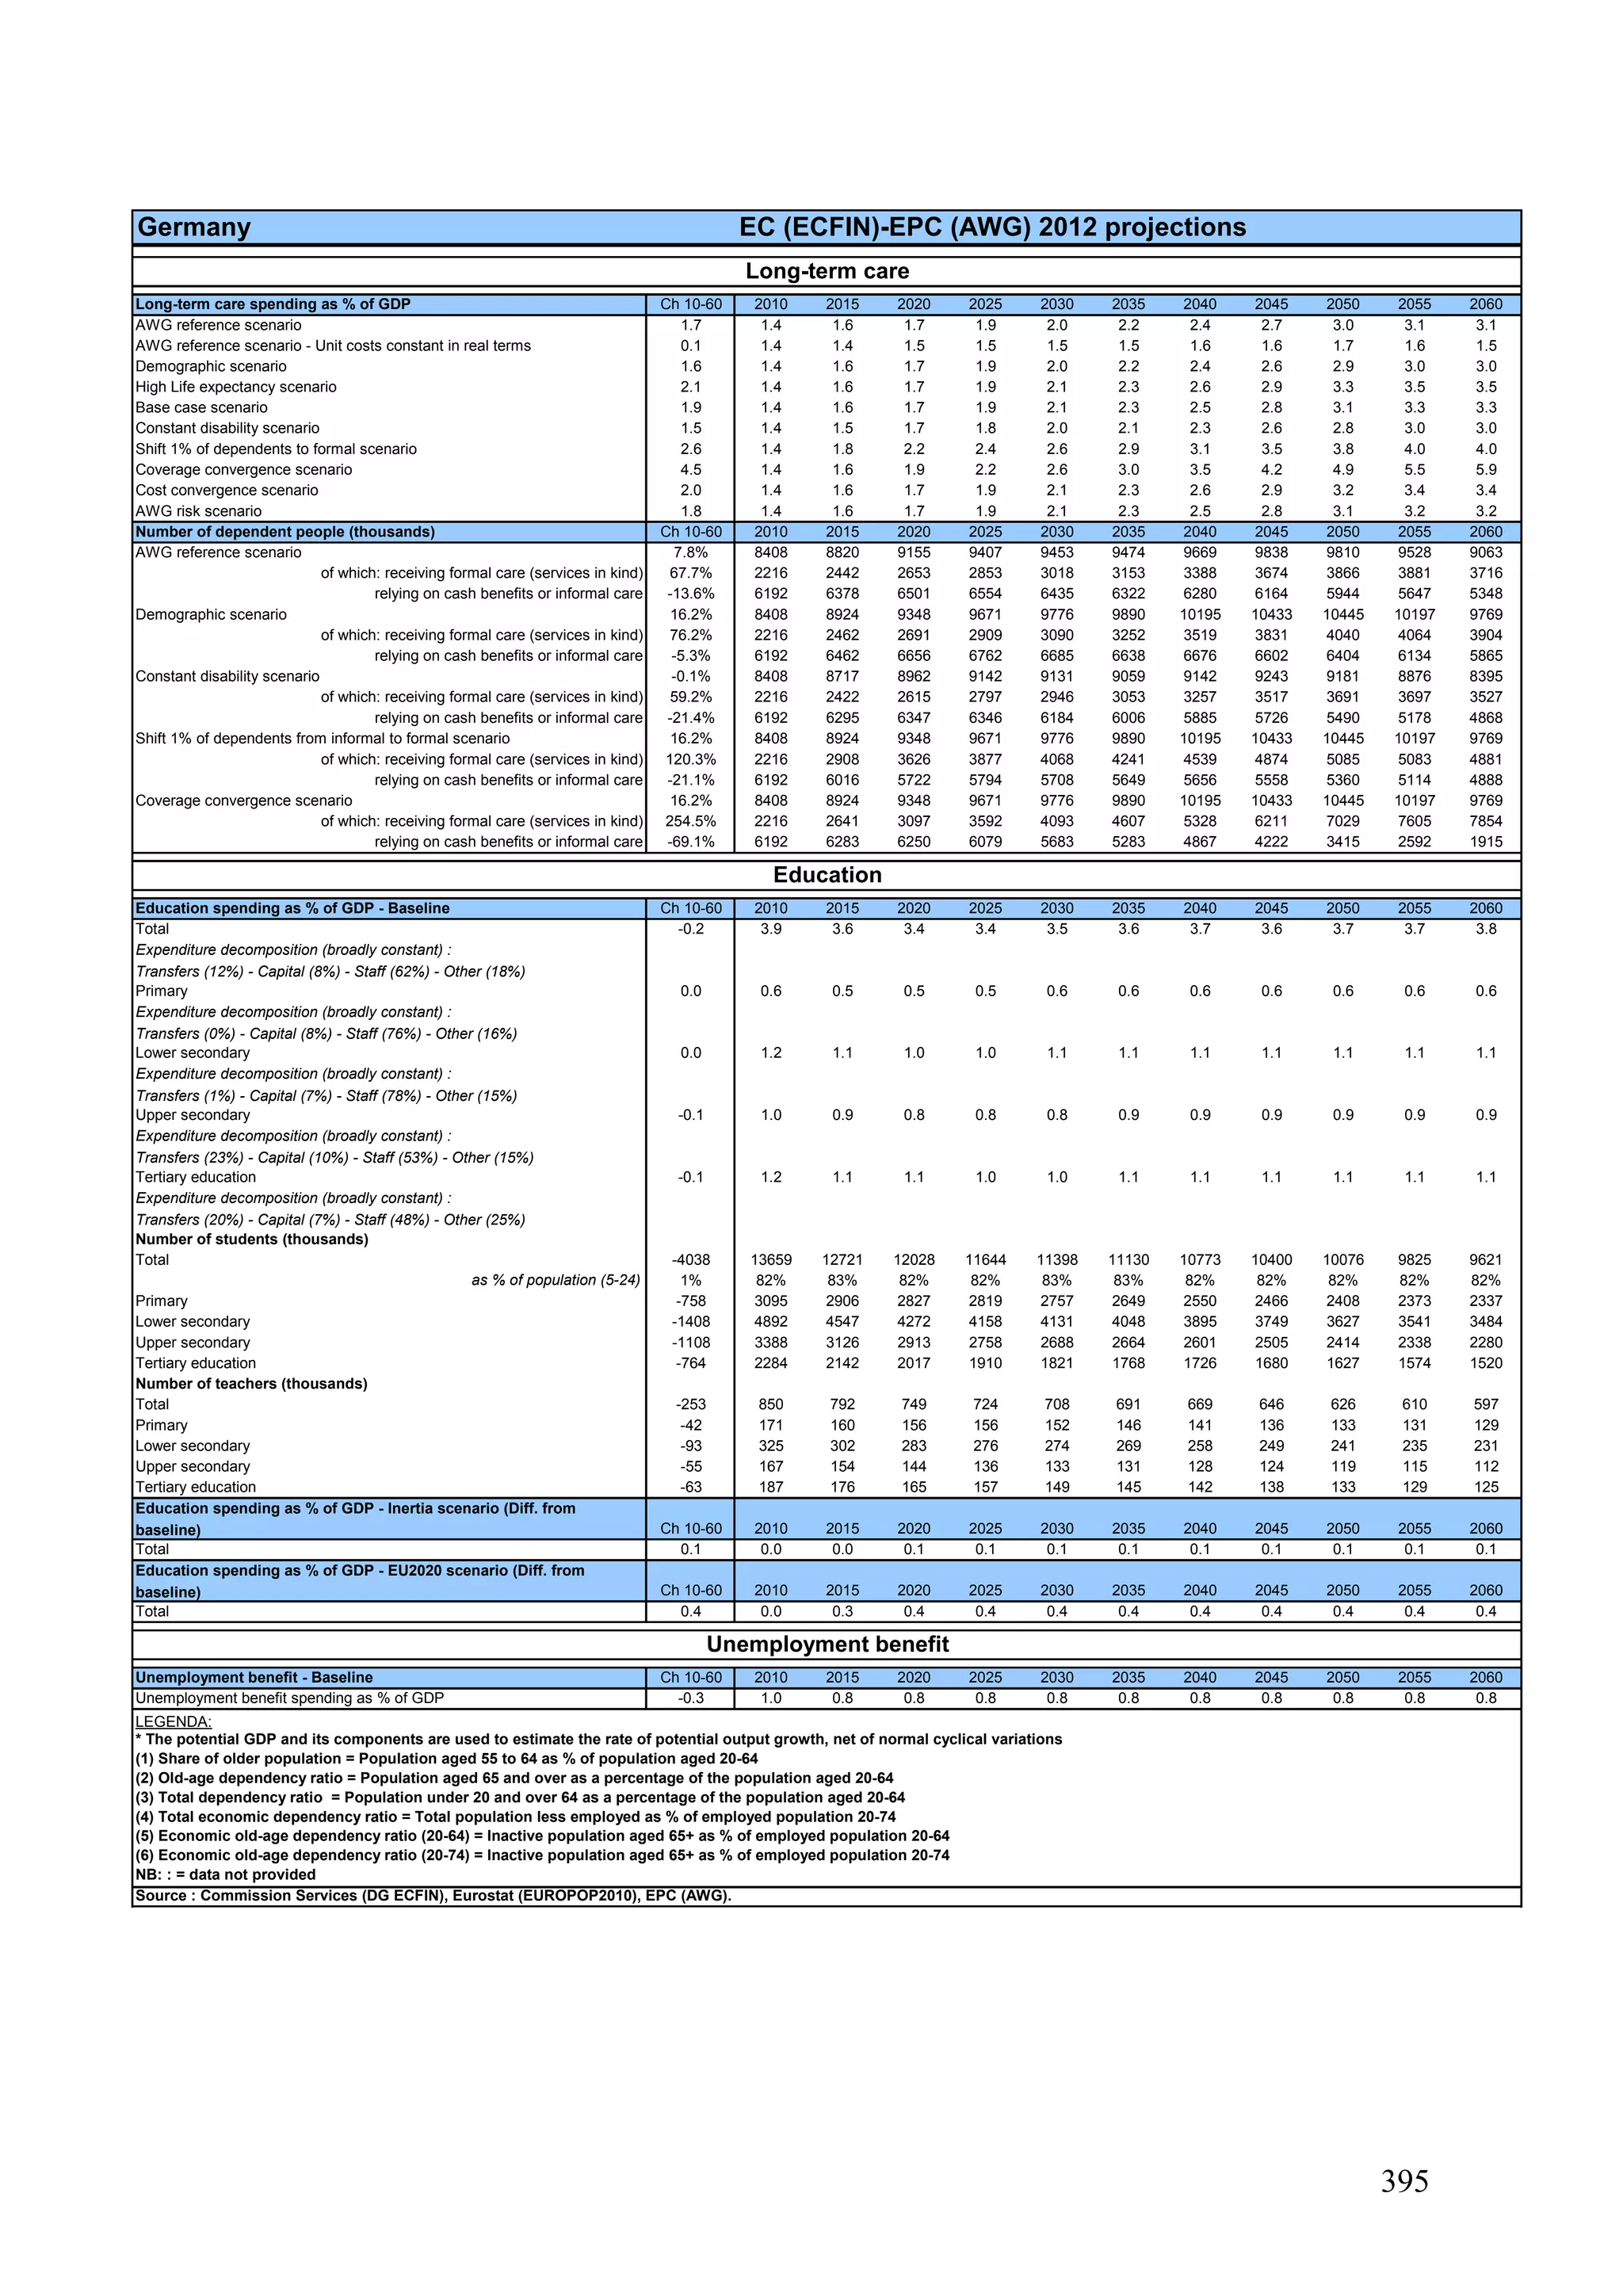
![227
countries not using the SHA joint
questionnaire or not reporting HC.R.6,
proxies have been calculated on the basis
of ESSPROS data.145
2) Long-term care related cash benefits
Long-term care related cash benefits are
reported within two ESSPROS
functions146
: "Disability" and "Old Age".
Thus, both periodic and lump-sum parts of
care allowances and economic integration
in the Disability function, as well as
periodic care allowance in the Old Age
function are generally added, as cash
benefits, to the HC.3+HC.R.6.1 sum or to
the correspondent ESSPROS sum as
calculated above.
Moreover, the SHA joint questionnaire
data by sub-categories of long-term
nursing care (HC.3) – i.e. inpatient, day
cases, and home care – and ESSPROS data
by type of benefits in kind are used to
identify the two components of total public
expenditure: home care and institutional
care. We then proceed to calculate the part
of HC.R.6.1 which constitutes home care
and the part which constitutes institutional
care, through proxies calculated on the
basis of the ESSPROS data.
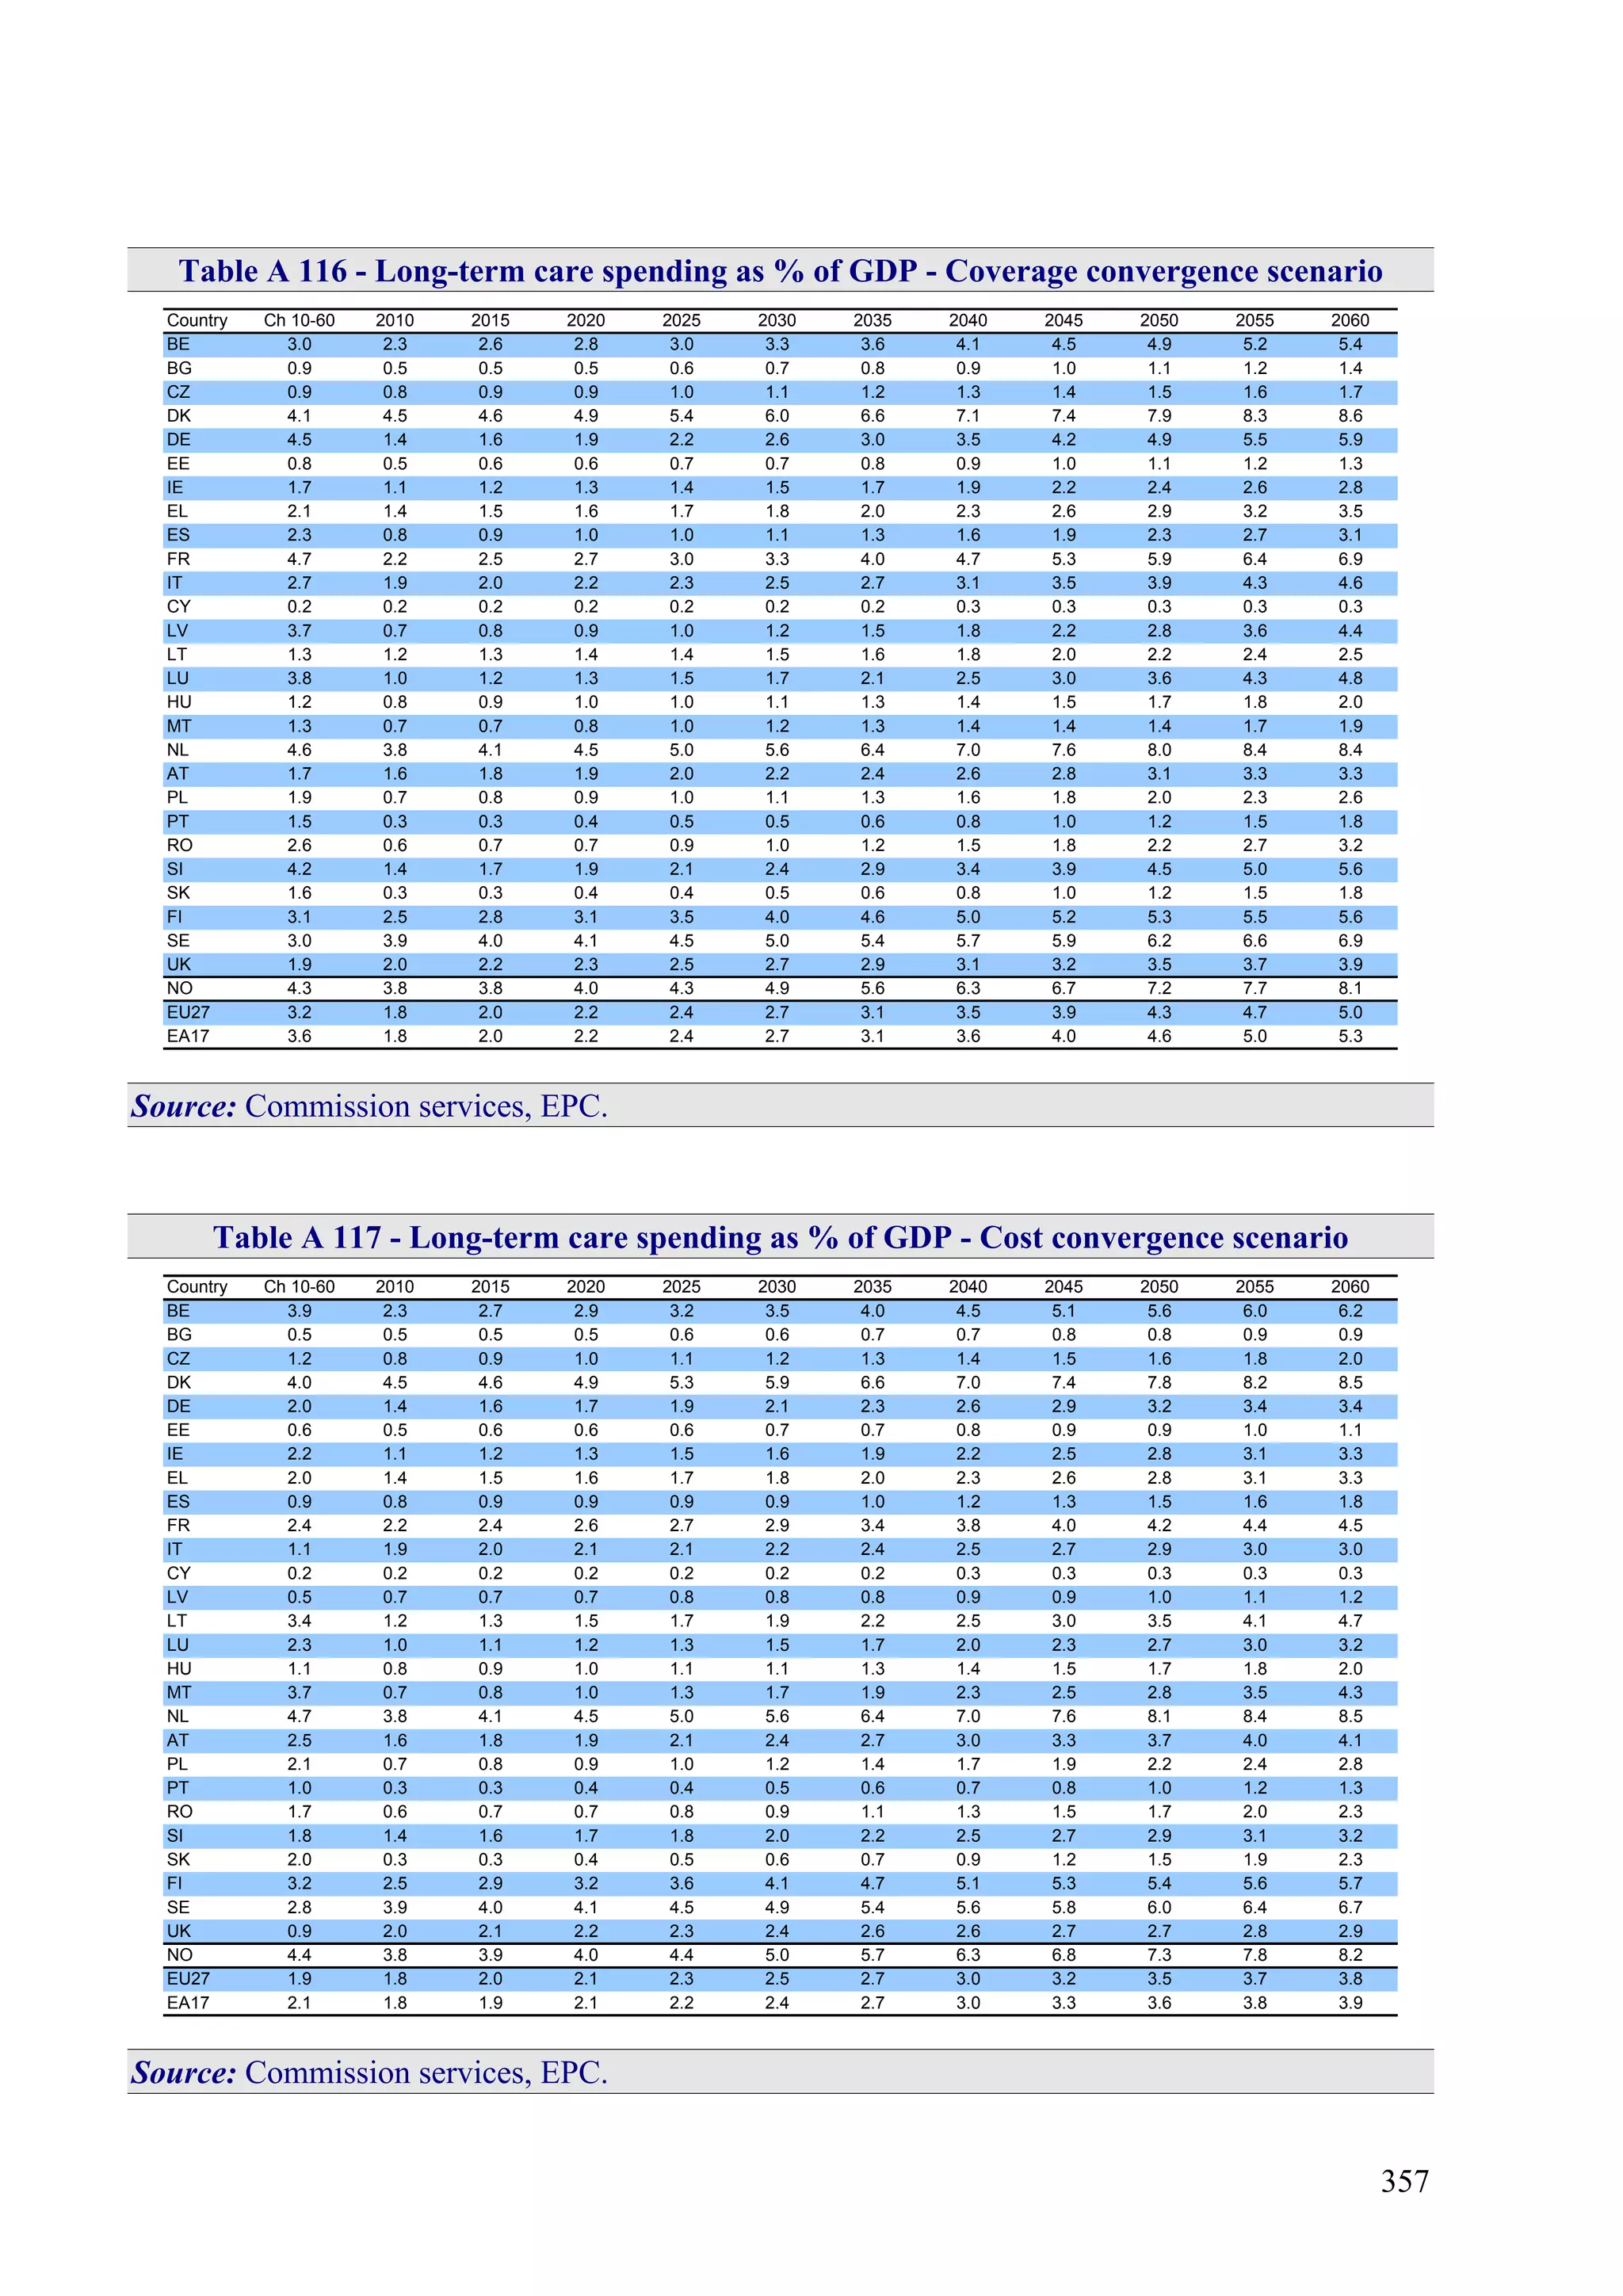
Disabled and recipients
When available, data on numbers of
recipients have been provided by Member
States, while disability rates are available
for all Member States and Norway in the
145
The categories concerned are: a)
Sickness/Health Care function – "other benefits in
kind"; b) Disability function – "benefits in kind"
("accommodation" + "rehabilitation" + "home
help/assistance in carrying out daily tasks" + "other
benefits in kind"); c) Old Age function – "benefits
in kind" ("accommodation" + "home
help/assistance in carrying out daily tasks" + "other
benefits in kind").
146
The HC.R.7 SHA category (health-related cash
benefits) cannot be used for our purpose, as it does
not allow for a clear differentiation between health
care related and long-term care related cash
benefits. Moreover, the relevant data is missing for
many countries.
2009 EU-SILC database, for people aged
15+, by age group.147
On the one hand, the legal definition of
"dependent/recipient", or "entitled to long-
term care", can differ widely from one
Member State to another, preventing full
data comparability. In other words, the
level of dependency opening a right to the
provision of long-term care may vary a lot
across countries. On the other hand, what
we consider is the proportion of recipients
(by age groups) with respect to the number
of disabled (according to the EU-SILC
definition).148
147
Note that for the 0-14 age group, the 15-19
disability rate has been applied.
148
In order to clarify the relation and to follow the
usual eligibility conditions of public schemes, it is
commonly accepted that the disability levels
accounted for are those categorized as "severe". To
calculate disability rates, the AWG, based on the
proposal in the February 2011 Commission's note
on HC and LTC data availability, decided to use the
EU-SILC item "Limitation in activities because of
health problems [for at least the last 6 months]".
This is considered the only available measure of
dependency for all concerned countries. Note,
though, that the relevant EU-SILC question does
not specify the activities that the respondent should
consider, nor offer a description of what is meant
by “severe limitation”. This implies that the
subjective assessment by the respondent plays a
more important role than is typically the case when
assessing legal eligibility for public LTC.](https://image.slidesharecdn.com/the2012ageingreport-140627171641-phpapp01/75/The-2012-ageing-report-229-2048.jpg)

![251
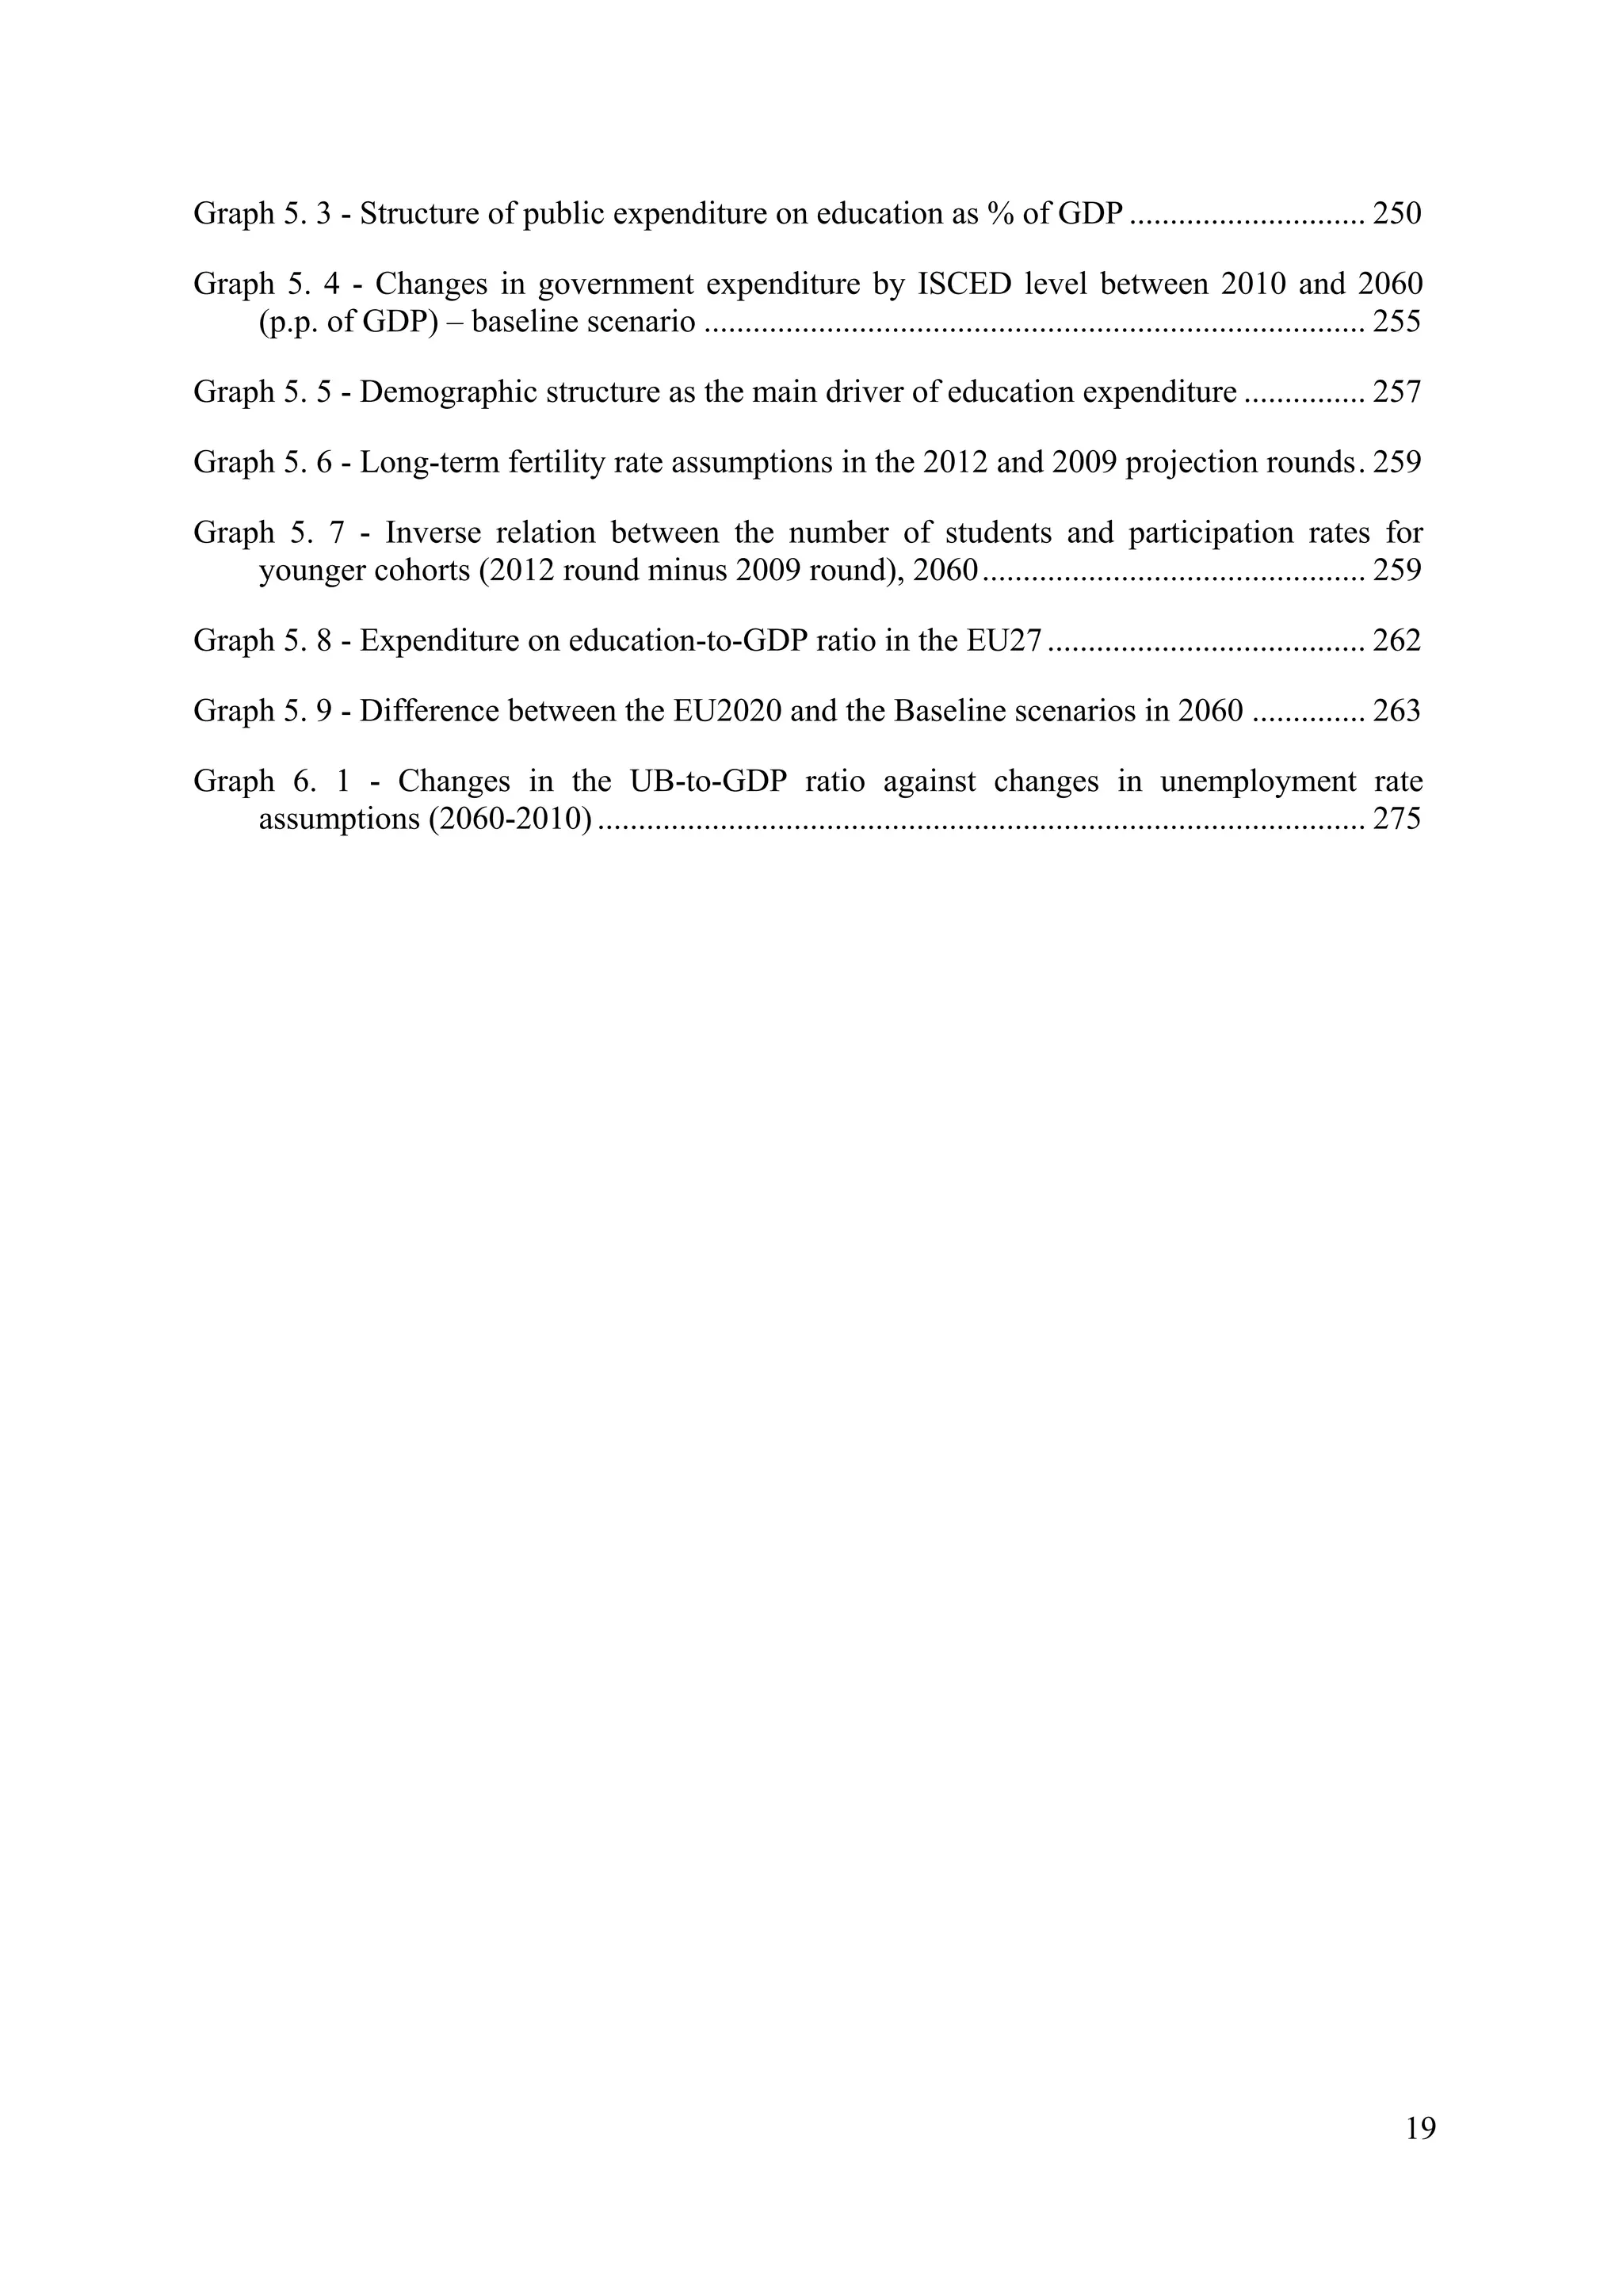
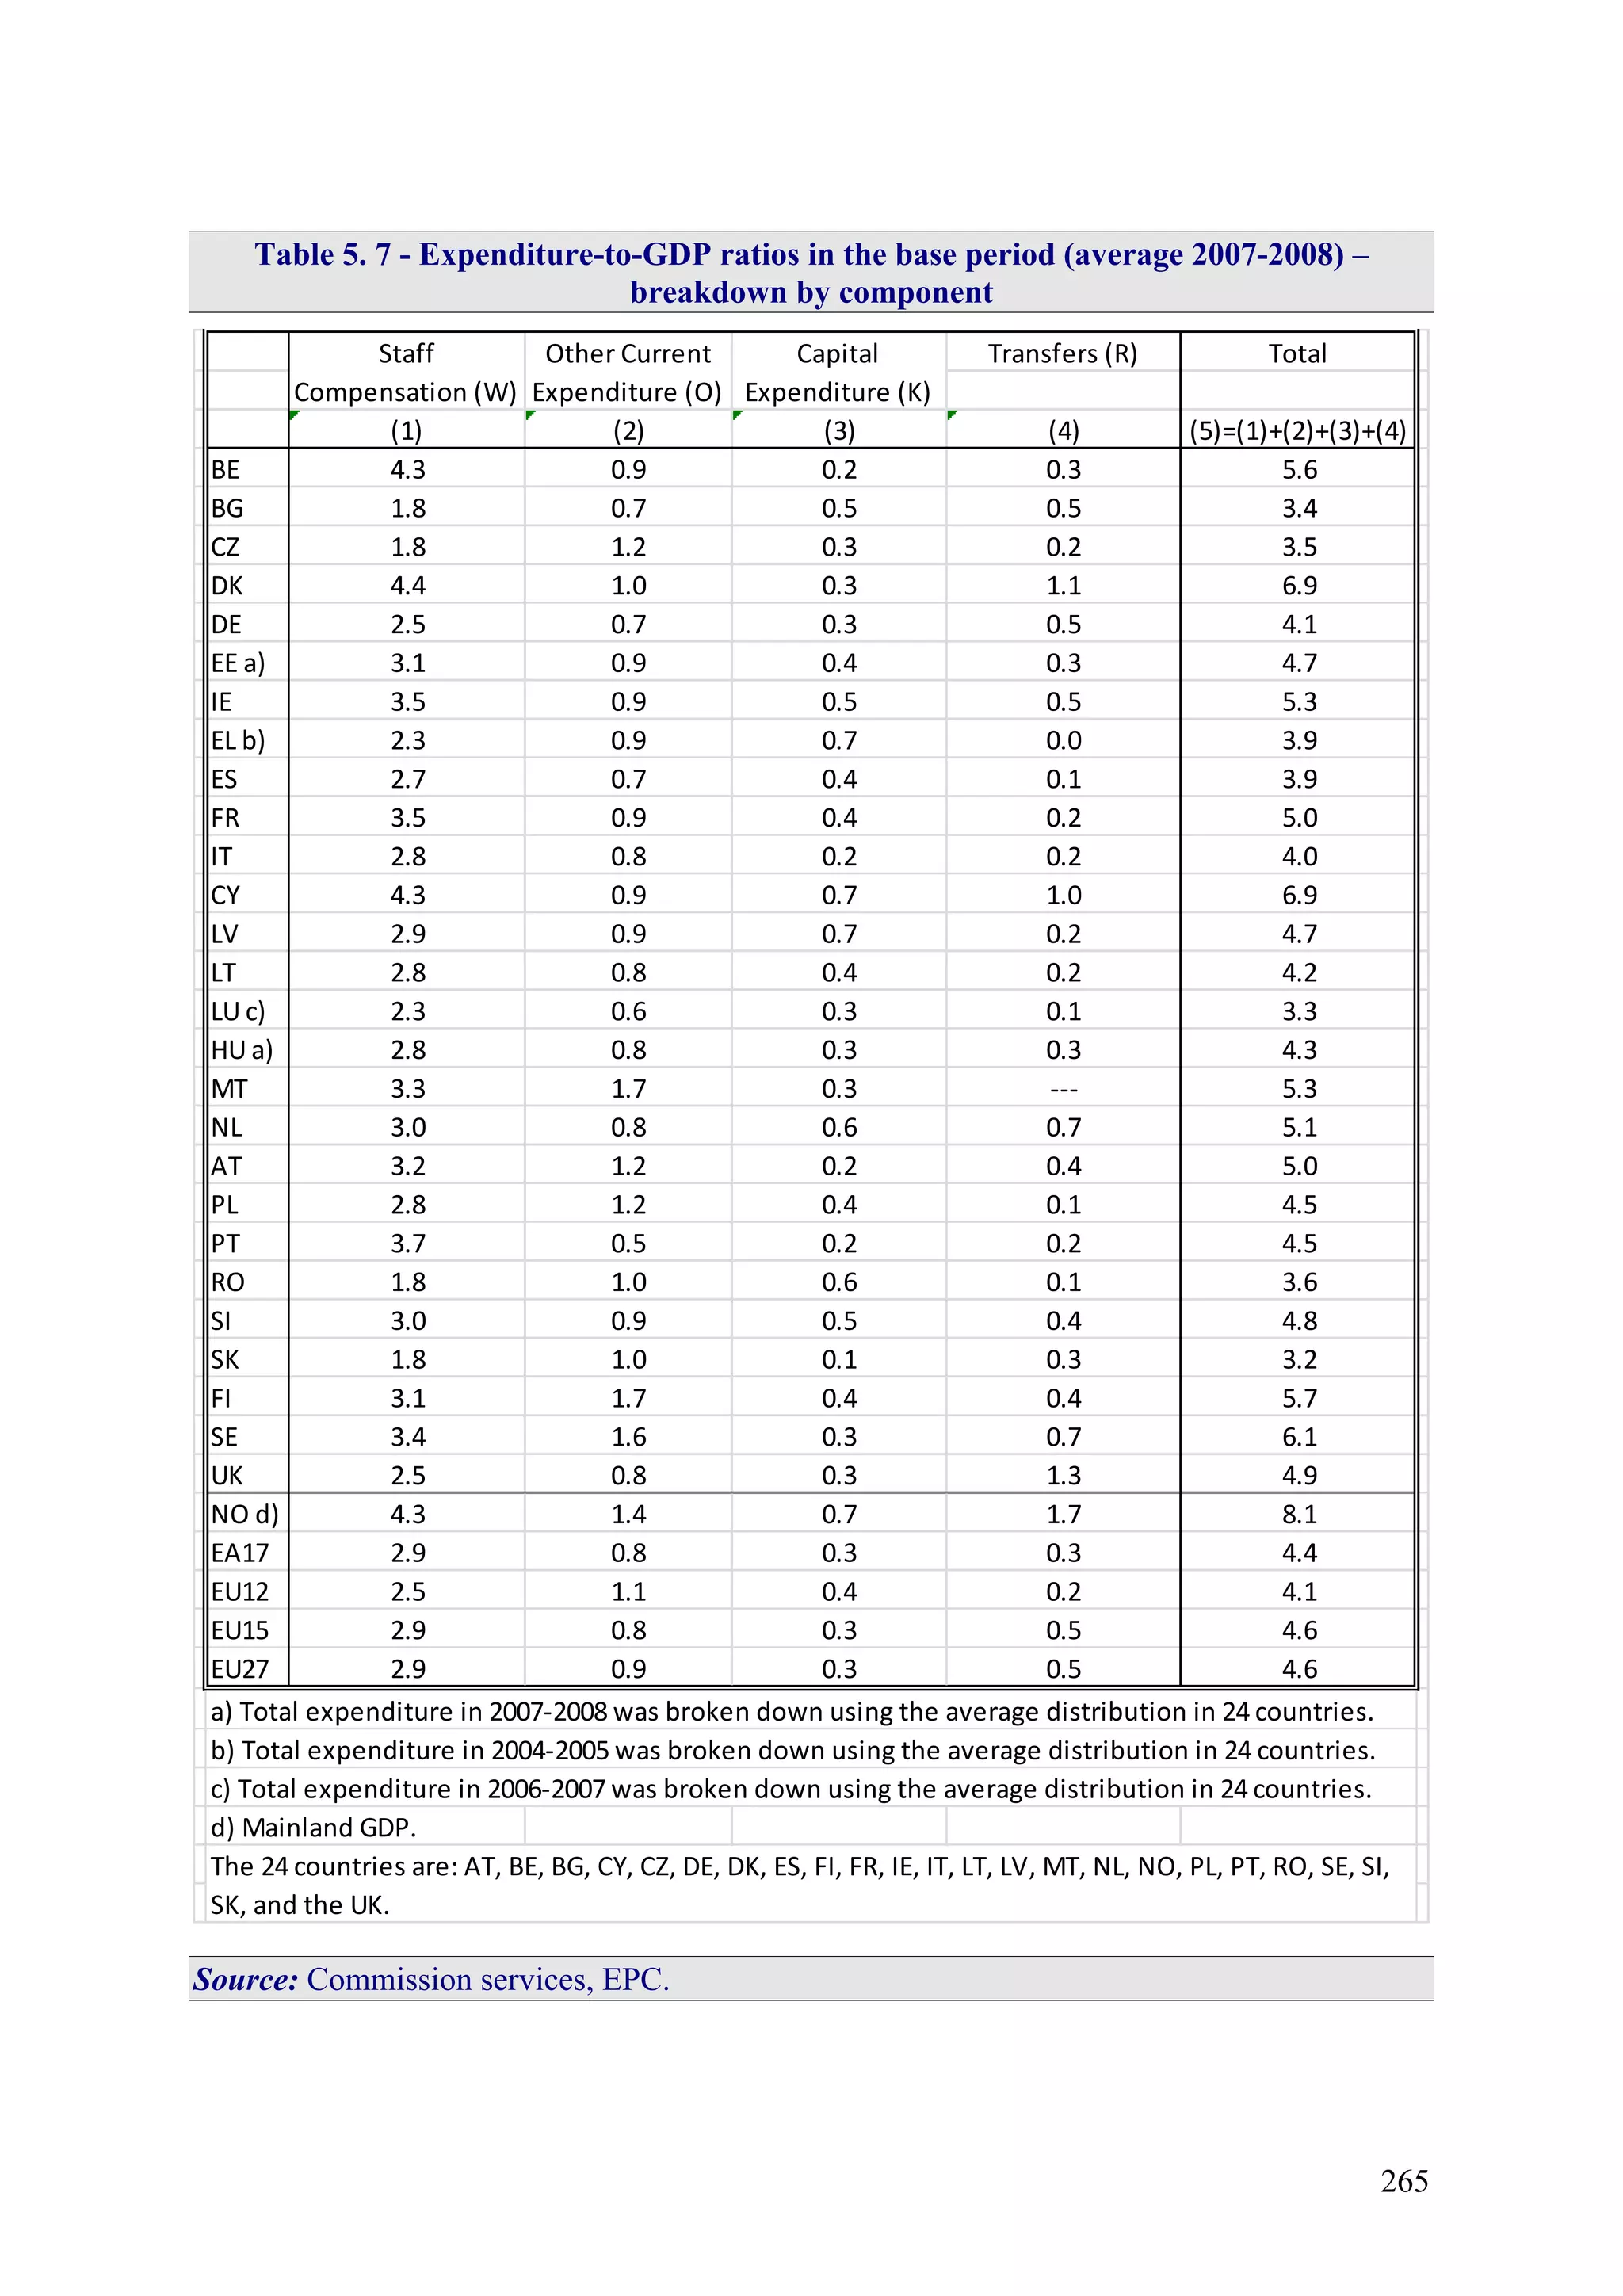
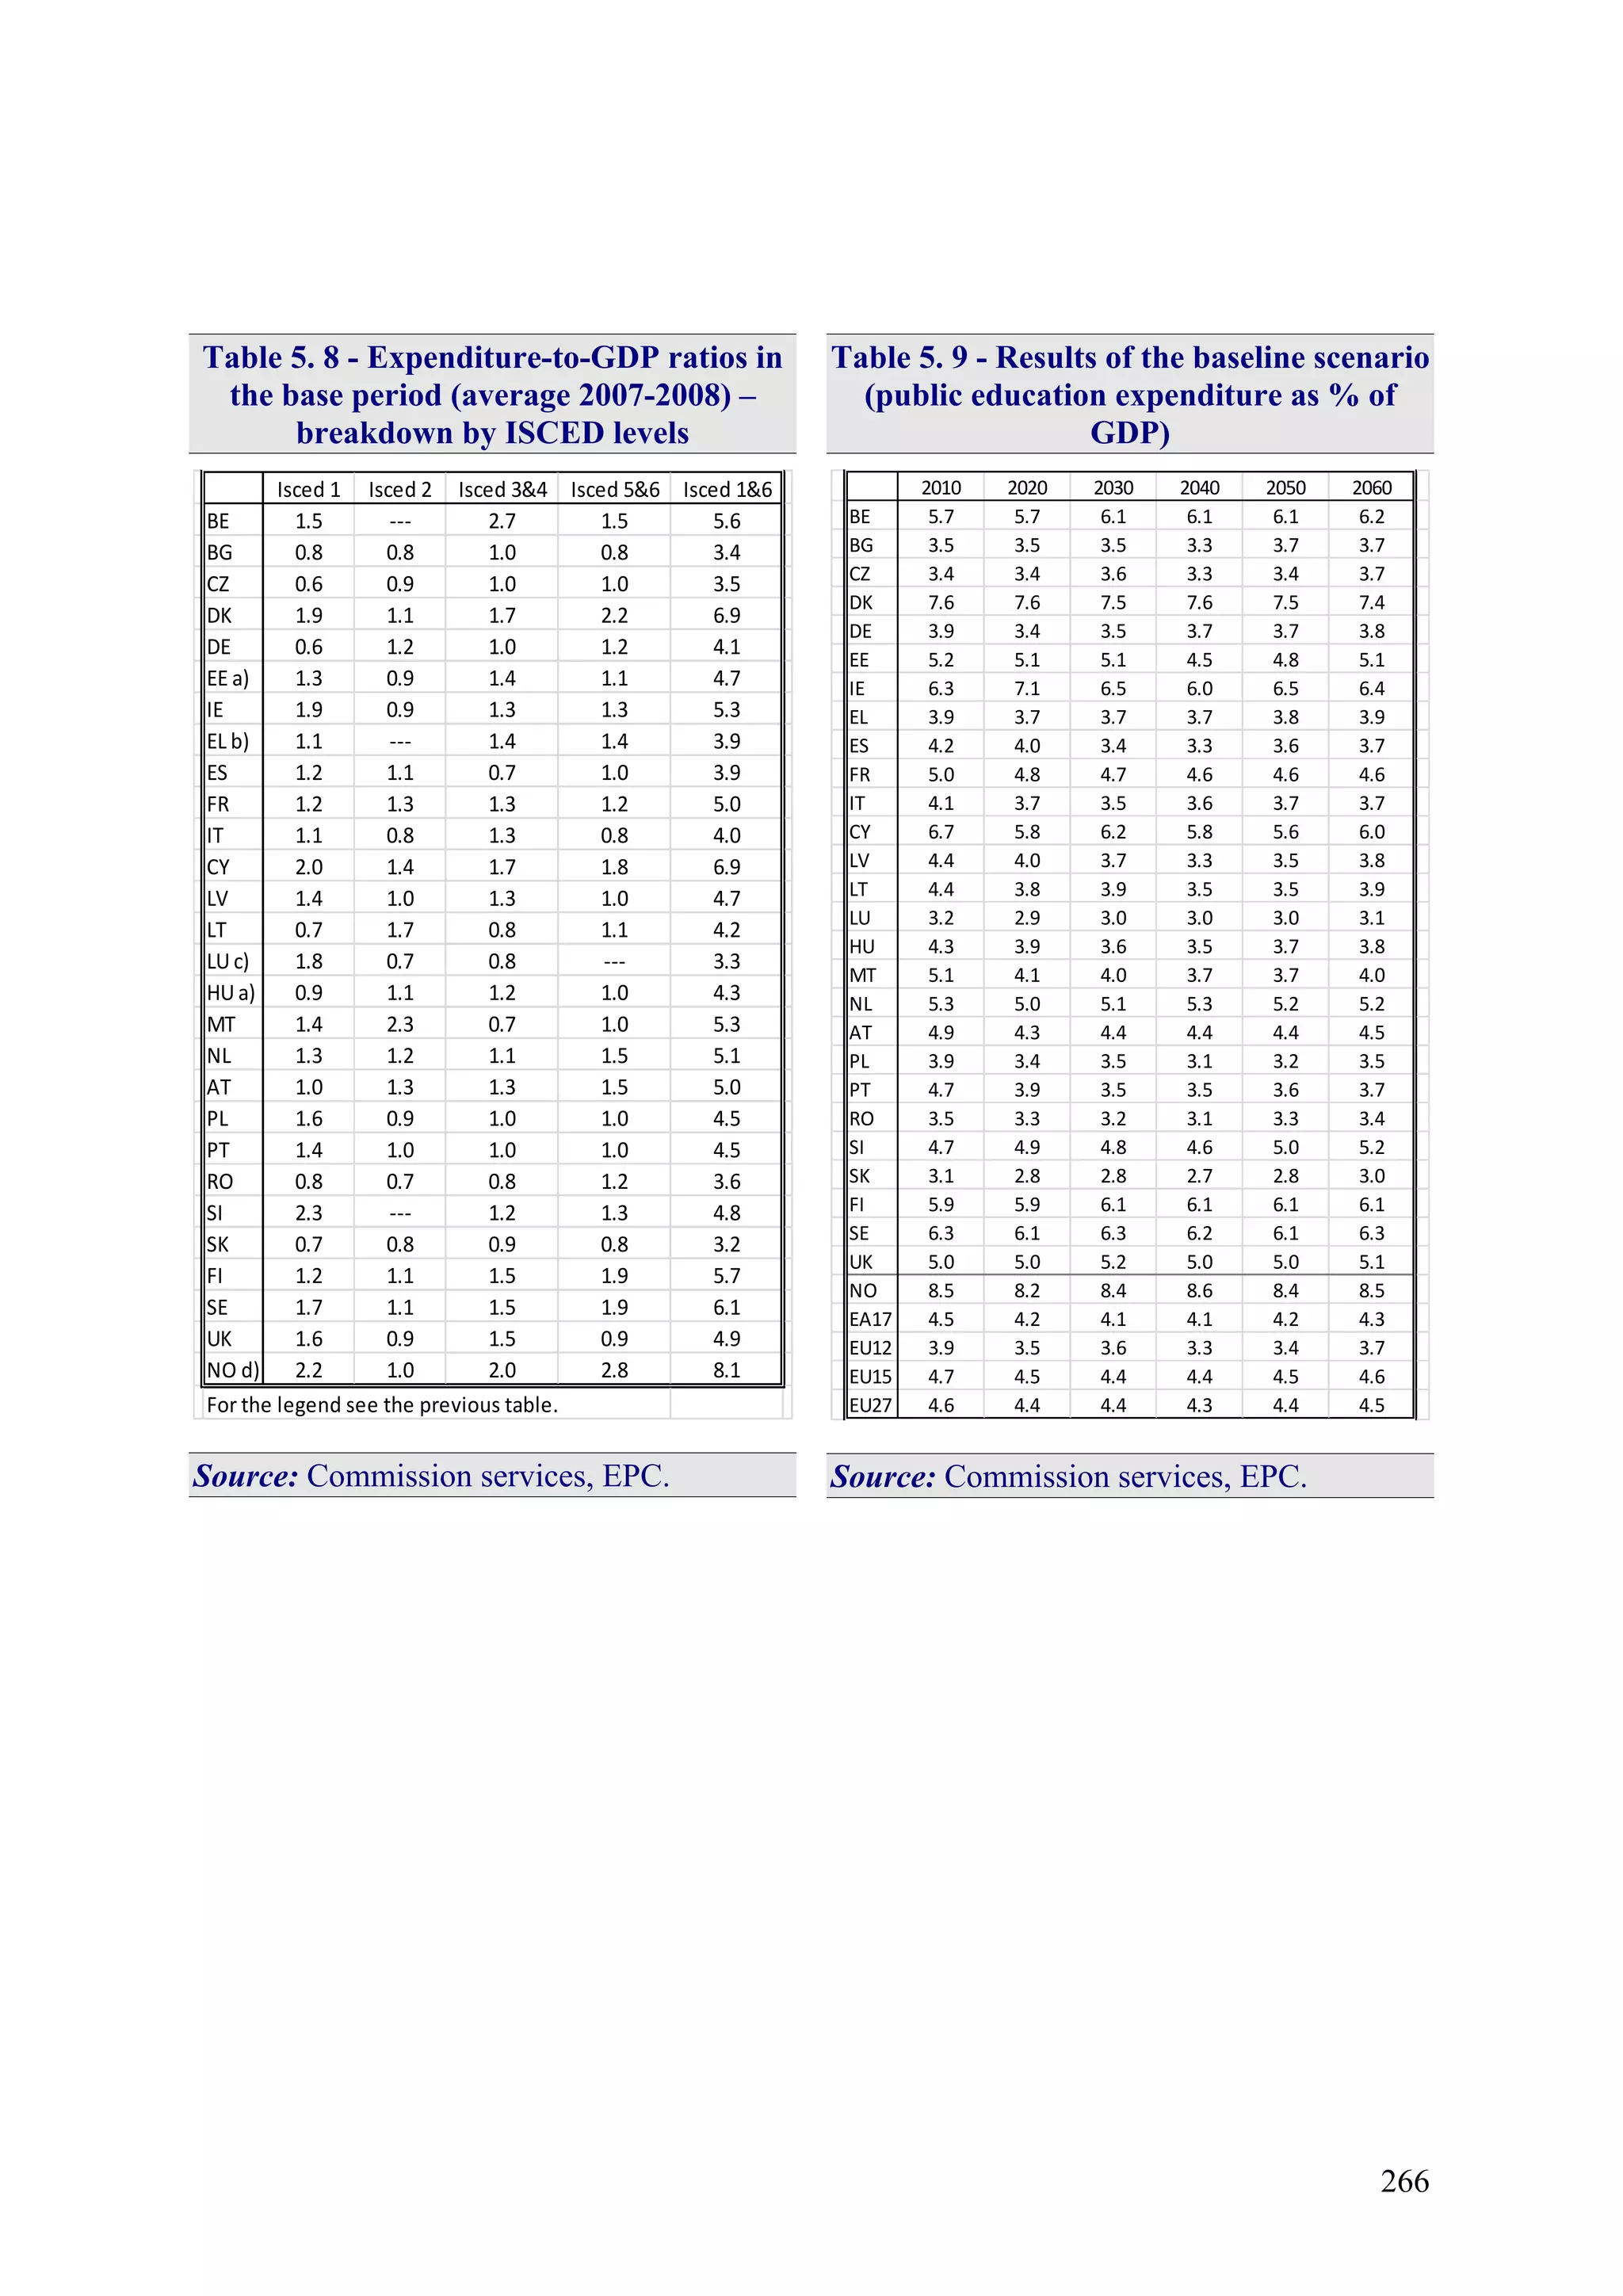
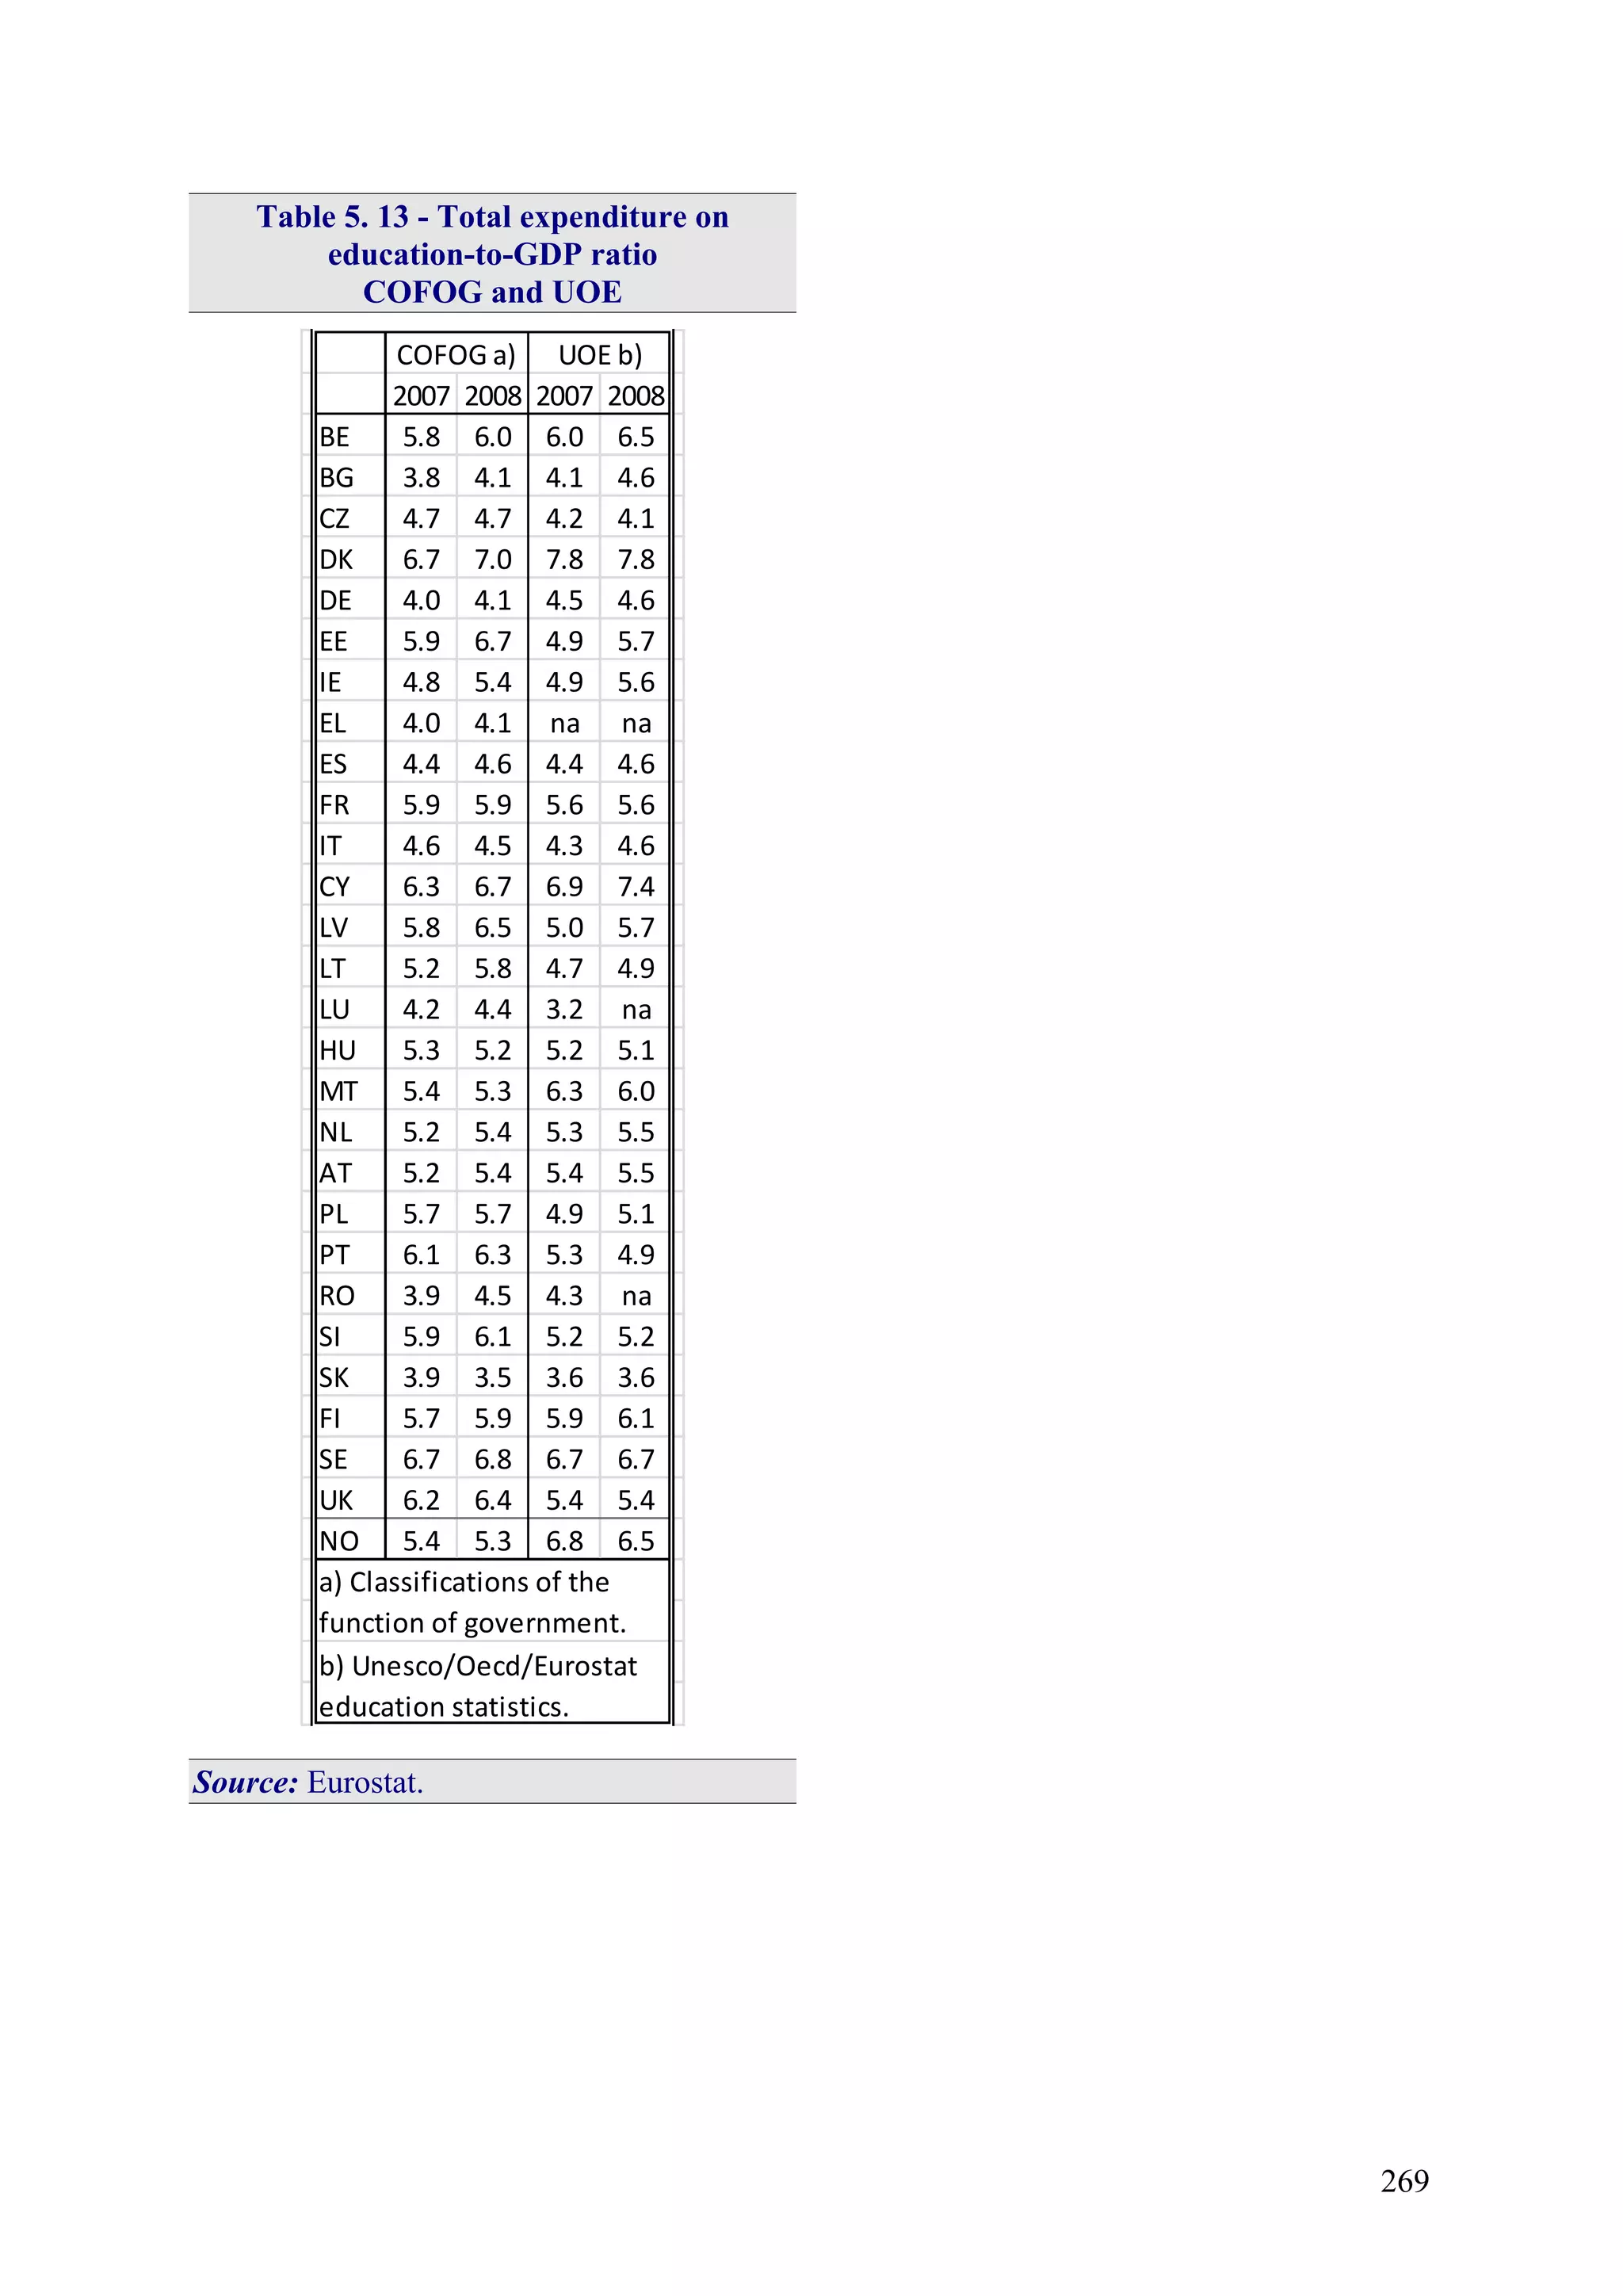
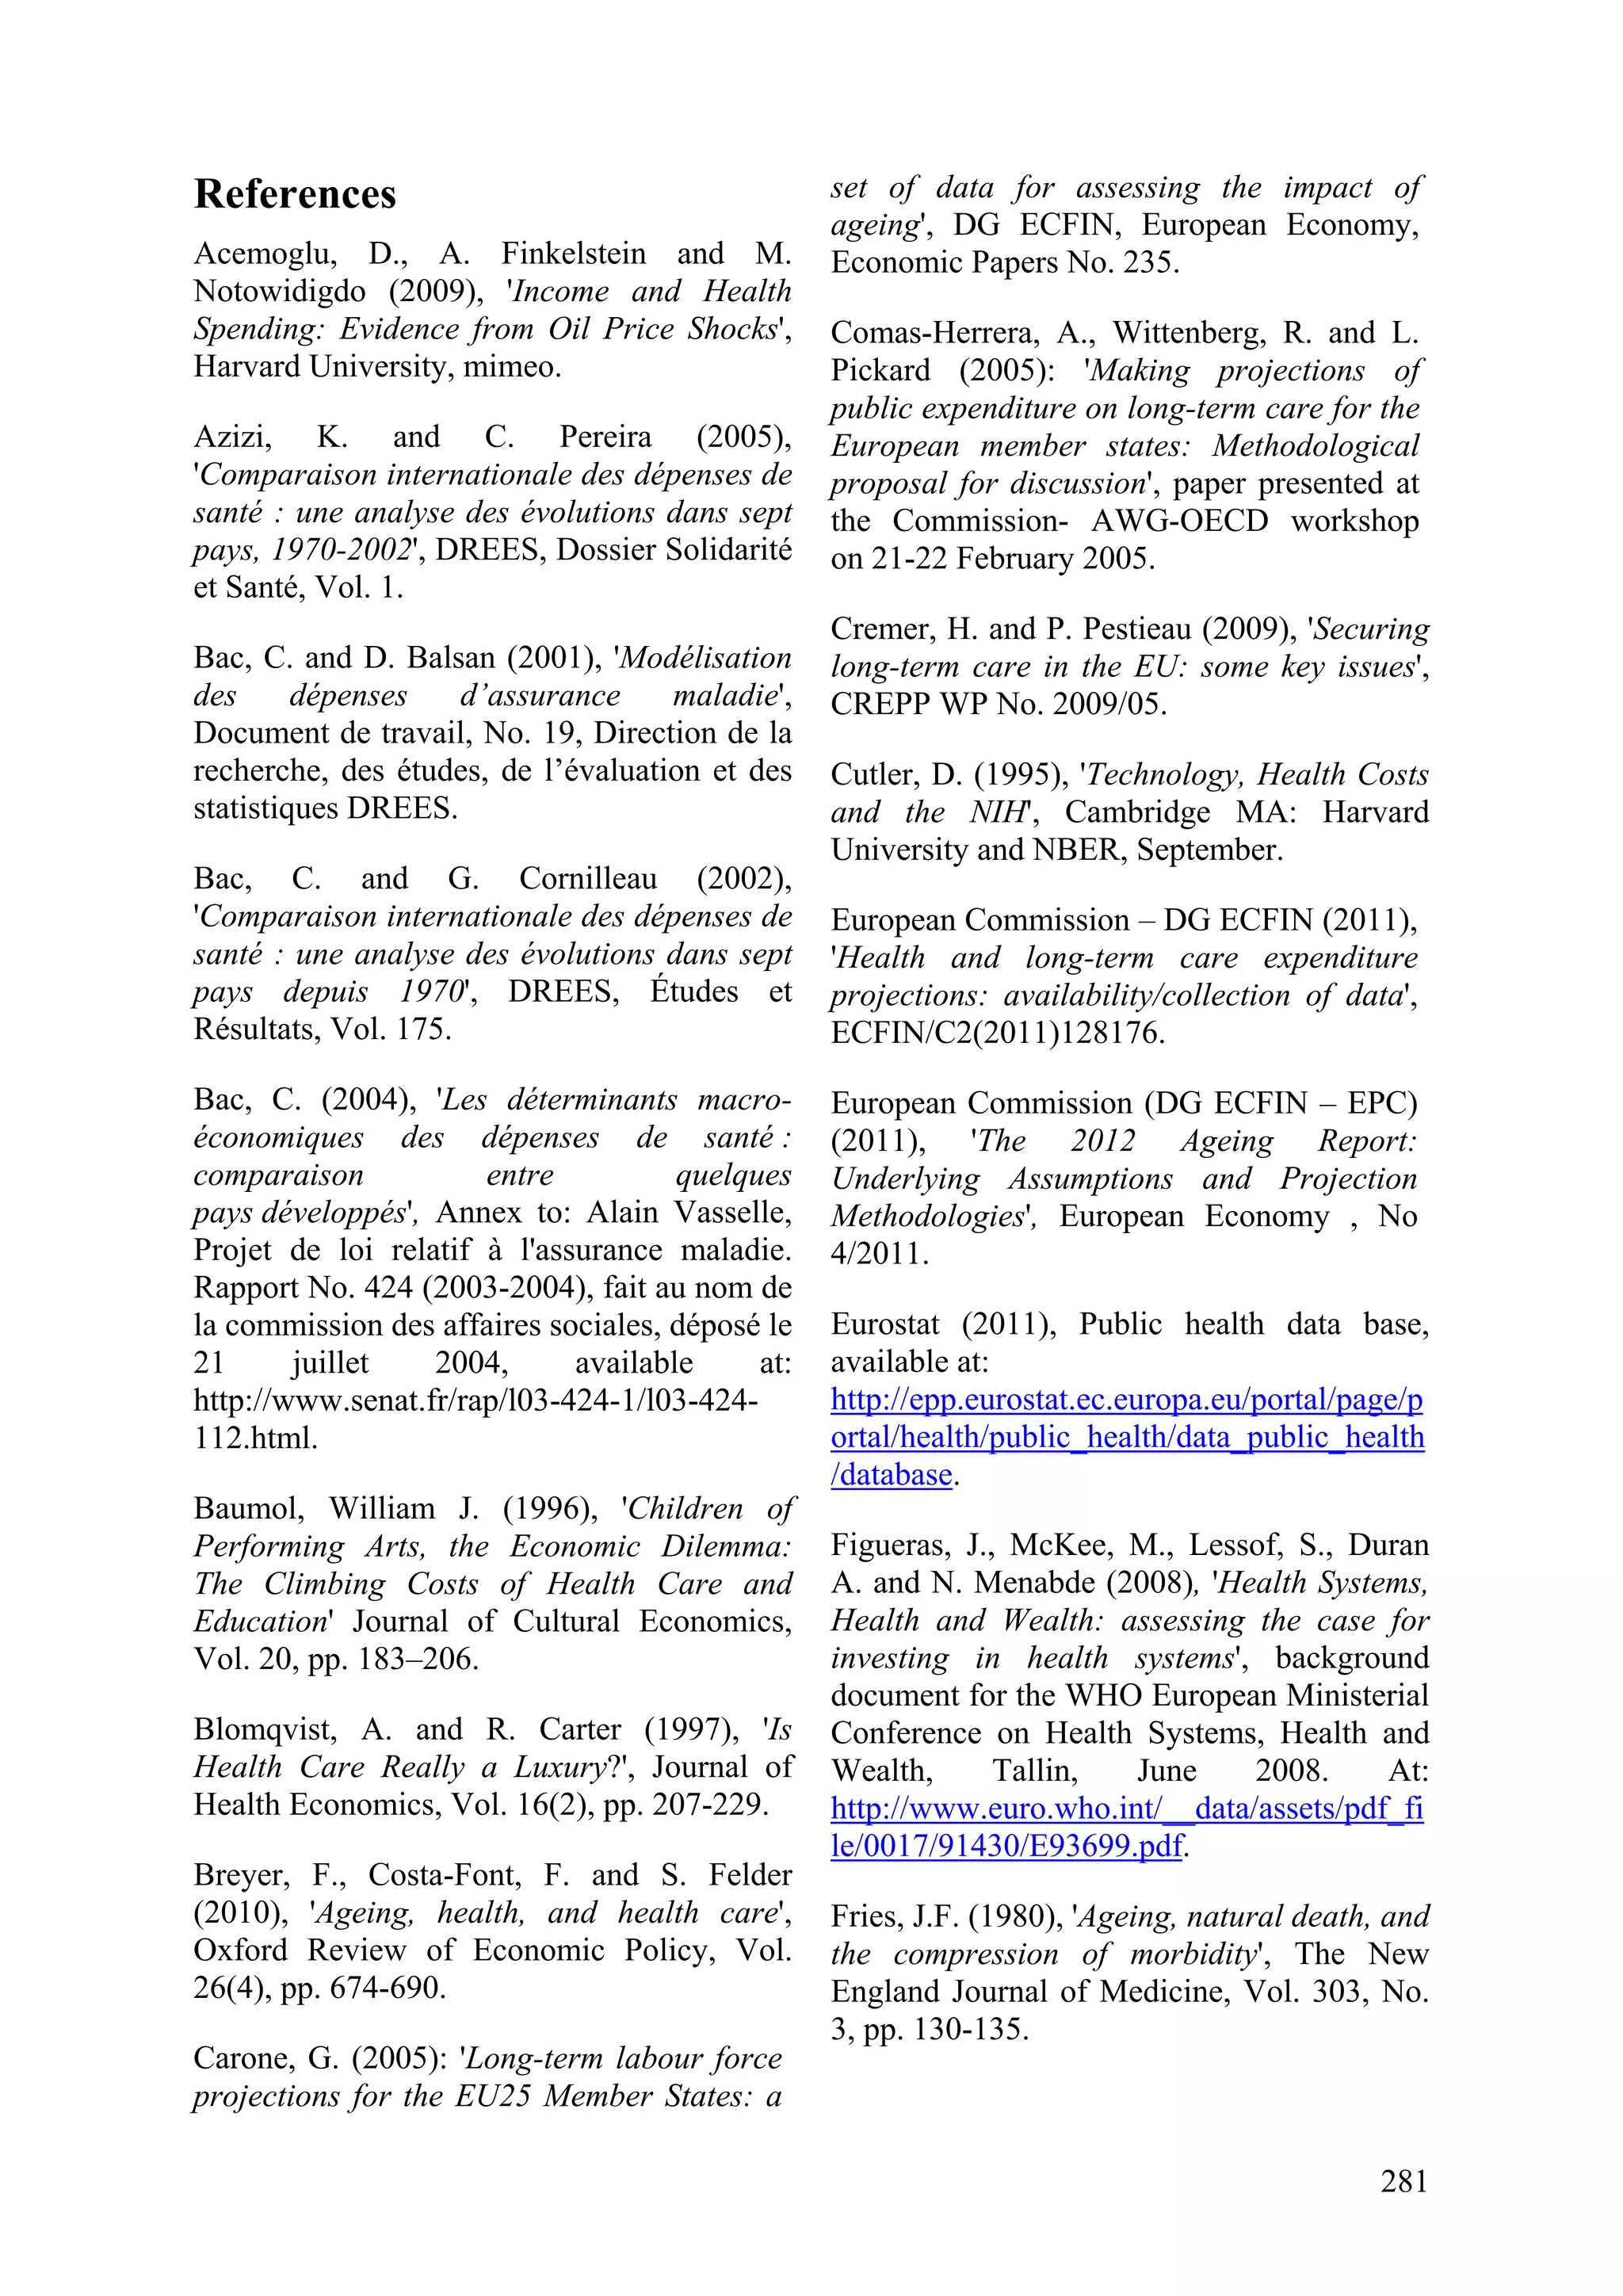
5.3. Methodology and results
5.3.1. Decomposition of total
changes
A simple simulation model is used to project
expenditure on education. As a rule, average
expenditure in the years 2007 and 2008 is
used as the base period. Total expenditure on
education is broken down into four
components: i) expenditure on staff
compensation (i.e. gross wages and salaries
of teaching and non-teaching staff); ii) other
current expenditure; iii) capital expenditure;
and iv) transfers (e.g. scholarships and public
subsidies to private education institutions).158
The objective is to project the total
expenditure-to-GDP ratio. The ISCED levels
considered are: ISCED 1, ISCED 2, ISCED
3&4, and ISCED 5&6.159
[ ]
t
i
i
t
i
t
i
t
i
t
t
i
i
t
GDP
RKOW
GDP
EDU ∑∑ +++
=
(1)
Where i
tEDU is expenditure on education in
ISCED level i and year t; W is expenditure on
staff compensation; O is other current
expenditure; K is capital expenditure; R is
transfers; and i∈{1, 2, 3&4, 5&6}.
The main assumption of the methodology is
that per-capita costs grow in line with labour
productivity. Specifically, the average
158
For a detailed presentation of the methodology see:
The 2012 Ageing Report: Underlying Assumptions
and Projection Methodologies - Joint Report prepared
by the European Commission (DG ECFIN) and the
Economic Policy Committee (AWG), European
Economy, No. 4/2011, European Commission.
159
It should be stressed that no attempt is made to
project total expenditure on education, as ISCED 0
level expenditure (pre-primary and not allocated by
level) is not covered by the analysis.
compensation per member of the staff ( i
t
i
t
T
W
),
and the other three expenditure variables in
terms of their student ratios ( i
t
i
t
i
t
i
t
i
t
i
t
S
R
S
K
S
O
,, )
grow in line with labour productivity, where
T and S are the numbers of teaching workers
and of students, respectively.
Assuming that per-capita variables grow in
line with labour productivity is sufficient to
derive the following compact general
formula for the expenditure on
education-to-GDP ratio:
[ ]
t
t
t
t
i
iii
t
i
i
t
i
i
t
CE
IG
IP
IS
GDP
RKO
IT
GDP
W
GDP
EDU
+
⎥
⎥
⎥
⎦
⎤
⎢
⎢
⎢
⎣
⎡ ++
+=
∑∑∑
***
0
000
0
0
(2a)
Where i
tIT , i
tIS , i
tIP , and i
tIG are indexes of
respectively, teaching staff, students, labour
productivity, and GDP.160
A bar over an
index represents one calculated over all
ISCED levels considered.161
CEt is the
composition effect, which is usually a small
number compared with the total
expenditure-to-GDP ratio.162
Equation 2a expresses the expenditure on
education-to-GDP ratio as a function of base
period ratios, and indexes for teaching staff,
students, labour productivity and GDP.
160
An index
0X
X
IX t
t = measures the ratio between
the values of variable X in the current period t and in
the base period 0.
161
∑
∑
=
i
i
i
i
t
t
T
T
IT
0
and
∑
∑
=
i
i
i
i
t
t
S
S
IS
0
.
162
The composition effect is given by:
{ } [ ] { }
t
t
t
i
t
i
iii
t
i
t
i
i
t
IG
IP
GDP
ISISRKO
GDP
ITITW
CE *
**
0
000
0
0
⎥
⎥
⎥
⎦
⎤
⎢
⎢
⎢
⎣
⎡ −++
+
−
=
∑∑](https://image.slidesharecdn.com/the2012ageingreport-140627171641-phpapp01/75/The-2012-ageing-report-253-2048.jpg)
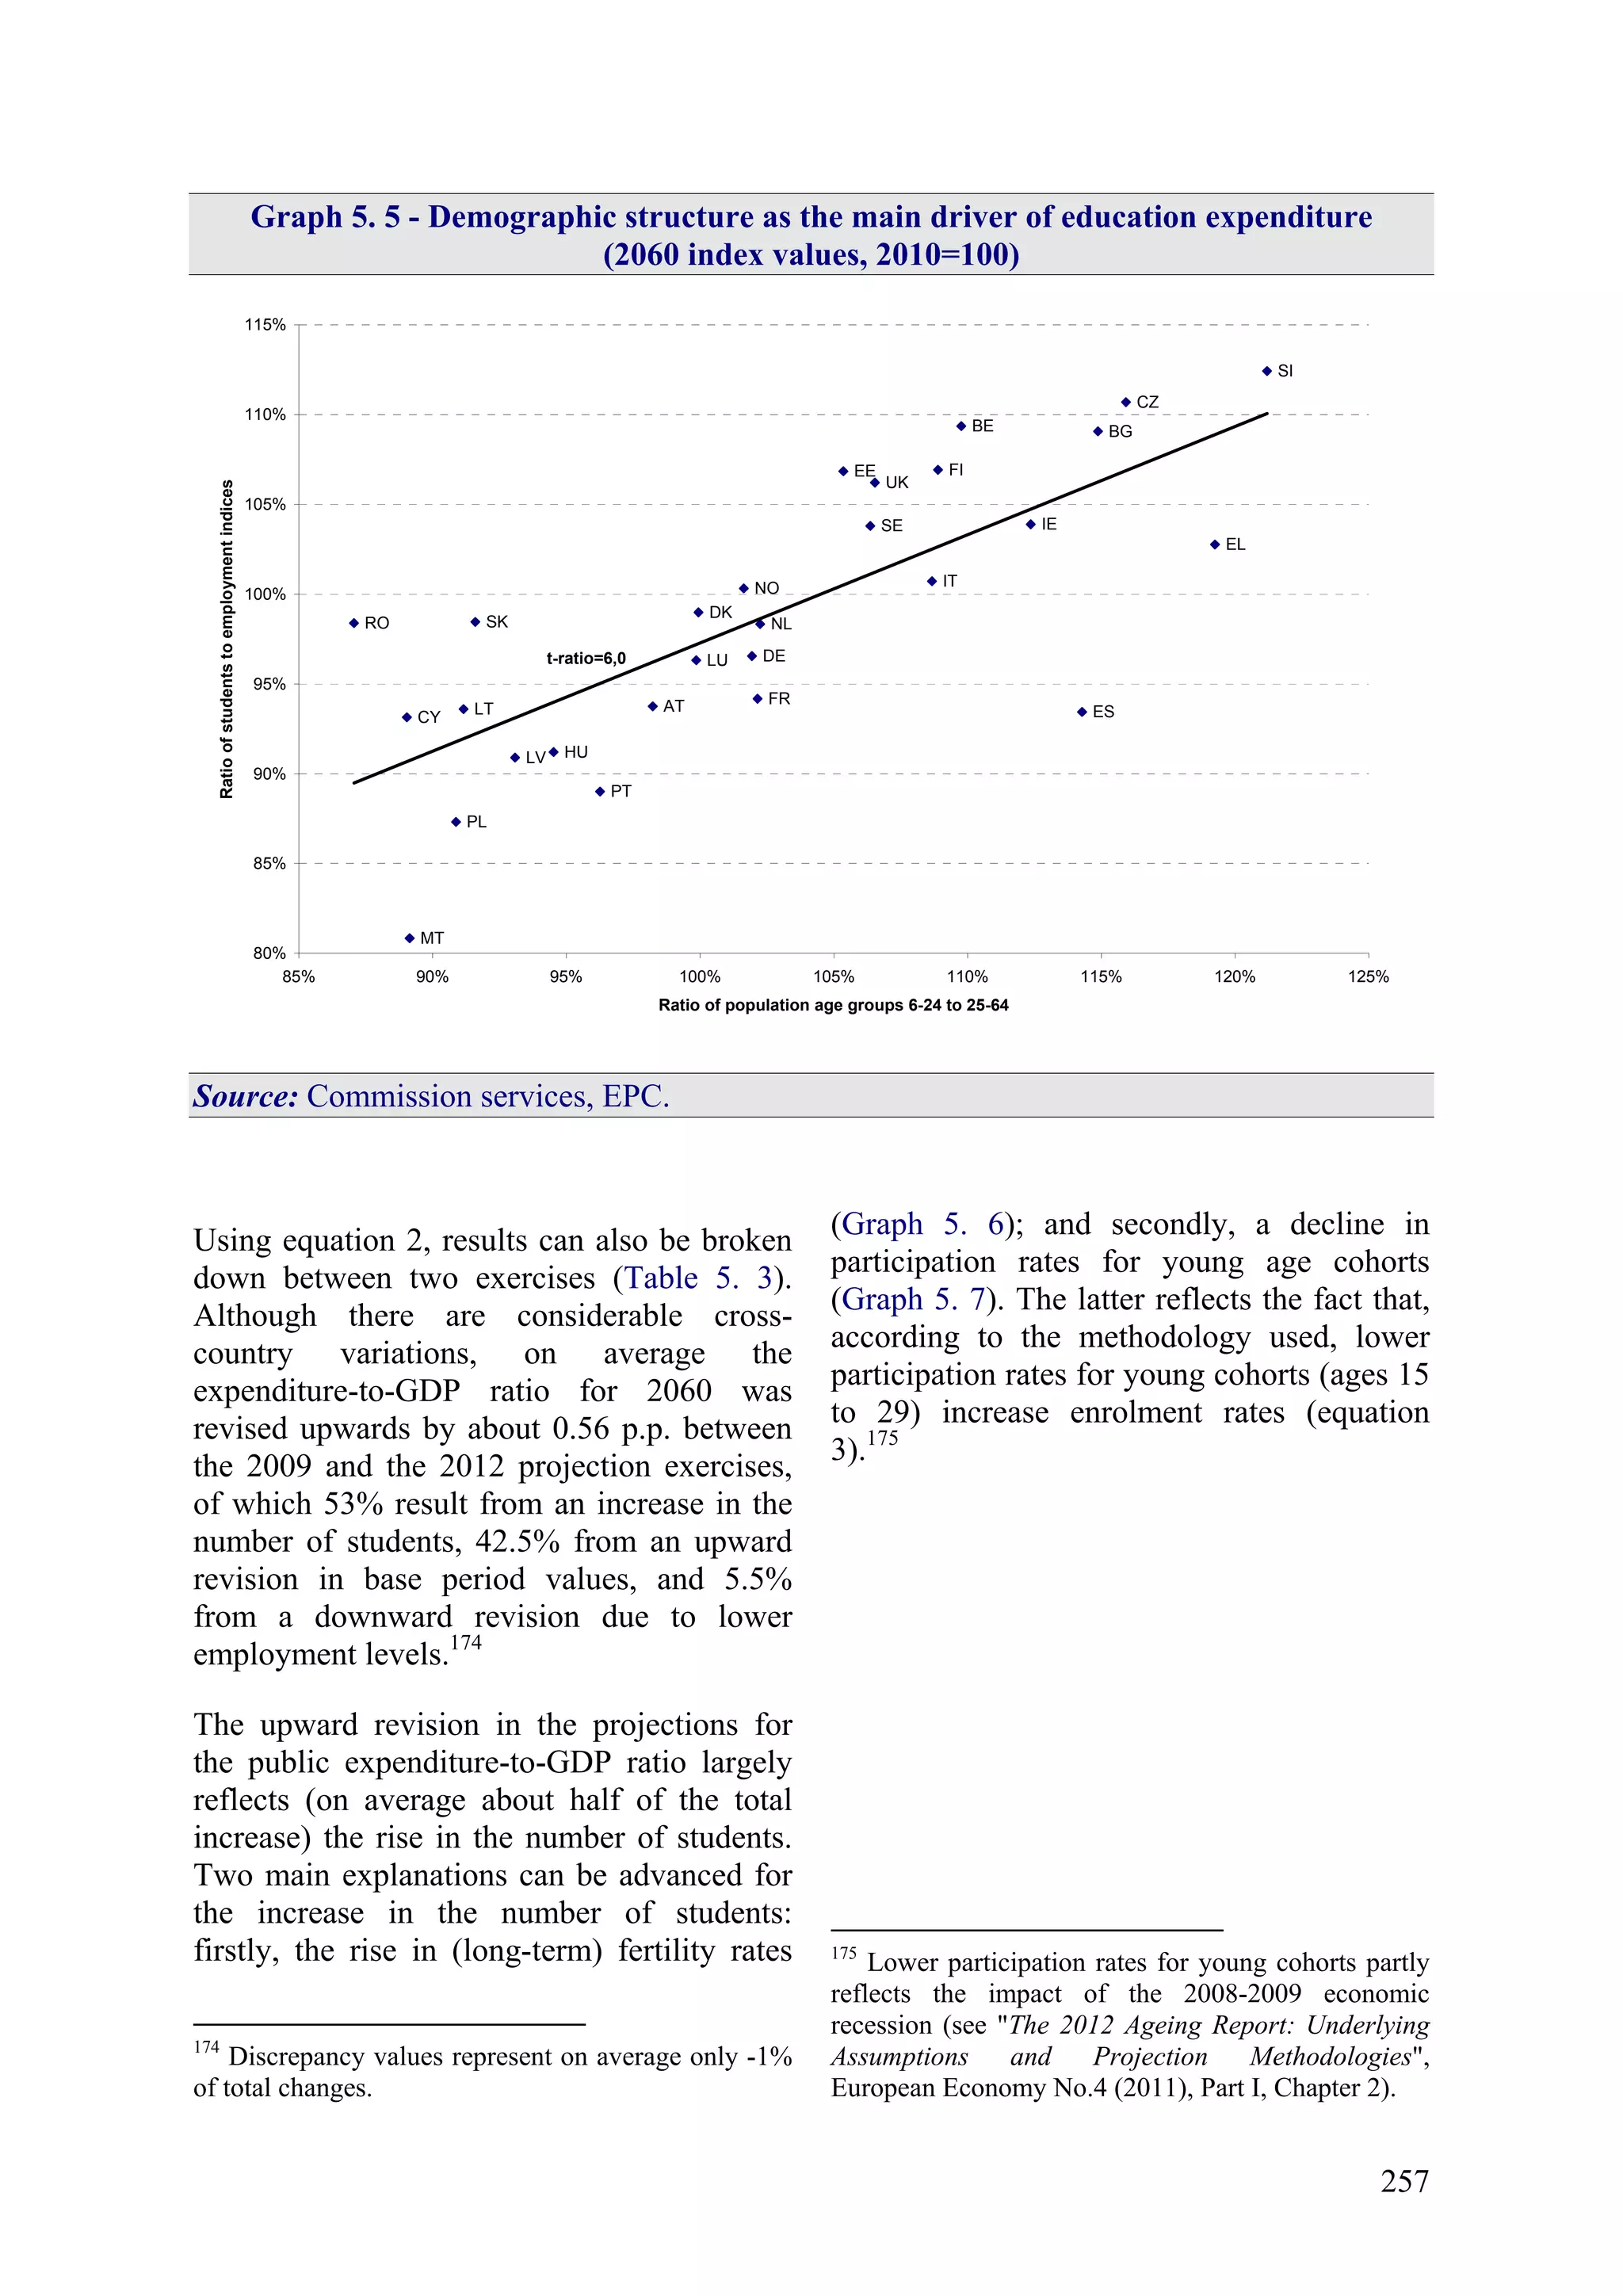


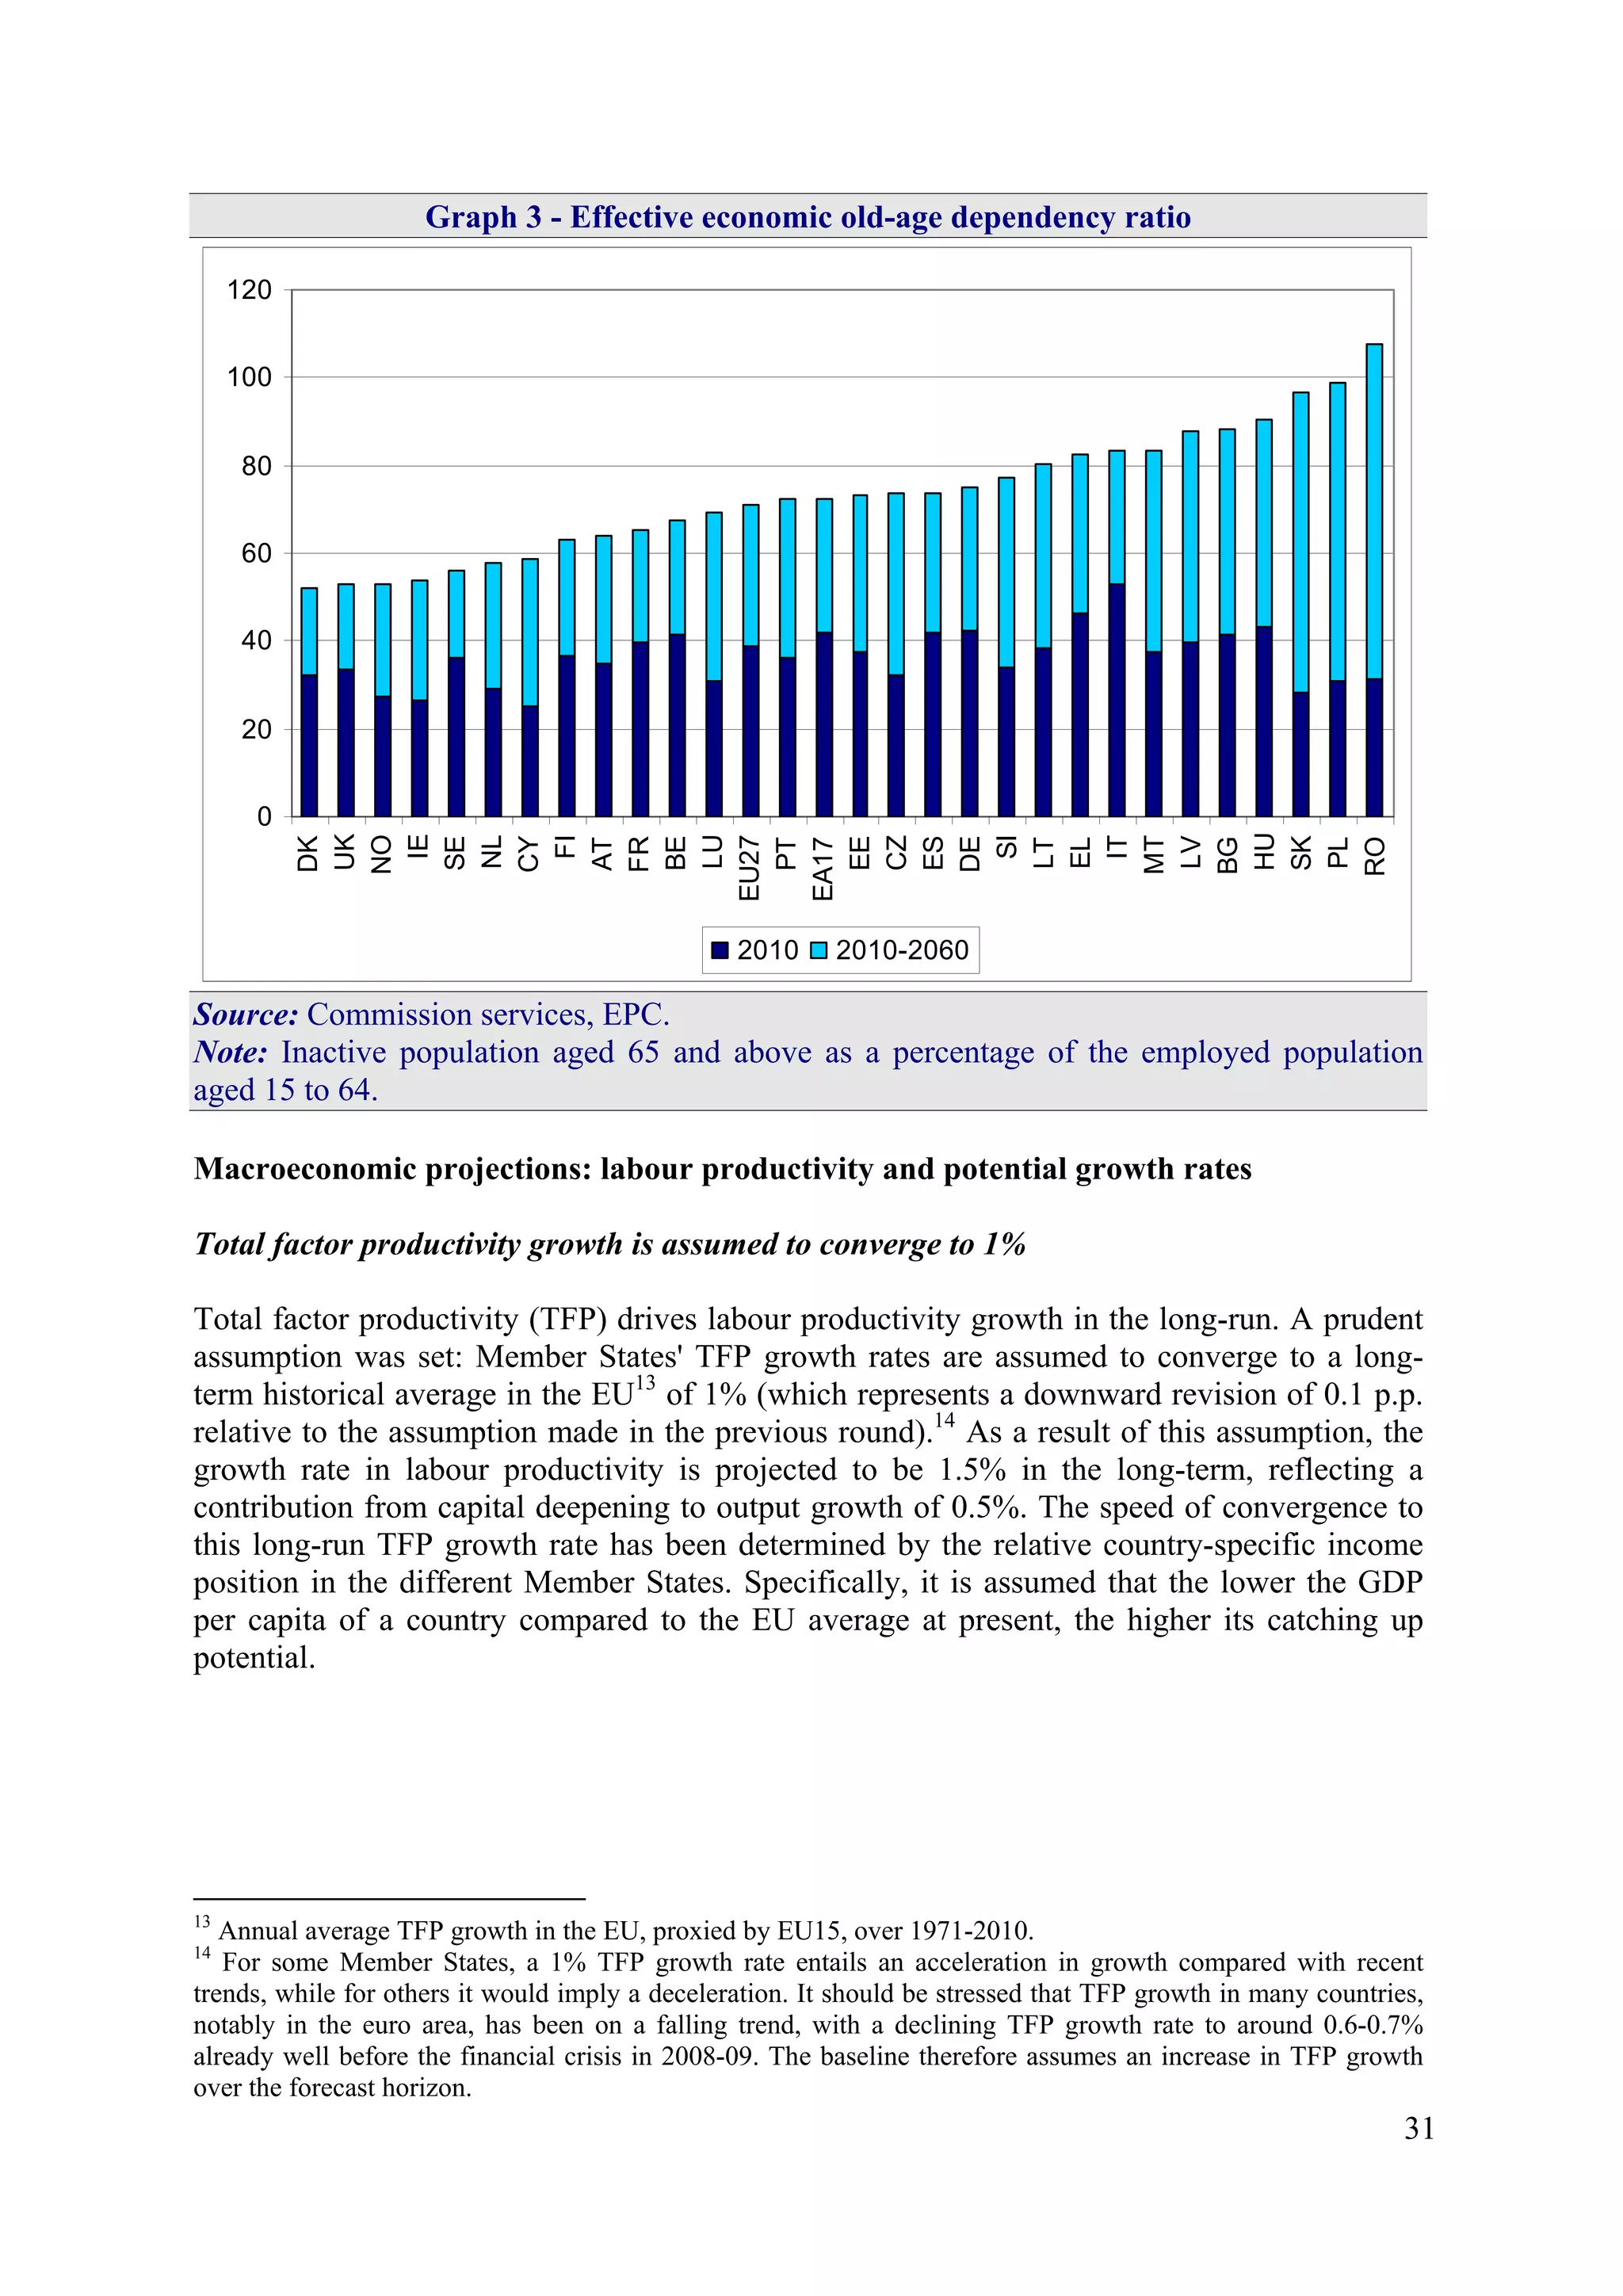
The document is a report from the European Commission and Economic Policy Committee projecting the economic and budgetary impact of aging populations in EU member states from 2010-2060. It finds that aging will significantly increase public spending on pensions and healthcare. Labor force growth will slow and the ratio of retirees to workers will rise, posing economic and fiscal challenges. Productivity increases will need to offset declining employment levels to maintain GDP growth. The projections provide policymakers long-term forecasts to help address the fiscal sustainability risks that aging populations bring.


