SlideShare a Scribd company logo
1 of 16
Balance sheet
                                            Mar ' 12   Mar ' 11   Mar ' 10   Mar ' 09   Mar ' 08

Sources of funds
Owner's fund

Equity share capital                          254.63     254.40     231.98     218.98     218.98

Share application money                         3.41          -       7.57      21.32      21.32

Preference share capital                           -          -          -      19.80      33.00

Reserves & surplus                          1,762.15   1,236.00   1,107.31     919.82   1,172.53

Loan funds
Secured loans                               1,560.73   1,763.23   1,728.73   1,920.90   1,774.94

Unsecured loans                                42.57      48.89     141.85     103.04      97.52

Total                                       3,623.49   3,302.52   3,217.44   3,203.86   3,318.29

Uses of funds
Fixed assets

Gross block                                 3,557.55   3,172.22   3,002.45   3,056.80   2,942.99

Less : revaluation reserve                         -     305.86      73.14      13.88      24.52

Less : accumulated depreciation             1,288.49   1,170.26   1,084.34   1,014.51     906.78

Net block                                   2,269.06   1,696.10   1,844.97   2,028.41   2,011.69

Capital work-in-progress                      179.10     142.28      46.86      81.58     116.14

Investments                                   337.11     309.40     300.29     100.06     104.99

Net current assets
Current assets, loans & advances            1,839.70   1,806.07   1,478.94   1,592.51   1,471.14

Less : current liabilities & provisions     1,001.48     651.33     453.62     608.77     395.17

Total net current assets                      838.22   1,154.74   1,025.32     983.74   1,075.97

Miscellaneous expenses not written                 -          -          -      10.07       9.50

Total                                       3,623.49   3,302.52   3,217.44   3,203.86   3,318.29

Notes:
Book value of unquoted investments            299.39     328.15     324.38     127.26     123.04

Market value of quoted investments             18.37      14.96       9.62       6.51       7.16

Contingent liabilities                        598.67     682.29     301.99     241.34     208.34

Number of equity sharesoutstanding (Lacs)   2546.33    2543.99    2319.78    2189.78    2189.78
Profit loss account
                               Mar ' 12   Mar ' 11   Mar ' 10   Mar ' 09   Mar ' 08

Income
Operating income               3,493.98   2,663.58   2,316.75   2,344.82   2,213.32

Expenses
Material consumed              1,861.31   1,426.14   1,237.65   1,116.98   1,115.12

Manufacturing expenses           440.71     410.11     344.64     387.73     338.48

Personnel expenses               360.51     273.90     240.90     244.81     234.74

Selling expenses                      -      54.86      56.35     134.70     112.00

Adminstrative expenses           330.21     114.57     127.77     203.54     184.01

Expenses capitalised                  -          -          -          -          -

Cost of sales                  2,992.74   2,279.58   2,007.31   2,087.76   1,984.35

Operating profit                 501.24     384.00     309.44     257.06     228.97

Other recurring income           135.81      18.34      37.70      52.57      22.75

Adjusted PBDIT                   637.05     402.34     347.14     309.63     251.72

Financial expenses               270.25     215.44     213.32     214.16     177.20

Depreciation                     130.51     116.16     113.80     122.05     136.64

Other write offs                      -          -          -          -          -

Adjusted PBT                     236.29      70.74      20.02     -26.58     -62.12

Tax charges                       53.86          -          -       1.86       2.25

Adjusted PAT                     182.43          -          -     -28.44     -64.37

Non recurring items              251.80      62.37      31.80    -106.62      74.36

Other non cash adjustments            -       1.69       0.18       7.09      16.03

Reported net profit              434.23     134.80      52.00    -127.97      26.02

Earnigs before appropriation     829.66     449.22     333.91     306.95     451.02

Equity dividend                   25.80          -          -          -          -

Preference dividend                   -          -       0.76       1.68       2.48

Dividend tax                       4.19          -       0.13       0.29       0.42

Retained earnings                799.67     449.22     333.02     304.98     448.12
Cash flow
                                      Mar ' 12   Mar ' 11   Mar ' 10   Mar ' 09   Mar ' 08

Profit before tax                      488.09     134.80      52.00     -46.96      29.61

Net cashflow-operating activity        363.97     112.54     347.56     224.96     345.57

Net cash used in investing activity     99.44      73.82     -10.35     -32.74    -212.06

Netcash used in fin. activity         -474.14    -200.41    -320.50    -181.71    -139.50

Net inc/dec in cash and equivlnt       -10.73     -14.05      16.71      10.51       -5.99

Cash and equivalnt begin of year        37.53      43.14      26.43      16.32      22.31

Cash and equivalnt end of year          26.80      29.09      43.14      26.83      16.32
Quarterly results in brief
                                    Sep ' 12     Jun ' 12          Mar ' 12               Dec ' 11          Sep ' 11

Sales                                959.05       852.07               847.90              831.37            765.38

Operating profit                     141.06       120.95               105.14              150.79            139.97

Interest                              67.40         62.92               57.50              101.09             77.34

Gross profit                         102.14         82.33               95.21               84.78             80.74

EPS (Rs)                               2.51          1.76                2.46                9.81              2.06

Quarterly results in details
                                               Sep ' 12     Jun ' 12        Mar ' 12          Dec ' 11      Sep ' 11

Other income                                     28.48        24.30               47.57         35.08         18.11

Stock adjustment                                -30.73       -54.85               -3.39         -28.29        30.60

Raw material                                    413.49       370.79              377.14        376.86        314.96

Power and fuel                                  104.27        98.61               96.04         90.23         67.95

Employee expenses                               111.62        99.42               95.09         92.29         75.26

Excise                                                -            -                  -                 -          -

Admin and selling expenses                            -            -                  -                 -          -

Research and development expenses                     -            -                  -                 -          -

Expenses capitalised                                  -            -                  -                 -          -

Other expenses                                  219.34       217.15              177.88        149.49        136.64

Provisions made                                       -            -                  -                 -          -

Depreciation                                     37.34        36.18               32.69         32.81         28.30

Taxation                                              -        0.69                   -                 -          -

Net profit / loss                                64.80        45.46               62.52        249.91         52.40

Extra ordinary item                                   -            -                  -        197.94          -0.04

Prior year adjustments                                -            -                  -                 -          -

Equity capital                                  258.04       258.04              254.63        254.63        254.56

Equity dividend rate                                  -            -                  -                 -          -

Agg.of non-prom. shares (Lacs)                 1482.98      1482.96             1449.29       1441.82       1440.39

Agg.of non promotoholding (%)                    57.47        57.47               56.92         56.62         56.58

OPM (%)                                          14.71        14.19               12.40         18.14         18.29

GPM (%)                                          10.34         9.39               10.63              9.78     10.31

NPM (%)                                           6.56         5.19                6.98         28.84          6.69
Half yearly results in brief
                                    Sep ' 12     Mar ' 12         Sep ' 11               Mar ' 11          Sep ' 10

Sales                               1,811.12     1,679.27         1,587.14               1,458.99          1,232.23

Operating profit                     262.01        255.93          286.05                  226.33           184.73

Interest                             130.32        158.59          145.82                   94.04           100.57

Gross profit                         184.47        179.99          173.78                  143.81           107.15

EPS (Rs)                                4.27        12.27              4.66                  3.44              2.01

Half yearly results in details
                                               Sep ' 12     Mar ' 12          Sep ' 11       Mar ' 11      Sep ' 10

Other income                                     52.78         82.65            33.55           11.52        22.99

Stock adjustment                                -85.58        -31.68            30.59          -57.01        -35.71

Raw material                                    784.28        754.00           707.27          721.27       568.88

Power and fuel                                  202.88        186.27           135.12          123.69       120.00

Employee expenses                               211.04        187.38           147.76          140.69       133.21

Excise                                                -            -                 -                 -          -

Admin and selling expenses                            -            -                 -                 -          -

Research and development expenses                     -            -                 -                 -          -

Expenses capitalised                                  -            -                 -                 -          -

Other expenses                                  436.49        327.37           280.35          304.02       261.12

Provisions made                                       -            -                 -                 -          -

Depreciation                                     73.52         65.50            56.87           56.32        59.84

Taxation                                          0.69             -                 -                 -          -

Net profit / loss                               110.26        312.43           118.73           87.49        47.31

Extra ordinary item                                   -       197.94             1.82                  -          -

Prior year adjustments                                -            -                 -                 -          -

Equity capital                                  258.04        254.63           254.56          254.40       234.98

Equity dividend rate                                  -            -                 -                 -          -

Agg.of non-prom. shares (Lacs)                 1482.98      1449.29           1440.39         1436.43      1430.36

Agg.of non promotoholding (%)                    57.47         56.92            56.58           56.46        60.87

OPM (%)                                          14.47         15.24            18.02           15.51        14.99

GPM (%)                                           9.90         10.22            10.72               9.78      8.54

NPM (%)                                           5.92         17.73             7.33               5.95      3.77
Annual results in brief
                                    Mar ' 12      Mar ' 11         Mar ' 10                Mar ' 09          Mar ' 08

Sales                               3,494.12      2,691.22          2,316.89               2,344.99          2,271.27

Operating profit                      501.24        411.04              309.44               256.84            287.50

Interest                              270.25        194.59              155.47               222.13            131.40

Gross profit                          364.98        250.96              165.80                86.62            172.55

EPS (Rs)                               17.05          5.30                2.24                -2.23              1.25

Annual results in details
                                               Mar ' 12      Mar ' 11        Mar ' 10         Mar ' 09       Mar ' 08

Other income                                     133.99         34.51              11.83         51.91          16.45

Stock adjustment                                   4.28        -93.59              18.78         -34.86         -9.49

Raw material                                   1,568.76      1,290.15             968.73        695.83         577.13

Power and fuel                                   349.24        243.69             208.62        270.84         215.00

Employee expenses                                360.51        273.90             240.90        244.81         233.40

Excise                                                -             -                  -                 -          -

Admin and selling expenses                            -             -                  -                 -          -

Research and development expenses                     -             -                  -                 -          -

Expenses capitalised                                  -             -                  -                 -          -

Other expenses                                   710.09        566.03             570.42        911.53         967.73

Provisions made                                       -             -                  -                 -          -

Depreciation                                     130.51        116.16             113.80        122.05         136.64

Taxation                                              -             -                  -              1.86       2.25

Net profit / loss                                434.23        134.80              52.00         -48.82         27.36

Extra ordinary item                              199.76             -                  -         -11.53         -6.30

Prior year adjustments                                -             -                  -              0.95          -

Equity capital                                   254.63        254.40             231.98        218.98         218.98

Equity dividend rate                                  -             -                  -                 -          -

Agg.of non-prom. shares (Lacs)                 1449.29       1436.43             1420.67       1416.62       1384.88

Agg.of non promotoHolding (%)                     56.92         56.46              61.24         64.69          63.24

OPM (%)                                           14.35         15.27              13.36         10.95          12.66

GPM (%)                                           10.06          9.21               7.12              3.61       7.54

NPM (%)                                           11.97          4.95               2.23          -2.04          1.20
Dividend
Year                             Month                                Dividend (%)

2012                             May                                  10

2006                             Apr                                  10

2005                             Apr                                  10

1998                             Jun                                  25

1997                             Jun                                  45


Share holding
Share holding pattern as on :                                              30/09/2012            30/06/2012               31/03/2012

Face value                                                                        10.00                10.00                   10.00

                                       No. Of Shares   % Holding       No. Of Shares       % Holding   No. Of Shares      % Holding

                                                         Promoter's holding

Indian Promoters                          109744811         42.53           109746905          42.53       109703662           43.08

Sub total                                 109744811         42.53           109746905          42.53       109703662           43.08

                                                       Non promoter's holding

                                                        Institutional investors

Banks Fin. Inst. and Insurance             17702639           6.86           17715892           6.87           17676330         6.94

FII's                                      38457493         14.90            40002381          15.50           39559997        15.54

Sub total                                  86659038         33.58            86381113          33.48           85404807        33.54

                                                           Other investors

Private Corporate Bodies                    8613659           3.34            9238538           3.58           9654142          3.79

NRI's/OCB's/Foreign Others                  1717946           0.67            1694031           0.66           1729814          0.68

GDR/ADR                                      611410           0.24                660226        0.26            660226          0.26

Govt                                             22               -                   22           -                  -            -

Others                                      1204861           0.47                648000        0.25                  -            -

Sub total                                  12147898           4.71           12240817           4.74           12044182         4.73

General public                             49491322         19.18            49674234          19.25           47479890        18.65

Grand total                               258043069        100.00           258043069         100.00       254632541         100.00
Capital structure
From    To     Class Of       Authorized    Issued   Paid Up Shares   Paid Up Face   Paid Up
Year    Year   Share             Capital   Capital            (Nos)          Value   Capital

2011    2012   Equity Share       565.00   254.63        254632541             10     254.63

2010    2011   Equity Share       360.00   254.40        254399141             10     254.40

2009    2010   Equity Share       360.00   231.98        231977541             10     231.98

2008    2009   Equity Share       360.00   218.98        218977541             10     218.98

2007    2008   Equity Share       360.00   218.98        218977541             10     218.98

2006    2007   Equity Share       230.00   209.38        209377541             10     209.38

2005    2006   Equity Share       230.00   209.38        209378441             10     209.38

2004    2005   Equity Share       230.00   195.38        195378441             10     195.38

2004    2005   Equity Share       230.00   195.38          6950000            100      69.50

2003    2004   Equity Share       230.00   195.38        195378441             10     195.38

2002    2003   Equity Share       230.00   176.17        176172386             10     176.17

2001    2002   Equity Share       230.00   175.96        175962404             10     175.96

2001    2002   Equity Share       230.00   175.96            50000            100       0.50

2001    2002   Equity Share       230.00   175.96          6050000            100      60.50

2001    2002   Equity Share       230.00   175.96           800000            100       8.00

2000    2001   Equity Share       230.00   100.55        100549945             10     100.55

1999    2000   Equity Share       110.00   100.55        100549945             10     100.55

1998    1999   Equity Share       110.00   100.55        100549945             10     100.55

1997    1998   Equity Share       110.00   100.55        100549945             10     100.55

1996    1997   Equity Share     1,000.00   100.55        100549945             10     100.55

1995    1996   Equity Share       100.00     99.86        99858435             10      99.86

1994    1995   Equity Share       150.00     99.49        99490172             10      99.49

1993    1994   Equity Share       150.00     70.00        70002570             10      70.00

1992    1993   Equity Share       100.00     40.33        40329756             10      40.33

1991    1992   Equity Share        60.00     13.64        13641820             10      13.64

1990    1991   Equity Share        40.00     10.39        10387910             10      10.39

1988    1990   Equity Share        20.00      7.13         7134000             10       7.13

1987    1988   Equity Share         8.00      4.00         4000000             10       4.00

1986    1987   Equity Share         4.00      4.00         4000000             10       4.00

1980    1986   Equity Share         3.21      3.00          300000            100       3.00

1979    1980   Equity Share         2.50      2.50          250255            100       2.50
From   To     Class Of       Authorized    Issued   Paid Up Shares   Paid Up Face   Paid Up
Year   Year   Share             Capital   Capital            (Nos)          Value   Capital

1975   1979   Equity Share         2.50      2.50          250000            100       2.50

1971   1975   Equity Share         2.00      2.00          200000            100       2.00

1967   1971   Equity Share         1.50      1.50          150000            100       1.50

1966   1967   Equity Share         1.00      1.00          100000            100       1.00

1962   1966   Equity Share         1.00      1.00          100000            100       1.00

1956   1962   Equity Share         0.60      0.60           60000            100       0.60

1953   1956   Equity Share         0.26      0.26           26250            100       0.26

1952   1953   Equity Share         0.21      0.21           21000            100       0.21

1949   1952   Equity Share         0.21      0.21           21000            100       0.21
Ratios
                                            Mar ' 12   Mar ' 11   Mar ' 10   Mar ' 09   Mar ' 08

Per share ratios
Adjusted EPS (Rs)                               7.16       2.78       0.83      -1.38      -3.05

Adjusted cash EPS (Rs)                         12.29       7.35       5.74       4.20       3.19

Reported EPS (Rs)                              17.05       5.30       2.21      -2.26       1.14

Reported cash EPS (Rs)                         22.18       9.86       7.11       3.31       7.38

Dividend per share                              1.00          -          -          -          -

Operating profit per share (Rs)                19.68      15.09      13.34      11.74      10.46

Book value (excl rev res) per share (Rs)       79.20      58.59      57.73      51.55      63.11

Book value (incl rev res) per share (Rs.)      79.20      70.61      60.89      52.18      64.23

Net operating income per share (Rs)           137.22     104.70      99.87     107.08     101.08

Free reserves per share (Rs)                       -      43.61      42.11      44.10      51.10

Profitability ratios
Operating margin (%)                           14.34      14.41      13.35      10.96      10.34

Gross profit margin (%)                        10.61      10.05       8.44       5.75       4.17

Net profit margin (%)                          11.96       5.02       2.20      -1.99       1.22

Adjusted cash margin (%)                        8.62       6.96       5.68       3.90       3.23

Adjusted return on net worth (%)                9.04       4.74       1.43      -2.66      -4.83

Reported return on net worth (%)               21.53       9.04       3.82      -4.38       1.80

Return on long term funds (%)                  18.59      11.34       9.61       7.76       4.34

Leverage ratios
Long term debt / Equity                         0.35       0.69       0.81       1.13       0.90

Total debt/equity                               0.79       1.22       1.40       1.79       1.37

Owners fund as % of total source               55.71      45.12      41.72      35.78      42.20

Fixed assets turnover ratio                     0.96       0.84       0.77       0.85       0.84

Liquidity ratios
Current ratio                                   1.84       2.77       3.26       2.62       3.72

Current ratio (inc. st loans)                   0.66       0.81       0.74       0.74       0.86

Quick ratio                                     1.11       1.70       2.31       1.66       2.27

Inventory turnover ratio                        4.82       3.99       5.84       4.22       4.13

Payout ratios
Dividend payout ratio (net profit)              6.90          -       0.25          -       1.68
Mar ' 12   Mar ' 11   Mar ' 10   Mar ' 09   Mar ' 08

Dividend payout ratio (cash profit)         5.31          -       0.07       0.40       0.26

Earning retention ratio                    83.57     100.00      99.33          -     100.62

Cash earnings retention ratio              90.42     100.00      99.91      99.69      99.40

Coverage ratios
Adjusted cash flow time total debt          5.12       9.70      13.98      21.62      25.91

Financial charges coverage ratio            2.36       1.87       1.63       1.45       1.42

Fin. charges cov.ratio (post tax)           3.09       2.16       1.78       1.35       1.93

Component ratios
Material cost component (% earnings)       53.15      57.05      52.61      49.12      50.81

Selling cost Component                         -       2.05       2.43       5.74       5.06

Exports as percent of total sales          42.63      42.70      45.81      39.28      43.54

Import comp. in raw mat. consumed           8.53       5.23      13.77      11.38       9.22

Long term assets / total Assets             0.60       0.54       0.59       0.54       0.56

Bonus component in equity capital (%)       1.54       1.54       1.69       1.79       1.79
Arvind Mills Organization structure


Sanjay S. Lalbhai
CHAIRMAN AND MANAGING DIRECTOR


Jayesh K. Shah
DIRECTOR AND CHIEF FINANCIAL OFFICER


S R. Rao
Nominee of EXIM Bank


K M Jayarao
Nominee of ICICI Bank


Sudhir Mehta
Independent Director


Tarun Seth
Independent Director


Munesh Khanna
Independent Director


 (0) Add >>
arvind Mills


Type           Public (NSE, BSE)


Industry       Textiles


Founded        1931


Headquarters   Ahmedabad


Key people     Sanjay Lalbhai (CEO &MD) Arvind N. Lalbhai


Products       Denim, Knits, Khakhis


Revenue        Rs. 52.35 Billion


Net income     Profit Rs. 4.36 Billion[1]


Employees      25620[2]


Website        www.arvindmills.com
Registered Office

Naroda Road
City:Ahmedabad
State:Gujarat
Pincode:380025
Email ID:investor@arvind.com
Web Url:http://www.arvind.com
Overseas Office

Plot No.221
Bir Uttam Mir Shawkat Road
(Gulshan – Tejgaon Link Road)
City:Dhaka
State:Not Specified
Pincode:1208
Email ID:p.anilkumar@arvind.com

Unit:1705,
17th flr,Trendy Centre, 682-684,
Castle Peak Road, Cheung Sha Wan,
City:Not Specified
State:Not Specified
Email ID:arvindmills@netvigator.com

584, Broadway New York,
Suite 801
City:New York
State:Not Specified
Pincode:10012
Email ID:viresh@arvinddenimlab.com

130, West 42nd Street,
Suite No.603,
6th Floor.
City:New York
State:Not Specified
Pincode:10036
Email ID:raju@arvindusa.com

Paragon House,
Apartment No.5A, House no .15,
Road No.24 CWN(C)
City:Dhaka
State:Not Specified
Pincode:1212
Email ID:p.anilkumar@arvind.com
Factory/plant

Denim,
Naroda Road
City:Ahmedabad
State:Gujarat
Pincode:380025
Email ID:subir.mukherjee@arvind.in

Lifestyle Apparel - Shirts,
No.23/1, Sonnenahalli Village,
Sitarampalya Cross,
City:Bangalore
State:Karnataka
Pincode:560048
Email ID:ashish.kumar@arvindexports.com

LifeStyle Fabrics-
Shirting , Khakis & Knitwear,
PO Khatrej,
City:Gandhi Nagar Dist.
State:Gujarat
Pincode:382721
Email ID:pranav.dave@arvind.in

Lifestyle Fabrics-Knits:
PO Khatrej,
Taluka Kalol
City:Gandhi Nagar Dist.
State:Gujarat
Pincode:382721
Email ID:nitin.seth@arvind.in

Lifestyle Fabrics -Voiles:
Ankur Textiles,
Outside Raipur Gate
City:Ahmedabad
State:Gujarat
Pincode:380022
Email ID:brijesh.bhati@arvind.in

Lifestyle Apparel - Jeans,
26/2 , 27/2 Kenchenahaili,
Mysore Road,
City:Bangalore
State:Karnataka
Pincode:560059
Email ID:ashish.kumar@arvindexports.com

Arvind Intex, Rajpur Road,
Gomtipur
City:Ahmedabad
State:Gujarat
Pincode:380021

Ankur Textiles,
Outside Raipur Gate
City:Ahmedabad
State:Gujarat
Pincode:380022

Arvind Polycot,
Khatrej, Taluka Kalol
City:Gandhi Nagar Dist.
State:Gujarat
Pincode:382721

Arvind Cotspin,
D-64, MIDC,
Gokul Shirgaon,
City:Kolhapur
State:Maharashtra
Pincode:416234
Management
                      Name                               Designation

               Bakul Dholakia                                   Director


              G M Yadwadkar                            Nominee Director


              Jayesh K Shah                              Director & CFO


                 Kulin Lalbhai                        Executive Director


             Munesh Khanna                                      Director


              Prabhakar Dalal                          Nominee Director


                Punit Lalbhai                         Executive Director


                 R V Bhimani     Company Secretary & Compliance Officer


                 R V Bhimani                                  Secretary


             Renuka Ramnath                                     Director


             Sanjay S Lalbhai                                      CEO


             Sanjay S Lalbhai             Chairman & Managing Director


                Sudhir Mehta                                    Director

More Related Content

What's hot

Equity Valuation - Amara Raja Batteries
Equity Valuation - Amara Raja BatteriesEquity Valuation - Amara Raja Batteries
Equity Valuation - Amara Raja BatteriesAbbas Badami
 
05. Basic Hotel's Accounting by Dino Leonandri-STP Trisakti
05. Basic Hotel's Accounting  by Dino Leonandri-STP Trisakti05. Basic Hotel's Accounting  by Dino Leonandri-STP Trisakti
05. Basic Hotel's Accounting by Dino Leonandri-STP TrisaktiDINOLEONANDRI
 
MBL Infrastructure IPO
MBL Infrastructure IPOMBL Infrastructure IPO
MBL Infrastructure IPOKunal
 
RyderPresReleasTablesQ32005
RyderPresReleasTablesQ32005RyderPresReleasTablesQ32005
RyderPresReleasTablesQ32005finance44
 
Annual financials for canadian solar inc
Annual financials for canadian solar incAnnual financials for canadian solar inc
Annual financials for canadian solar incfredie_isagua
 
qwest communications Q_1q08_profile_v2
qwest communications Q_1q08_profile_v2qwest communications Q_1q08_profile_v2
qwest communications Q_1q08_profile_v2finance19
 
Fundamental Equity Analysis - World Gold Miners
Fundamental Equity Analysis - World Gold MinersFundamental Equity Analysis - World Gold Miners
Fundamental Equity Analysis - World Gold MinersBCV
 
tjx Annual Reports1997
tjx Annual Reports1997tjx Annual Reports1997
tjx Annual Reports1997finance14
 
Progressive_ 2004 review
Progressive_ 2004 reviewProgressive_ 2004 review
Progressive_ 2004 reviewfinance18
 
conoco phillips 2008Fourth Quarter
conoco phillips 2008Fourth Quarterconoco phillips 2008Fourth Quarter
conoco phillips 2008Fourth Quarterfinance1
 
Balance sheet of state bank of india (1)
Balance sheet of state bank of india (1)Balance sheet of state bank of india (1)
Balance sheet of state bank of india (1)shikha20102347
 
MHK-ar1999_financial
MHK-ar1999_financialMHK-ar1999_financial
MHK-ar1999_financialfinance30
 

What's hot (18)

Pantaloon 2008 2009
Pantaloon 2008 2009Pantaloon 2008 2009
Pantaloon 2008 2009
 
Equity Valuation - Amara Raja Batteries
Equity Valuation - Amara Raja BatteriesEquity Valuation - Amara Raja Batteries
Equity Valuation - Amara Raja Batteries
 
05. Basic Hotel's Accounting by Dino Leonandri-STP Trisakti
05. Basic Hotel's Accounting  by Dino Leonandri-STP Trisakti05. Basic Hotel's Accounting  by Dino Leonandri-STP Trisakti
05. Basic Hotel's Accounting by Dino Leonandri-STP Trisakti
 
MBL Infrastructure IPO
MBL Infrastructure IPOMBL Infrastructure IPO
MBL Infrastructure IPO
 
RyderPresReleasTablesQ32005
RyderPresReleasTablesQ32005RyderPresReleasTablesQ32005
RyderPresReleasTablesQ32005
 
Annual financials for canadian solar inc
Annual financials for canadian solar incAnnual financials for canadian solar inc
Annual financials for canadian solar inc
 
Crisil data
Crisil dataCrisil data
Crisil data
 
qwest communications Q_1q08_profile_v2
qwest communications Q_1q08_profile_v2qwest communications Q_1q08_profile_v2
qwest communications Q_1q08_profile_v2
 
Fundamental Equity Analysis - World Gold Miners
Fundamental Equity Analysis - World Gold MinersFundamental Equity Analysis - World Gold Miners
Fundamental Equity Analysis - World Gold Miners
 
Atp Oil
Atp OilAtp Oil
Atp Oil
 
tjx Annual Reports1997
tjx Annual Reports1997tjx Annual Reports1997
tjx Annual Reports1997
 
Progressive_ 2004 review
Progressive_ 2004 reviewProgressive_ 2004 review
Progressive_ 2004 review
 
Bank of rajasthan
Bank of rajasthanBank of rajasthan
Bank of rajasthan
 
DABUR- DONE BY SNEHA
DABUR- DONE BY SNEHADABUR- DONE BY SNEHA
DABUR- DONE BY SNEHA
 
conoco phillips 2008Fourth Quarter
conoco phillips 2008Fourth Quarterconoco phillips 2008Fourth Quarter
conoco phillips 2008Fourth Quarter
 
Harpreet
HarpreetHarpreet
Harpreet
 
Balance sheet of state bank of india (1)
Balance sheet of state bank of india (1)Balance sheet of state bank of india (1)
Balance sheet of state bank of india (1)
 
MHK-ar1999_financial
MHK-ar1999_financialMHK-ar1999_financial
MHK-ar1999_financial
 

Similar to Balance sheet

Jubilant Foods Ipo
Jubilant Foods IpoJubilant Foods Ipo
Jubilant Foods IpoKunal
 
Profit Loss Account Of Tata Motors
Profit Loss Account Of Tata MotorsProfit Loss Account Of Tata Motors
Profit Loss Account Of Tata Motorspurval
 
Eastboro case analysis
Eastboro case analysisEastboro case analysis
Eastboro case analysisFajar Muhammad
 
Thangamayil Jwellery
Thangamayil JwelleryThangamayil Jwellery
Thangamayil JwelleryKunal
 
Basic Hotel Accounting Principles #4 Session by Dino Leonandri
Basic Hotel Accounting Principles  #4 Session by Dino LeonandriBasic Hotel Accounting Principles  #4 Session by Dino Leonandri
Basic Hotel Accounting Principles #4 Session by Dino LeonandriDINOLEONANDRI
 
Saral Gyan 15% @ 90 DAYS Sept 2010
Saral Gyan 15% @ 90 DAYS Sept 2010Saral Gyan 15% @ 90 DAYS Sept 2010
Saral Gyan 15% @ 90 DAYS Sept 2010SaralGyanTeam
 
Surya roshini blncsheet
Surya roshini blncsheetSurya roshini blncsheet
Surya roshini blncsheetnaughtiegirl
 
Nordnet Q3 2011 report
Nordnet Q3 2011 reportNordnet Q3 2011 report
Nordnet Q3 2011 reportNordnet
 
financial statement analysis of Idea Cellular
financial statement analysis of Idea Cellularfinancial statement analysis of Idea Cellular
financial statement analysis of Idea CellularDeepak Srivastva
 
conoco phillips 2008Third Quarter
conoco phillips 2008Third Quarterconoco phillips 2008Third Quarter
conoco phillips 2008Third Quarterfinance1
 
conoco phillips 2008Second Quarter
conoco phillips 2008Second Quarterconoco phillips 2008Second Quarter
conoco phillips 2008Second Quarterfinance1
 
J J FOAM MODERANISATION
J J FOAM MODERANISATIONJ J FOAM MODERANISATION
J J FOAM MODERANISATIONPawan Gupta
 
Nordnet Q2 2011 report
Nordnet Q2 2011 reportNordnet Q2 2011 report
Nordnet Q2 2011 reportNordnet
 
Findings analysis & conclusion
Findings analysis & conclusionFindings analysis & conclusion
Findings analysis & conclusionAshish Aggarwal
 
atmos enerrgy segmentinfo040408
atmos enerrgy segmentinfo040408atmos enerrgy segmentinfo040408
atmos enerrgy segmentinfo040408finance35
 
northan trust corp._Financial_web_2006
northan trust corp._Financial_web_2006northan trust corp._Financial_web_2006
northan trust corp._Financial_web_2006finance38
 

Similar to Balance sheet (20)

Jubilant Foods Ipo
Jubilant Foods IpoJubilant Foods Ipo
Jubilant Foods Ipo
 
Profit Loss Account Of Tata Motors
Profit Loss Account Of Tata MotorsProfit Loss Account Of Tata Motors
Profit Loss Account Of Tata Motors
 
Eastboro case analysis
Eastboro case analysisEastboro case analysis
Eastboro case analysis
 
Thangamayil Jwellery
Thangamayil JwelleryThangamayil Jwellery
Thangamayil Jwellery
 
Basic Hotel Accounting Principles #4 Session by Dino Leonandri
Basic Hotel Accounting Principles  #4 Session by Dino LeonandriBasic Hotel Accounting Principles  #4 Session by Dino Leonandri
Basic Hotel Accounting Principles #4 Session by Dino Leonandri
 
Saral Gyan 15% @ 90 DAYS Sept 2010
Saral Gyan 15% @ 90 DAYS Sept 2010Saral Gyan 15% @ 90 DAYS Sept 2010
Saral Gyan 15% @ 90 DAYS Sept 2010
 
Capita template2
Capita template2Capita template2
Capita template2
 
Surya roshini blncsheet
Surya roshini blncsheetSurya roshini blncsheet
Surya roshini blncsheet
 
Nordnet Q3 2011 report
Nordnet Q3 2011 reportNordnet Q3 2011 report
Nordnet Q3 2011 report
 
financial statement analysis of Idea Cellular
financial statement analysis of Idea Cellularfinancial statement analysis of Idea Cellular
financial statement analysis of Idea Cellular
 
conoco phillips 2008Third Quarter
conoco phillips 2008Third Quarterconoco phillips 2008Third Quarter
conoco phillips 2008Third Quarter
 
conoco phillips 2008Second Quarter
conoco phillips 2008Second Quarterconoco phillips 2008Second Quarter
conoco phillips 2008Second Quarter
 
J J FOAM MODERANISATION
J J FOAM MODERANISATIONJ J FOAM MODERANISATION
J J FOAM MODERANISATION
 
Hul balance sheet
Hul balance sheetHul balance sheet
Hul balance sheet
 
Nordnet Q2 2011 report
Nordnet Q2 2011 reportNordnet Q2 2011 report
Nordnet Q2 2011 report
 
Business Plan
Business PlanBusiness Plan
Business Plan
 
Findings analysis & conclusion
Findings analysis & conclusionFindings analysis & conclusion
Findings analysis & conclusion
 
atmos enerrgy segmentinfo040408
atmos enerrgy segmentinfo040408atmos enerrgy segmentinfo040408
atmos enerrgy segmentinfo040408
 
northan trust corp._Financial_web_2006
northan trust corp._Financial_web_2006northan trust corp._Financial_web_2006
northan trust corp._Financial_web_2006
 
Cipla 20-09-2010
Cipla   20-09-2010Cipla   20-09-2010
Cipla 20-09-2010
 

Balance sheet

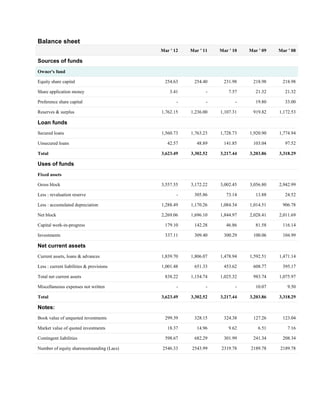
  • 1. Balance sheet Mar ' 12 Mar ' 11 Mar ' 10 Mar ' 09 Mar ' 08 Sources of funds Owner's fund Equity share capital 254.63 254.40 231.98 218.98 218.98 Share application money 3.41 - 7.57 21.32 21.32 Preference share capital - - - 19.80 33.00 Reserves & surplus 1,762.15 1,236.00 1,107.31 919.82 1,172.53 Loan funds Secured loans 1,560.73 1,763.23 1,728.73 1,920.90 1,774.94 Unsecured loans 42.57 48.89 141.85 103.04 97.52 Total 3,623.49 3,302.52 3,217.44 3,203.86 3,318.29 Uses of funds Fixed assets Gross block 3,557.55 3,172.22 3,002.45 3,056.80 2,942.99 Less : revaluation reserve - 305.86 73.14 13.88 24.52 Less : accumulated depreciation 1,288.49 1,170.26 1,084.34 1,014.51 906.78 Net block 2,269.06 1,696.10 1,844.97 2,028.41 2,011.69 Capital work-in-progress 179.10 142.28 46.86 81.58 116.14 Investments 337.11 309.40 300.29 100.06 104.99 Net current assets Current assets, loans & advances 1,839.70 1,806.07 1,478.94 1,592.51 1,471.14 Less : current liabilities & provisions 1,001.48 651.33 453.62 608.77 395.17 Total net current assets 838.22 1,154.74 1,025.32 983.74 1,075.97 Miscellaneous expenses not written - - - 10.07 9.50 Total 3,623.49 3,302.52 3,217.44 3,203.86 3,318.29 Notes: Book value of unquoted investments 299.39 328.15 324.38 127.26 123.04 Market value of quoted investments 18.37 14.96 9.62 6.51 7.16 Contingent liabilities 598.67 682.29 301.99 241.34 208.34 Number of equity sharesoutstanding (Lacs) 2546.33 2543.99 2319.78 2189.78 2189.78
  • 2. Profit loss account Mar ' 12 Mar ' 11 Mar ' 10 Mar ' 09 Mar ' 08 Income Operating income 3,493.98 2,663.58 2,316.75 2,344.82 2,213.32 Expenses Material consumed 1,861.31 1,426.14 1,237.65 1,116.98 1,115.12 Manufacturing expenses 440.71 410.11 344.64 387.73 338.48 Personnel expenses 360.51 273.90 240.90 244.81 234.74 Selling expenses - 54.86 56.35 134.70 112.00 Adminstrative expenses 330.21 114.57 127.77 203.54 184.01 Expenses capitalised - - - - - Cost of sales 2,992.74 2,279.58 2,007.31 2,087.76 1,984.35 Operating profit 501.24 384.00 309.44 257.06 228.97 Other recurring income 135.81 18.34 37.70 52.57 22.75 Adjusted PBDIT 637.05 402.34 347.14 309.63 251.72 Financial expenses 270.25 215.44 213.32 214.16 177.20 Depreciation 130.51 116.16 113.80 122.05 136.64 Other write offs - - - - - Adjusted PBT 236.29 70.74 20.02 -26.58 -62.12 Tax charges 53.86 - - 1.86 2.25 Adjusted PAT 182.43 - - -28.44 -64.37 Non recurring items 251.80 62.37 31.80 -106.62 74.36 Other non cash adjustments - 1.69 0.18 7.09 16.03 Reported net profit 434.23 134.80 52.00 -127.97 26.02 Earnigs before appropriation 829.66 449.22 333.91 306.95 451.02 Equity dividend 25.80 - - - - Preference dividend - - 0.76 1.68 2.48 Dividend tax 4.19 - 0.13 0.29 0.42 Retained earnings 799.67 449.22 333.02 304.98 448.12
  • 3. Cash flow Mar ' 12 Mar ' 11 Mar ' 10 Mar ' 09 Mar ' 08 Profit before tax 488.09 134.80 52.00 -46.96 29.61 Net cashflow-operating activity 363.97 112.54 347.56 224.96 345.57 Net cash used in investing activity 99.44 73.82 -10.35 -32.74 -212.06 Netcash used in fin. activity -474.14 -200.41 -320.50 -181.71 -139.50 Net inc/dec in cash and equivlnt -10.73 -14.05 16.71 10.51 -5.99 Cash and equivalnt begin of year 37.53 43.14 26.43 16.32 22.31 Cash and equivalnt end of year 26.80 29.09 43.14 26.83 16.32
  • 4. Quarterly results in brief Sep ' 12 Jun ' 12 Mar ' 12 Dec ' 11 Sep ' 11 Sales 959.05 852.07 847.90 831.37 765.38 Operating profit 141.06 120.95 105.14 150.79 139.97 Interest 67.40 62.92 57.50 101.09 77.34 Gross profit 102.14 82.33 95.21 84.78 80.74 EPS (Rs) 2.51 1.76 2.46 9.81 2.06 Quarterly results in details Sep ' 12 Jun ' 12 Mar ' 12 Dec ' 11 Sep ' 11 Other income 28.48 24.30 47.57 35.08 18.11 Stock adjustment -30.73 -54.85 -3.39 -28.29 30.60 Raw material 413.49 370.79 377.14 376.86 314.96 Power and fuel 104.27 98.61 96.04 90.23 67.95 Employee expenses 111.62 99.42 95.09 92.29 75.26 Excise - - - - - Admin and selling expenses - - - - - Research and development expenses - - - - - Expenses capitalised - - - - - Other expenses 219.34 217.15 177.88 149.49 136.64 Provisions made - - - - - Depreciation 37.34 36.18 32.69 32.81 28.30 Taxation - 0.69 - - - Net profit / loss 64.80 45.46 62.52 249.91 52.40 Extra ordinary item - - - 197.94 -0.04 Prior year adjustments - - - - - Equity capital 258.04 258.04 254.63 254.63 254.56 Equity dividend rate - - - - - Agg.of non-prom. shares (Lacs) 1482.98 1482.96 1449.29 1441.82 1440.39 Agg.of non promotoholding (%) 57.47 57.47 56.92 56.62 56.58 OPM (%) 14.71 14.19 12.40 18.14 18.29 GPM (%) 10.34 9.39 10.63 9.78 10.31 NPM (%) 6.56 5.19 6.98 28.84 6.69
  • 5. Half yearly results in brief Sep ' 12 Mar ' 12 Sep ' 11 Mar ' 11 Sep ' 10 Sales 1,811.12 1,679.27 1,587.14 1,458.99 1,232.23 Operating profit 262.01 255.93 286.05 226.33 184.73 Interest 130.32 158.59 145.82 94.04 100.57 Gross profit 184.47 179.99 173.78 143.81 107.15 EPS (Rs) 4.27 12.27 4.66 3.44 2.01 Half yearly results in details Sep ' 12 Mar ' 12 Sep ' 11 Mar ' 11 Sep ' 10 Other income 52.78 82.65 33.55 11.52 22.99 Stock adjustment -85.58 -31.68 30.59 -57.01 -35.71 Raw material 784.28 754.00 707.27 721.27 568.88 Power and fuel 202.88 186.27 135.12 123.69 120.00 Employee expenses 211.04 187.38 147.76 140.69 133.21 Excise - - - - - Admin and selling expenses - - - - - Research and development expenses - - - - - Expenses capitalised - - - - - Other expenses 436.49 327.37 280.35 304.02 261.12 Provisions made - - - - - Depreciation 73.52 65.50 56.87 56.32 59.84 Taxation 0.69 - - - - Net profit / loss 110.26 312.43 118.73 87.49 47.31 Extra ordinary item - 197.94 1.82 - - Prior year adjustments - - - - - Equity capital 258.04 254.63 254.56 254.40 234.98 Equity dividend rate - - - - - Agg.of non-prom. shares (Lacs) 1482.98 1449.29 1440.39 1436.43 1430.36 Agg.of non promotoholding (%) 57.47 56.92 56.58 56.46 60.87 OPM (%) 14.47 15.24 18.02 15.51 14.99 GPM (%) 9.90 10.22 10.72 9.78 8.54 NPM (%) 5.92 17.73 7.33 5.95 3.77
  • 6. Annual results in brief Mar ' 12 Mar ' 11 Mar ' 10 Mar ' 09 Mar ' 08 Sales 3,494.12 2,691.22 2,316.89 2,344.99 2,271.27 Operating profit 501.24 411.04 309.44 256.84 287.50 Interest 270.25 194.59 155.47 222.13 131.40 Gross profit 364.98 250.96 165.80 86.62 172.55 EPS (Rs) 17.05 5.30 2.24 -2.23 1.25 Annual results in details Mar ' 12 Mar ' 11 Mar ' 10 Mar ' 09 Mar ' 08 Other income 133.99 34.51 11.83 51.91 16.45 Stock adjustment 4.28 -93.59 18.78 -34.86 -9.49 Raw material 1,568.76 1,290.15 968.73 695.83 577.13 Power and fuel 349.24 243.69 208.62 270.84 215.00 Employee expenses 360.51 273.90 240.90 244.81 233.40 Excise - - - - - Admin and selling expenses - - - - - Research and development expenses - - - - - Expenses capitalised - - - - - Other expenses 710.09 566.03 570.42 911.53 967.73 Provisions made - - - - - Depreciation 130.51 116.16 113.80 122.05 136.64 Taxation - - - 1.86 2.25 Net profit / loss 434.23 134.80 52.00 -48.82 27.36 Extra ordinary item 199.76 - - -11.53 -6.30 Prior year adjustments - - - 0.95 - Equity capital 254.63 254.40 231.98 218.98 218.98 Equity dividend rate - - - - - Agg.of non-prom. shares (Lacs) 1449.29 1436.43 1420.67 1416.62 1384.88 Agg.of non promotoHolding (%) 56.92 56.46 61.24 64.69 63.24 OPM (%) 14.35 15.27 13.36 10.95 12.66 GPM (%) 10.06 9.21 7.12 3.61 7.54 NPM (%) 11.97 4.95 2.23 -2.04 1.20
  • 7. Dividend Year Month Dividend (%) 2012 May 10 2006 Apr 10 2005 Apr 10 1998 Jun 25 1997 Jun 45 Share holding Share holding pattern as on : 30/09/2012 30/06/2012 31/03/2012 Face value 10.00 10.00 10.00 No. Of Shares % Holding No. Of Shares % Holding No. Of Shares % Holding Promoter's holding Indian Promoters 109744811 42.53 109746905 42.53 109703662 43.08 Sub total 109744811 42.53 109746905 42.53 109703662 43.08 Non promoter's holding Institutional investors Banks Fin. Inst. and Insurance 17702639 6.86 17715892 6.87 17676330 6.94 FII's 38457493 14.90 40002381 15.50 39559997 15.54 Sub total 86659038 33.58 86381113 33.48 85404807 33.54 Other investors Private Corporate Bodies 8613659 3.34 9238538 3.58 9654142 3.79 NRI's/OCB's/Foreign Others 1717946 0.67 1694031 0.66 1729814 0.68 GDR/ADR 611410 0.24 660226 0.26 660226 0.26 Govt 22 - 22 - - - Others 1204861 0.47 648000 0.25 - - Sub total 12147898 4.71 12240817 4.74 12044182 4.73 General public 49491322 19.18 49674234 19.25 47479890 18.65 Grand total 258043069 100.00 258043069 100.00 254632541 100.00
  • 8. Capital structure From To Class Of Authorized Issued Paid Up Shares Paid Up Face Paid Up Year Year Share Capital Capital (Nos) Value Capital 2011 2012 Equity Share 565.00 254.63 254632541 10 254.63 2010 2011 Equity Share 360.00 254.40 254399141 10 254.40 2009 2010 Equity Share 360.00 231.98 231977541 10 231.98 2008 2009 Equity Share 360.00 218.98 218977541 10 218.98 2007 2008 Equity Share 360.00 218.98 218977541 10 218.98 2006 2007 Equity Share 230.00 209.38 209377541 10 209.38 2005 2006 Equity Share 230.00 209.38 209378441 10 209.38 2004 2005 Equity Share 230.00 195.38 195378441 10 195.38 2004 2005 Equity Share 230.00 195.38 6950000 100 69.50 2003 2004 Equity Share 230.00 195.38 195378441 10 195.38 2002 2003 Equity Share 230.00 176.17 176172386 10 176.17 2001 2002 Equity Share 230.00 175.96 175962404 10 175.96 2001 2002 Equity Share 230.00 175.96 50000 100 0.50 2001 2002 Equity Share 230.00 175.96 6050000 100 60.50 2001 2002 Equity Share 230.00 175.96 800000 100 8.00 2000 2001 Equity Share 230.00 100.55 100549945 10 100.55 1999 2000 Equity Share 110.00 100.55 100549945 10 100.55 1998 1999 Equity Share 110.00 100.55 100549945 10 100.55 1997 1998 Equity Share 110.00 100.55 100549945 10 100.55 1996 1997 Equity Share 1,000.00 100.55 100549945 10 100.55 1995 1996 Equity Share 100.00 99.86 99858435 10 99.86 1994 1995 Equity Share 150.00 99.49 99490172 10 99.49 1993 1994 Equity Share 150.00 70.00 70002570 10 70.00 1992 1993 Equity Share 100.00 40.33 40329756 10 40.33 1991 1992 Equity Share 60.00 13.64 13641820 10 13.64 1990 1991 Equity Share 40.00 10.39 10387910 10 10.39 1988 1990 Equity Share 20.00 7.13 7134000 10 7.13 1987 1988 Equity Share 8.00 4.00 4000000 10 4.00 1986 1987 Equity Share 4.00 4.00 4000000 10 4.00 1980 1986 Equity Share 3.21 3.00 300000 100 3.00 1979 1980 Equity Share 2.50 2.50 250255 100 2.50
  • 9. From To Class Of Authorized Issued Paid Up Shares Paid Up Face Paid Up Year Year Share Capital Capital (Nos) Value Capital 1975 1979 Equity Share 2.50 2.50 250000 100 2.50 1971 1975 Equity Share 2.00 2.00 200000 100 2.00 1967 1971 Equity Share 1.50 1.50 150000 100 1.50 1966 1967 Equity Share 1.00 1.00 100000 100 1.00 1962 1966 Equity Share 1.00 1.00 100000 100 1.00 1956 1962 Equity Share 0.60 0.60 60000 100 0.60 1953 1956 Equity Share 0.26 0.26 26250 100 0.26 1952 1953 Equity Share 0.21 0.21 21000 100 0.21 1949 1952 Equity Share 0.21 0.21 21000 100 0.21
  • 10. Ratios Mar ' 12 Mar ' 11 Mar ' 10 Mar ' 09 Mar ' 08 Per share ratios Adjusted EPS (Rs) 7.16 2.78 0.83 -1.38 -3.05 Adjusted cash EPS (Rs) 12.29 7.35 5.74 4.20 3.19 Reported EPS (Rs) 17.05 5.30 2.21 -2.26 1.14 Reported cash EPS (Rs) 22.18 9.86 7.11 3.31 7.38 Dividend per share 1.00 - - - - Operating profit per share (Rs) 19.68 15.09 13.34 11.74 10.46 Book value (excl rev res) per share (Rs) 79.20 58.59 57.73 51.55 63.11 Book value (incl rev res) per share (Rs.) 79.20 70.61 60.89 52.18 64.23 Net operating income per share (Rs) 137.22 104.70 99.87 107.08 101.08 Free reserves per share (Rs) - 43.61 42.11 44.10 51.10 Profitability ratios Operating margin (%) 14.34 14.41 13.35 10.96 10.34 Gross profit margin (%) 10.61 10.05 8.44 5.75 4.17 Net profit margin (%) 11.96 5.02 2.20 -1.99 1.22 Adjusted cash margin (%) 8.62 6.96 5.68 3.90 3.23 Adjusted return on net worth (%) 9.04 4.74 1.43 -2.66 -4.83 Reported return on net worth (%) 21.53 9.04 3.82 -4.38 1.80 Return on long term funds (%) 18.59 11.34 9.61 7.76 4.34 Leverage ratios Long term debt / Equity 0.35 0.69 0.81 1.13 0.90 Total debt/equity 0.79 1.22 1.40 1.79 1.37 Owners fund as % of total source 55.71 45.12 41.72 35.78 42.20 Fixed assets turnover ratio 0.96 0.84 0.77 0.85 0.84 Liquidity ratios Current ratio 1.84 2.77 3.26 2.62 3.72 Current ratio (inc. st loans) 0.66 0.81 0.74 0.74 0.86 Quick ratio 1.11 1.70 2.31 1.66 2.27 Inventory turnover ratio 4.82 3.99 5.84 4.22 4.13 Payout ratios Dividend payout ratio (net profit) 6.90 - 0.25 - 1.68
  • 11. Mar ' 12 Mar ' 11 Mar ' 10 Mar ' 09 Mar ' 08 Dividend payout ratio (cash profit) 5.31 - 0.07 0.40 0.26 Earning retention ratio 83.57 100.00 99.33 - 100.62 Cash earnings retention ratio 90.42 100.00 99.91 99.69 99.40 Coverage ratios Adjusted cash flow time total debt 5.12 9.70 13.98 21.62 25.91 Financial charges coverage ratio 2.36 1.87 1.63 1.45 1.42 Fin. charges cov.ratio (post tax) 3.09 2.16 1.78 1.35 1.93 Component ratios Material cost component (% earnings) 53.15 57.05 52.61 49.12 50.81 Selling cost Component - 2.05 2.43 5.74 5.06 Exports as percent of total sales 42.63 42.70 45.81 39.28 43.54 Import comp. in raw mat. consumed 8.53 5.23 13.77 11.38 9.22 Long term assets / total Assets 0.60 0.54 0.59 0.54 0.56 Bonus component in equity capital (%) 1.54 1.54 1.69 1.79 1.79
  • 12. Arvind Mills Organization structure Sanjay S. Lalbhai CHAIRMAN AND MANAGING DIRECTOR Jayesh K. Shah DIRECTOR AND CHIEF FINANCIAL OFFICER S R. Rao Nominee of EXIM Bank K M Jayarao Nominee of ICICI Bank Sudhir Mehta Independent Director Tarun Seth Independent Director Munesh Khanna Independent Director (0) Add >>
  • 13. arvind Mills Type Public (NSE, BSE) Industry Textiles Founded 1931 Headquarters Ahmedabad Key people Sanjay Lalbhai (CEO &MD) Arvind N. Lalbhai Products Denim, Knits, Khakhis Revenue Rs. 52.35 Billion Net income Profit Rs. 4.36 Billion[1] Employees 25620[2] Website www.arvindmills.com
  • 14. Registered Office Naroda Road City:Ahmedabad State:Gujarat Pincode:380025 Email ID:investor@arvind.com Web Url:http://www.arvind.com Overseas Office Plot No.221 Bir Uttam Mir Shawkat Road (Gulshan – Tejgaon Link Road) City:Dhaka State:Not Specified Pincode:1208 Email ID:p.anilkumar@arvind.com Unit:1705, 17th flr,Trendy Centre, 682-684, Castle Peak Road, Cheung Sha Wan, City:Not Specified State:Not Specified Email ID:arvindmills@netvigator.com 584, Broadway New York, Suite 801 City:New York State:Not Specified Pincode:10012 Email ID:viresh@arvinddenimlab.com 130, West 42nd Street, Suite No.603, 6th Floor. City:New York State:Not Specified Pincode:10036 Email ID:raju@arvindusa.com Paragon House, Apartment No.5A, House no .15, Road No.24 CWN(C) City:Dhaka State:Not Specified Pincode:1212 Email ID:p.anilkumar@arvind.com Factory/plant Denim, Naroda Road City:Ahmedabad State:Gujarat Pincode:380025 Email ID:subir.mukherjee@arvind.in Lifestyle Apparel - Shirts, No.23/1, Sonnenahalli Village, Sitarampalya Cross, City:Bangalore State:Karnataka
  • 15. Pincode:560048 Email ID:ashish.kumar@arvindexports.com LifeStyle Fabrics- Shirting , Khakis & Knitwear, PO Khatrej, City:Gandhi Nagar Dist. State:Gujarat Pincode:382721 Email ID:pranav.dave@arvind.in Lifestyle Fabrics-Knits: PO Khatrej, Taluka Kalol City:Gandhi Nagar Dist. State:Gujarat Pincode:382721 Email ID:nitin.seth@arvind.in Lifestyle Fabrics -Voiles: Ankur Textiles, Outside Raipur Gate City:Ahmedabad State:Gujarat Pincode:380022 Email ID:brijesh.bhati@arvind.in Lifestyle Apparel - Jeans, 26/2 , 27/2 Kenchenahaili, Mysore Road, City:Bangalore State:Karnataka Pincode:560059 Email ID:ashish.kumar@arvindexports.com Arvind Intex, Rajpur Road, Gomtipur City:Ahmedabad State:Gujarat Pincode:380021 Ankur Textiles, Outside Raipur Gate City:Ahmedabad State:Gujarat Pincode:380022 Arvind Polycot, Khatrej, Taluka Kalol City:Gandhi Nagar Dist. State:Gujarat Pincode:382721 Arvind Cotspin, D-64, MIDC, Gokul Shirgaon, City:Kolhapur State:Maharashtra Pincode:416234
  • 16. Management Name Designation Bakul Dholakia Director G M Yadwadkar Nominee Director Jayesh K Shah Director & CFO Kulin Lalbhai Executive Director Munesh Khanna Director Prabhakar Dalal Nominee Director Punit Lalbhai Executive Director R V Bhimani Company Secretary & Compliance Officer R V Bhimani Secretary Renuka Ramnath Director Sanjay S Lalbhai CEO Sanjay S Lalbhai Chairman & Managing Director Sudhir Mehta Director