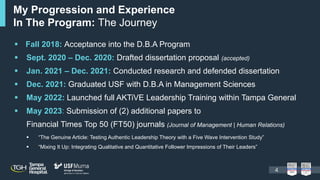
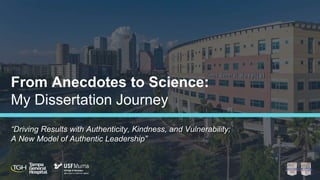
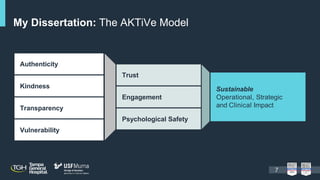
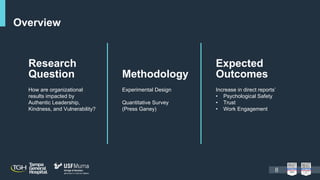
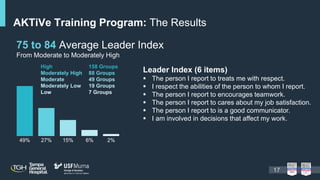
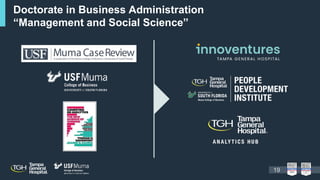
The AKTiVe
Model
John Couris, President & CEO
Florida Health Sciences Center, Inc. | Tampa General Hospital
Agenda
 My Why
 The Journey
 Dissertation Work and Process
 Continued Research
 Other Interesting Outcomes
 Discussion
2
Importance of being a lifelong learner
Put the science into management
(What’s the science behind running a business?
A scholar practitioner’s perspective)
Continuing Education: My “Why”
3
 “The Genuine Article: Testing Authentic Leadership Theory with a Five Wave Intervention Study”
 “Mixing It Up: Integrating Qualitative and Quantitative Follower Impressions of Their Leaders”
My Progression and Experience
In The Program: The Journey
 Fall 2018: Acceptance into the D.B.A Program
 Sept. 2020 – Dec. 2020: Drafted dissertation proposal (accepted)
 Jan. 2021 – Dec. 2021: Conducted research and defended dissertation
 Dec. 2021: Graduated USF with D.B.A in Management Sciences
 May 2022: Launched full AKTiVE Leadership Training within Tampa General
 May 2023: Submission of (2) additional papers to
Financial Times Top 50 (FT50) journals (Journal of Management | Human Relations)
4
Before The Work
5
From Anecdotes to Science:
My Dissertation Journey
“Driving Results with Authenticity, Kindness, and Vulnerability:
A New Model of Authentic Leadership”
Vulnerability
Authenticity
Transparency
Kindness
My Dissertation: The AKTiVe Model
7
Trust
Engagement
Psychological Safety
Sustainable
Operational, Strategic
and Clinical Impact
Overview
Research
Question
How are organizational
results impacted by
Authentic Leadership,
Kindness, and Vulnerability?
Methodology
Experimental Design
Quantitative Survey
(Press Ganey)
Expected
Outcomes
Increase in direct reports’
• Psychological Safety
• Trust
• Work Engagement
8
 Hypothesis 1: Direct reports of managers who attend the authentic leadership training will
report increased levels of authentic leadership from before to after training, whereas direct
reports of managers who did not attend the training will show no differences.
 Hypothesis 2: Direct reports of managers who attend the authentic leadership training will
report increased levels of psychological safety from before to after training, whereas direct
reports of managers who did not attend the training will show no differences.
 Hypothesis 3: Direct reports of managers who attend the authentic leadership training will
report increased levels of trust in their leader from before to after training, whereas direct
reports of managers who did not attend the training will show no differences.
 Hypothesis 4: Direct reports of managers who attend the authentic leadership training will
report increased levels of work engagement from before to after training, whereas direct
reports of managers who did not attend the training will show no differences.
My Dissertation: The Hypothesis
9
 Kirkpatrick Model: The gold standard tool for measuring
the effectiveness of training within an organization.
 Study Type: Intervention
 Random assignment to AKTiVe training vs. control group
 Pretest-posttest design
 Random sample of 44 TGH leaders
(23 in the intervention and 21 in control group)
My Dissertation: The Hypothesis
10
My Dissertation: The Hypothesis (Kirkpatrick Model)
 Level 1 Reactions: Very positive (mean 4.53 out of 5.0)
 Level 2 Knowledge: Mean test score = 96% (ten item multiple choice
quiz after the training)
 Level 3 Behavior: Nonsignificant trend for intervention group to increase and
control group to decrease (trend in the right direction, but not statistically
significant p-value was greater than .05)
 Level 4 Results: Nonsignificant trend for intervention group to increase and control
group to decrease on psychological safety, trust, and engagement
11
12
Summary of Findings
 Reactions were positive to the
training content, facilitators,
and in-person delivery
 The learning for the managers
was high - both by their self-reports’
appraisal and their performance
on a post-training test
 Hypotheses were not supported, but
for all outcomes, the data is trending
in the hypothesized direction
Continued Research
AKTiVe Research Group
14
John Couris, DBA
Eric Eisenberg, PhD
Joann Quinn, PhD
David Howard, PhD
Paul Spector, PhD
 Study Type: Intervention
 Random assignment to AKTiVe training vs. control group
 40 TGH leaders in 2 cohorts:
 Cohort 1 on May 3, 2022
 Cohort 2 on June 29, 2022
 Pretest-posttest design with 3 posttests over 6 months after training.
AKTiVe Training Program: The Method
15
 Level 1 Reactions: Extremely positive (4.9/5.0)
 Level 2 Knowledge: (10 question multiple choice test)
 AKTiVe study participants only: 92% correct answers
 Level 3 Behavior: Results for new followers (Those with their leader for less than a year)
 Means increased on all leader variables
 Significant for A, K, T, but not V
 Significant for total behavior score
 9 out of 12 behaviors significantly increased pretest to 4-month posttest
AKTiVe Training Program: The Results
16
 Asked how you are doing.
 Given you honest feedback.
 Explained why a decision was made.
 Asked team members for input.
 Been consistent in what they said and did.
 Kept our team informed about things.
 Admitted making a mistake.
 Kept a promise.
 Asked me if I needed help with something.
 Level 4 Results: Results for new followers.
 Trust in leader increased significantly.
AKTiVe Training Program: The Results
Leader Index (6 items)
 The person I report to treats me with respect.
 I respect the abilities of the person to whom I report.
 The person I report to encourages teamwork.
 The person I report to cares about my job satisfaction.
 The person I report to is a good communicator.
 I am involved in decisions that affect my work.
49% 27% 15% 6% 2%
High 158 Groups
Moderately High 88 Groups
Moderate 49 Groups
Moderately Low 19 Groups
Low 7 Groups
75 to 84 Average Leader Index
From Moderate to Moderately High
17
Other Interesting Outcomes
From My Program
Doctorate in Business Administration
“Management and Social Science”
19
Discussion

TGH USF AKTIVE Leadership Presentation

  • 1.
    The AKTiVe Model John Couris,President & CEO Florida Health Sciences Center, Inc. | Tampa General Hospital
  • 2.
    Agenda  My Why The Journey  Dissertation Work and Process  Continued Research  Other Interesting Outcomes  Discussion 2
  • 3.
    Importance of beinga lifelong learner Put the science into management (What’s the science behind running a business? A scholar practitioner’s perspective) Continuing Education: My “Why” 3
  • 4.
     “The GenuineArticle: Testing Authentic Leadership Theory with a Five Wave Intervention Study”  “Mixing It Up: Integrating Qualitative and Quantitative Follower Impressions of Their Leaders” My Progression and Experience In The Program: The Journey  Fall 2018: Acceptance into the D.B.A Program  Sept. 2020 – Dec. 2020: Drafted dissertation proposal (accepted)  Jan. 2021 – Dec. 2021: Conducted research and defended dissertation  Dec. 2021: Graduated USF with D.B.A in Management Sciences  May 2022: Launched full AKTiVE Leadership Training within Tampa General  May 2023: Submission of (2) additional papers to Financial Times Top 50 (FT50) journals (Journal of Management | Human Relations) 4
  • 5.
  • 6.
    From Anecdotes toScience: My Dissertation Journey “Driving Results with Authenticity, Kindness, and Vulnerability: A New Model of Authentic Leadership”
  • 7.
    Vulnerability Authenticity Transparency Kindness My Dissertation: TheAKTiVe Model 7 Trust Engagement Psychological Safety Sustainable Operational, Strategic and Clinical Impact
  • 8.
    Overview Research Question How are organizational resultsimpacted by Authentic Leadership, Kindness, and Vulnerability? Methodology Experimental Design Quantitative Survey (Press Ganey) Expected Outcomes Increase in direct reports’ • Psychological Safety • Trust • Work Engagement 8
  • 9.
     Hypothesis 1:Direct reports of managers who attend the authentic leadership training will report increased levels of authentic leadership from before to after training, whereas direct reports of managers who did not attend the training will show no differences.  Hypothesis 2: Direct reports of managers who attend the authentic leadership training will report increased levels of psychological safety from before to after training, whereas direct reports of managers who did not attend the training will show no differences.  Hypothesis 3: Direct reports of managers who attend the authentic leadership training will report increased levels of trust in their leader from before to after training, whereas direct reports of managers who did not attend the training will show no differences.  Hypothesis 4: Direct reports of managers who attend the authentic leadership training will report increased levels of work engagement from before to after training, whereas direct reports of managers who did not attend the training will show no differences. My Dissertation: The Hypothesis 9
  • 10.
     Kirkpatrick Model:The gold standard tool for measuring the effectiveness of training within an organization.  Study Type: Intervention  Random assignment to AKTiVe training vs. control group  Pretest-posttest design  Random sample of 44 TGH leaders (23 in the intervention and 21 in control group) My Dissertation: The Hypothesis 10
  • 11.
    My Dissertation: TheHypothesis (Kirkpatrick Model)  Level 1 Reactions: Very positive (mean 4.53 out of 5.0)  Level 2 Knowledge: Mean test score = 96% (ten item multiple choice quiz after the training)  Level 3 Behavior: Nonsignificant trend for intervention group to increase and control group to decrease (trend in the right direction, but not statistically significant p-value was greater than .05)  Level 4 Results: Nonsignificant trend for intervention group to increase and control group to decrease on psychological safety, trust, and engagement 11
  • 12.
    12 Summary of Findings Reactions were positive to the training content, facilitators, and in-person delivery  The learning for the managers was high - both by their self-reports’ appraisal and their performance on a post-training test  Hypotheses were not supported, but for all outcomes, the data is trending in the hypothesized direction
  • 13.
  • 14.
    AKTiVe Research Group 14 JohnCouris, DBA Eric Eisenberg, PhD Joann Quinn, PhD David Howard, PhD Paul Spector, PhD
  • 15.
     Study Type:Intervention  Random assignment to AKTiVe training vs. control group  40 TGH leaders in 2 cohorts:  Cohort 1 on May 3, 2022  Cohort 2 on June 29, 2022  Pretest-posttest design with 3 posttests over 6 months after training. AKTiVe Training Program: The Method 15
  • 16.
     Level 1Reactions: Extremely positive (4.9/5.0)  Level 2 Knowledge: (10 question multiple choice test)  AKTiVe study participants only: 92% correct answers  Level 3 Behavior: Results for new followers (Those with their leader for less than a year)  Means increased on all leader variables  Significant for A, K, T, but not V  Significant for total behavior score  9 out of 12 behaviors significantly increased pretest to 4-month posttest AKTiVe Training Program: The Results 16  Asked how you are doing.  Given you honest feedback.  Explained why a decision was made.  Asked team members for input.  Been consistent in what they said and did.  Kept our team informed about things.  Admitted making a mistake.  Kept a promise.  Asked me if I needed help with something.  Level 4 Results: Results for new followers.  Trust in leader increased significantly.
  • 17.
    AKTiVe Training Program:The Results Leader Index (6 items)  The person I report to treats me with respect.  I respect the abilities of the person to whom I report.  The person I report to encourages teamwork.  The person I report to cares about my job satisfaction.  The person I report to is a good communicator.  I am involved in decisions that affect my work. 49% 27% 15% 6% 2% High 158 Groups Moderately High 88 Groups Moderate 49 Groups Moderately Low 19 Groups Low 7 Groups 75 to 84 Average Leader Index From Moderate to Moderately High 17
  • 18.
  • 19.
    Doctorate in BusinessAdministration “Management and Social Science” 19
  • 20.

Editor's Notes

  • #18 40 Leaders were randomly selected to go through training, pairing them with accountability partners in the high group (group 1) In the case of the 40 leaders who went through the training, pre-AKTiVe they had an average Leader Index of 75 (Moderate), and after they went through the active training, they had a Leader Index of 84 (Moderately High). This is a huge jump.