Downloaded 659 times
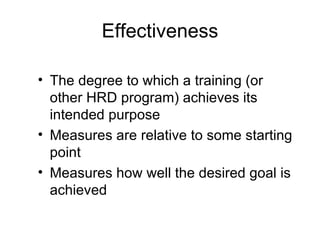
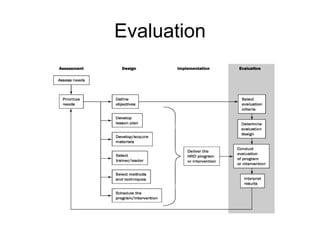


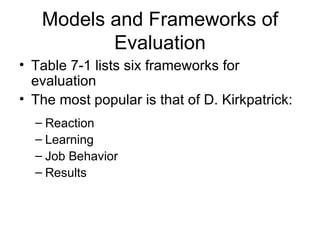
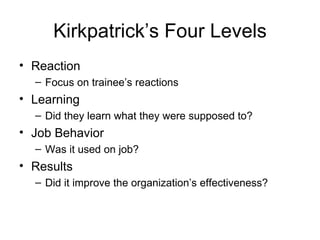
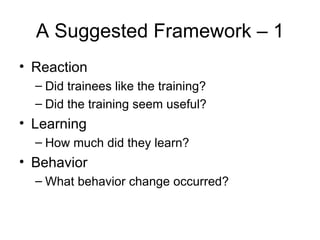
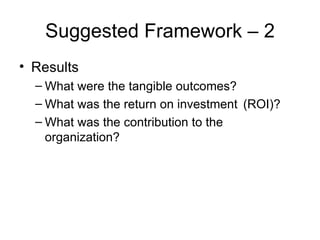
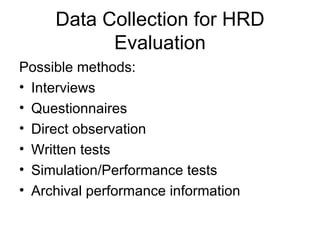
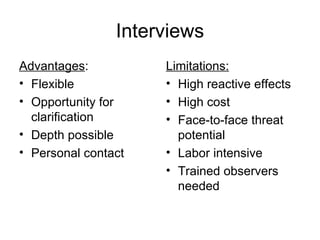
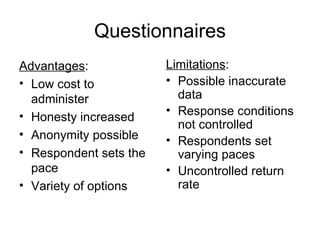
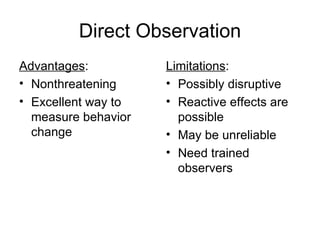
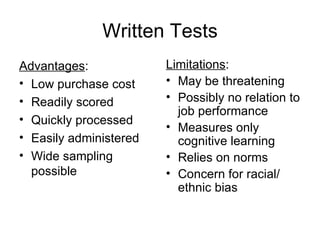
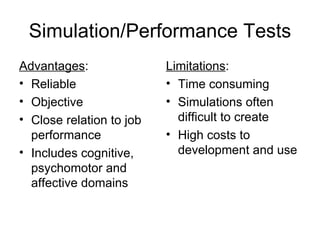
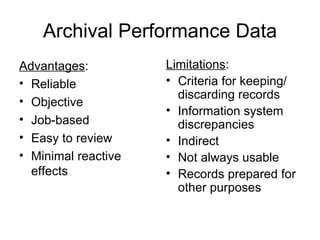
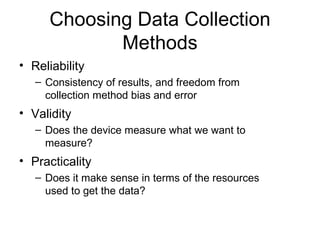
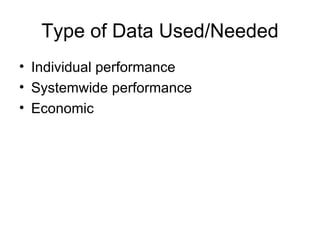
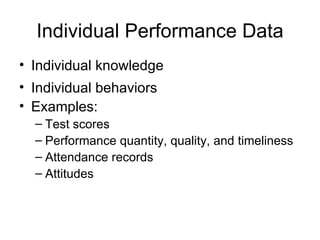


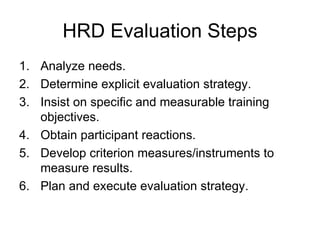
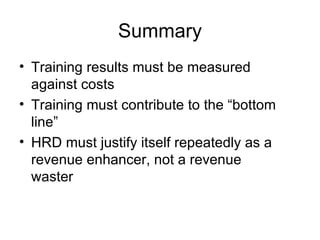

The document discusses evaluating the effectiveness of human resource development (HRD) programs. It describes common purposes of evaluation such as determining if a program is meeting objectives and identifying strengths and weaknesses. Kirkpatrick's four-level model of evaluation involving reaction, learning, behavior, and results is discussed. Data collection methods that can be used for evaluation like interviews, questionnaires, and observations are also outlined.