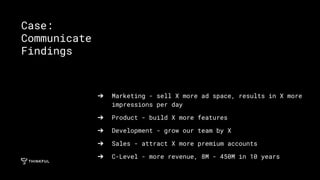
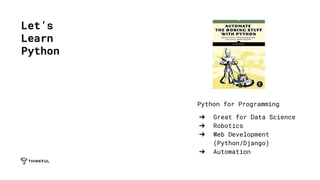
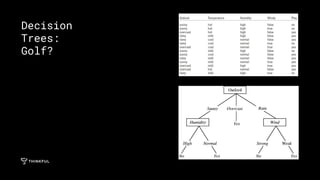
This document provides an introduction to building a predictive model in Python. It discusses Thinkful's approach to learning data science through mentorship and projects. The document then uses an example from LinkedIn's early history to illustrate the process a data scientist goes through: framing a question, collecting and processing data, exploring the data for patterns, and communicating findings. It demonstrates these steps through a predictive model built using a decision tree in Python. The document promotes Thinkful's free trial for learning data science with Python, statistics, mentorship and a student community.


![“[LinkedIn] was like arriving at a conference
reception and realizing you don’t know anyone. So
you just stand in the corner sipping your drink —
and you probably leave early.”
— LinkedIn Manager, June 2006
Example:
LinkedIn
2006](https://image.slidesharecdn.com/tf-itpbapm-180808012823/85/Tf-itpbapm-6-320.jpg)


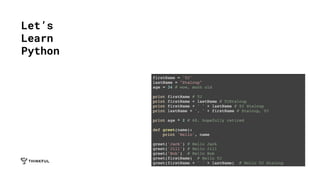
![X = [[181,80], [177,70], [160,60], [154,54], [166,65],
[190,90], [175,64], [177,70], [159,55], [171,75], [181,85]]
Y = ['male','female','female','female','male','male','male','female',
'male','female','male']
➔ Load in our seed data
➔ X is an array of inputs, each input is itself
an array that contains Height (in cm) and
Weight (in kg)
➔ Y is an array of strings that map to the
inputs in X so we can train the model
Code
Block 2](https://image.slidesharecdn.com/tf-itpbapm-180808012823/85/Tf-itpbapm-26-320.jpg)
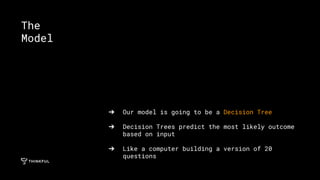
![prediction = clf.predict([[183,76]])
print prediction
➔ Now we give our inputs, in the same format
➔ Height (cm), Weight (kg)
➔ Print our prediction
Code
Block 4](https://image.slidesharecdn.com/tf-itpbapm-180808012823/85/Tf-itpbapm-28-320.jpg)