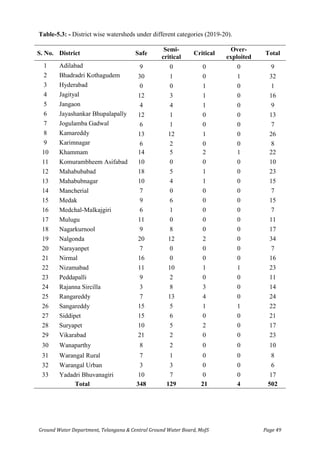
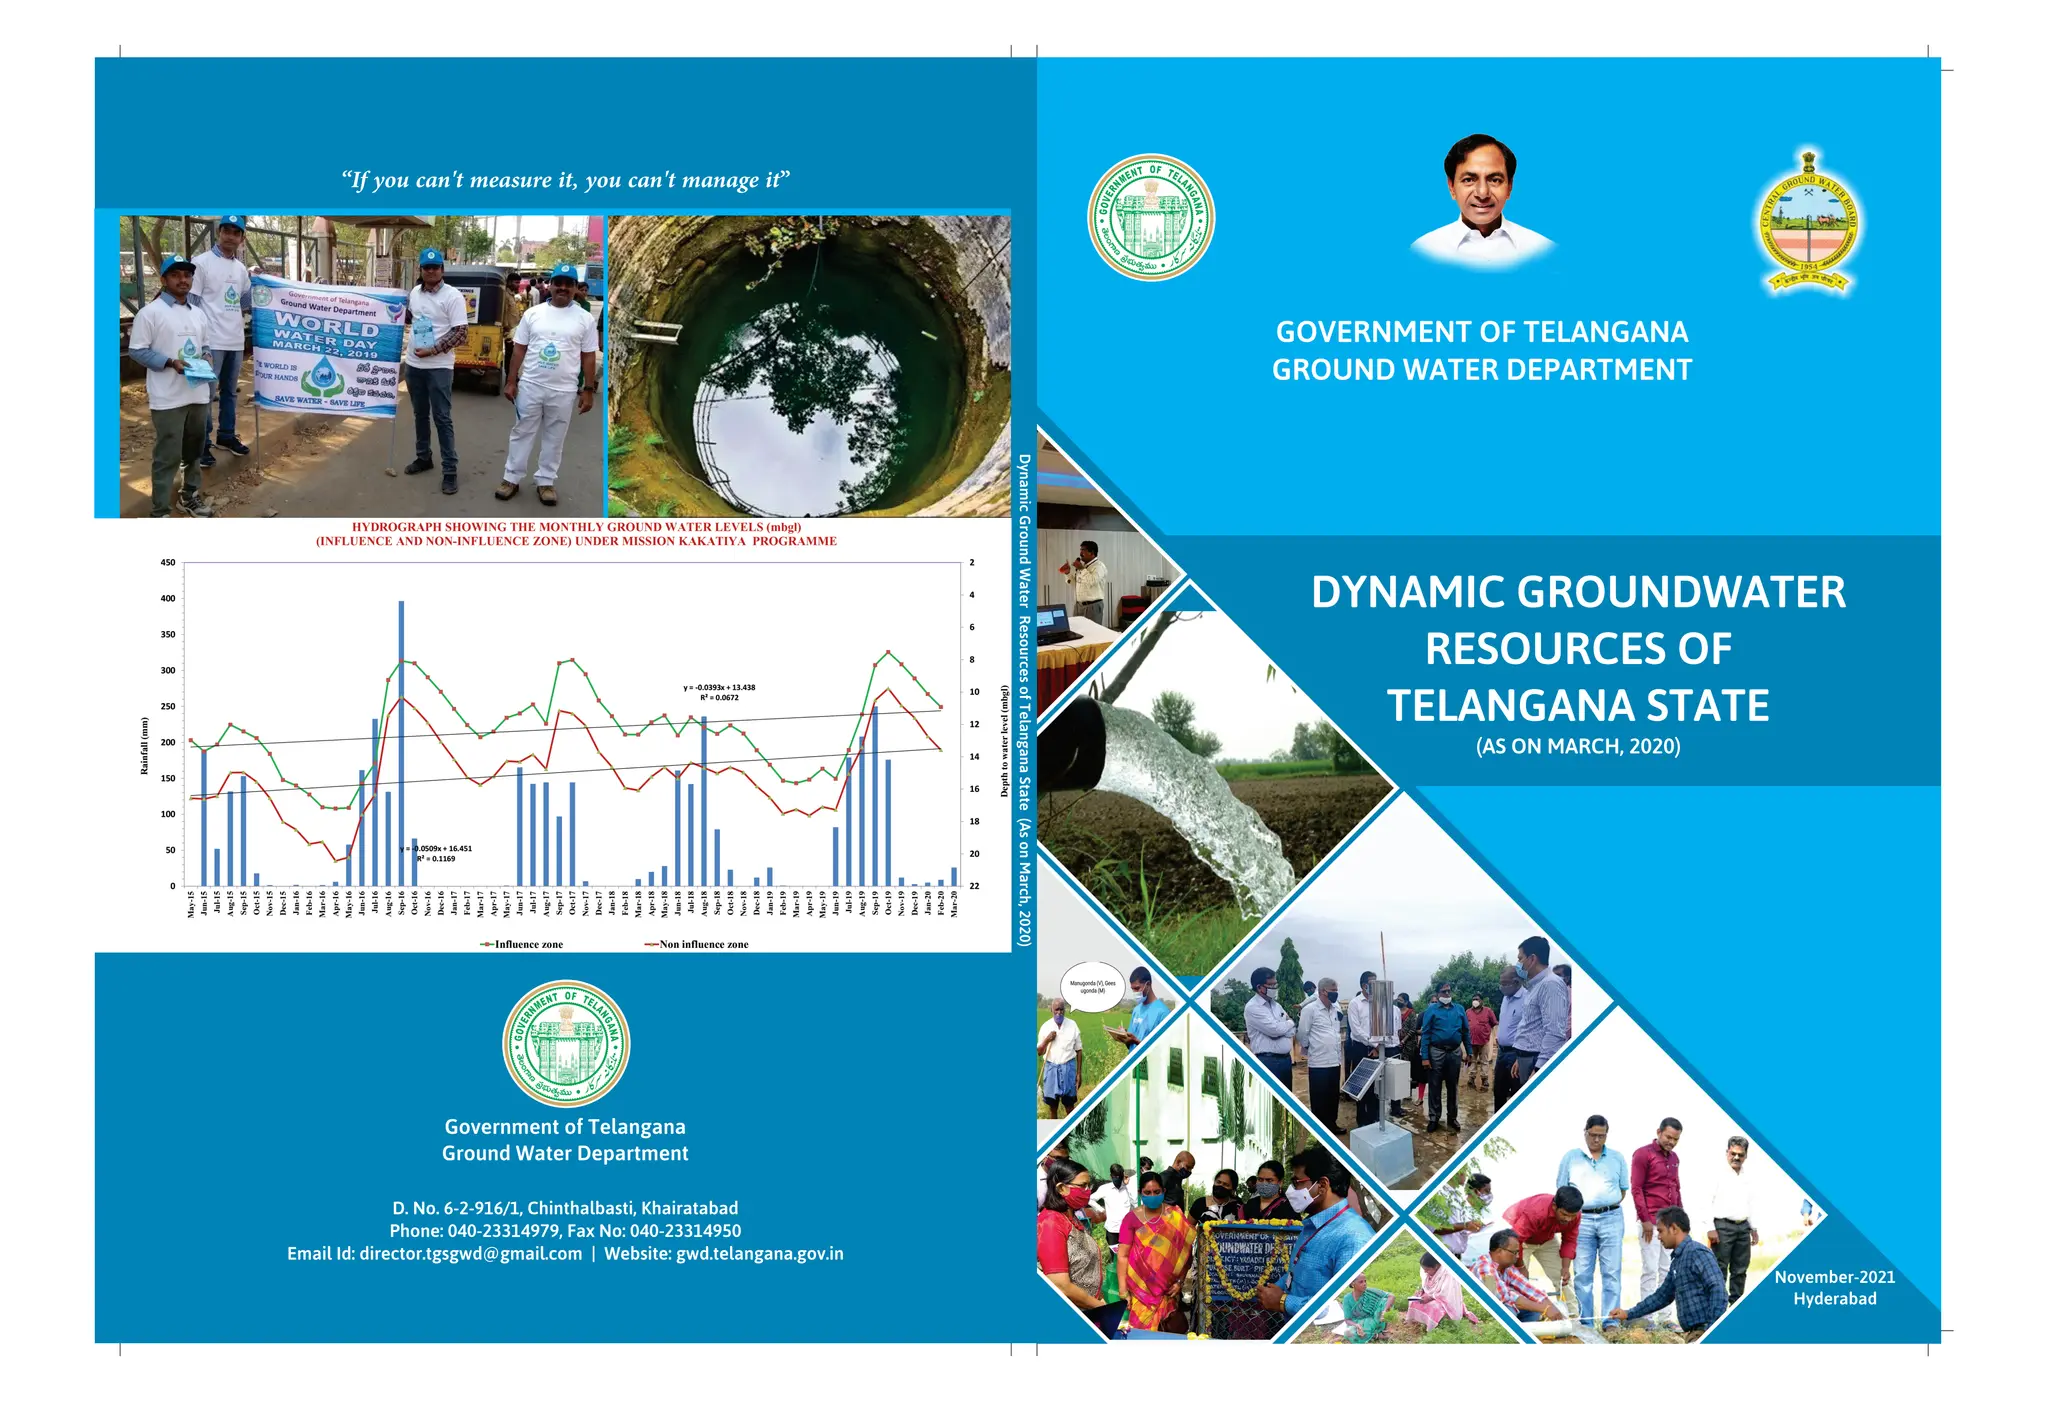
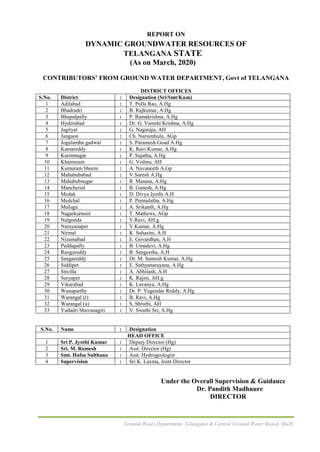
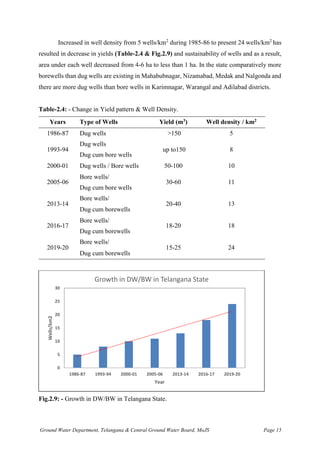
The document assesses the dynamic groundwater resources of Telangana as of March 2020, highlighting the importance of periodic evaluation in sustainable development. With approximately 60% of the population dependent on agriculture, the state has observed an increase in groundwater availability and a reduction in extraction levels due to various government initiatives. The report outlines comprehensive findings, including geographical conditions, groundwater methodologies, and a detailed analysis of the resources across all districts.


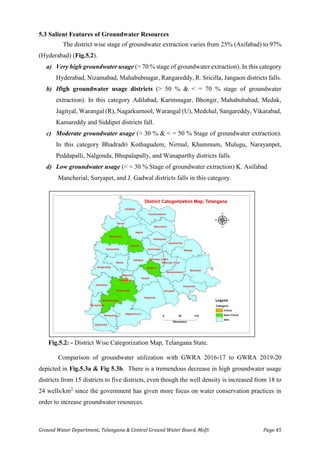
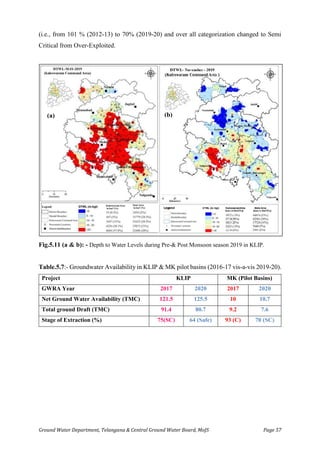
![Ground Water Department, Telangana & Central Ground Water Board, MoJS Page 44
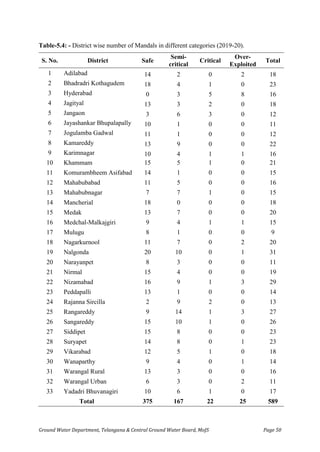
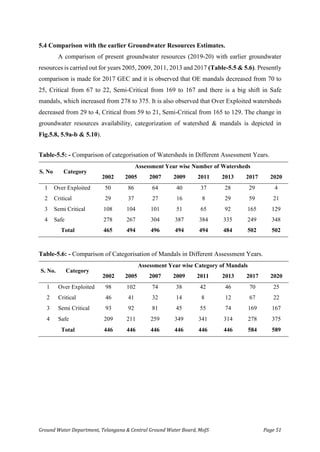
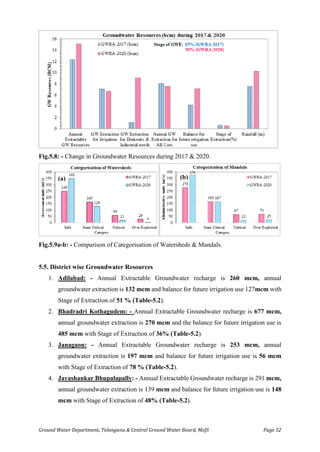
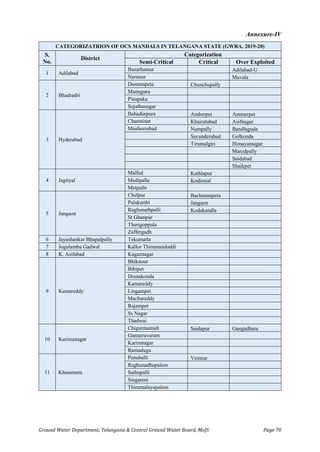
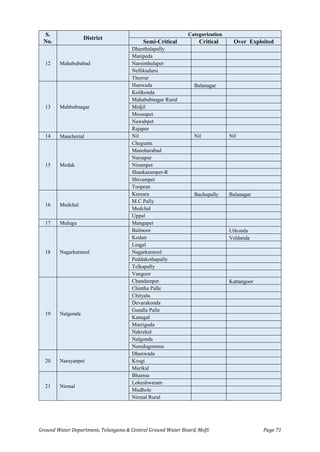
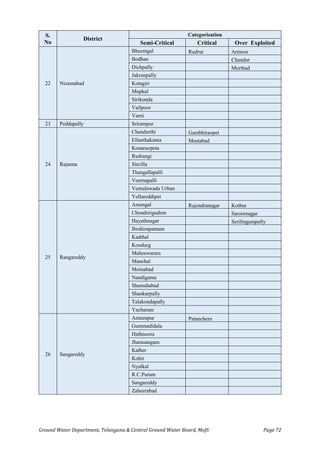
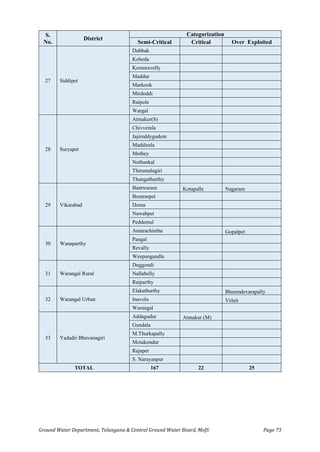
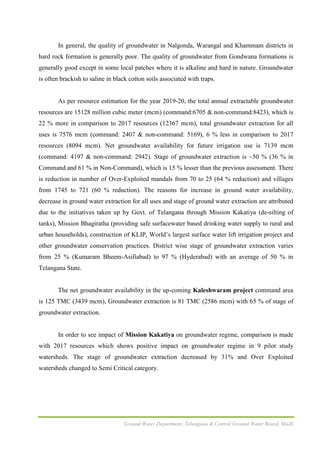
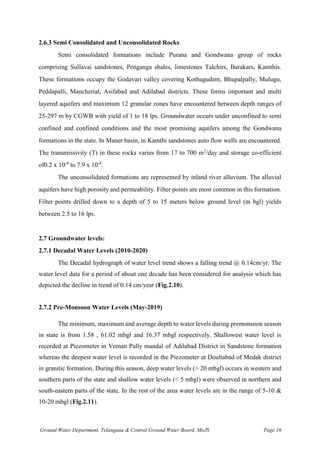
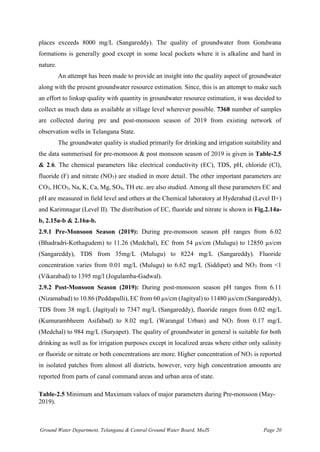
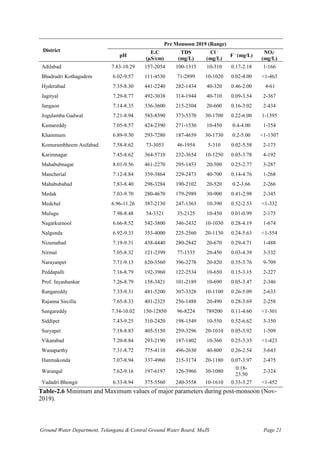
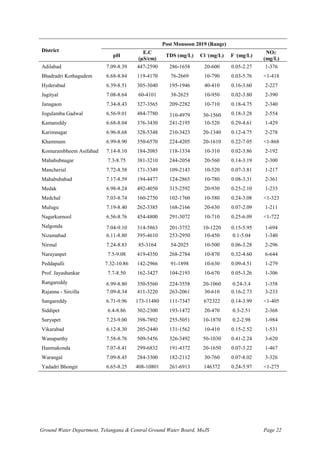
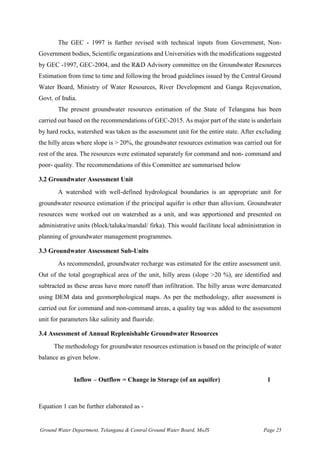
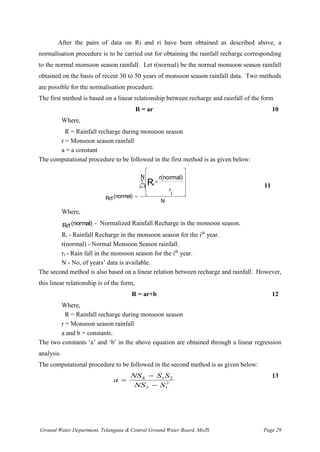
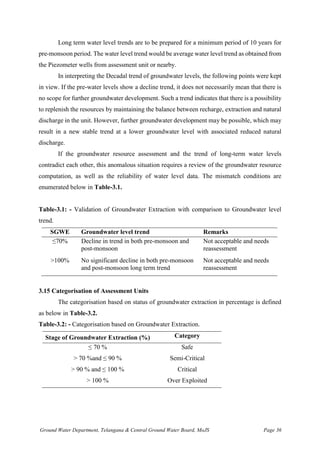
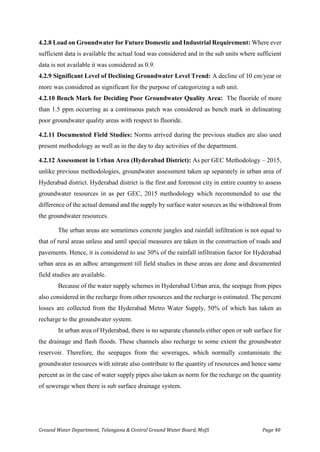
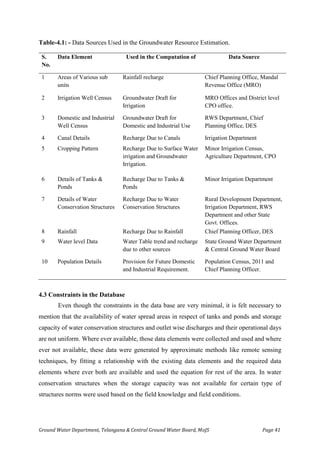
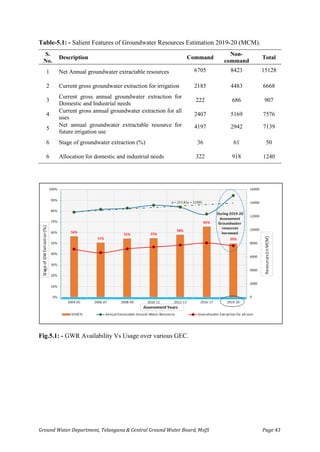
Table-5.2: - District wise Groundwater resources, 2019-20.
S.No. District
Annual Replenishable GW Resources (hm)
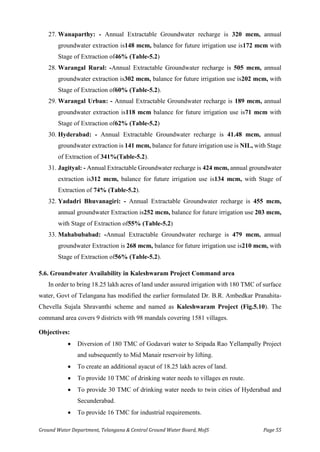
Total
annual
GW
recharge
[3+4+5+6]
(hm)
Provision
for natural
discharge
(hm)
Annual
Extractable
GW
Resources
(hm)
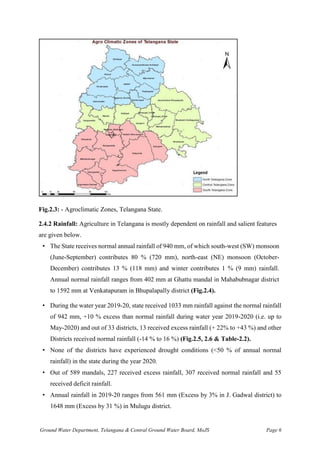
Annual Groundwater Extraction (hm)
Provision for
domestic and
industrial
requirement
supply to
2025 (hm)
Net GW
availability for
future
irrigation
development
(hm)
Stage of
GW
Extraction
(%)
Category
Monsoon Non-Monsoon
GW
Extraction
for
Irrigation
GW
Extraction
for
Domestic &
Industrial
Needs
Total
Annual
Extraction
for All
Uses
Recharge
from
rainfall
Recharge
from
other
sources
Recharge
from
rainfall
Recharge
from
other
sources
1 2 3 4 5 6 7 8 9 10 11 12 13 14 15 16
1 K. Asifabad 31382 728 0 1236 33344 3334 30009 5551 2065 7616 2267 22191 25 Safe
2 Mancherial 37957 18619 0 14770 71345 3621 67724 16033 1651 17684 3568 48123 26 Safe
3 Suryapet 20483 52711 1369 52665 127228 6362 120865 30392 2578 32970 4093 86380 27 Safe
4 Jogulamba Gadwal 9334 18404 2684 9087 39509 2654 36855 9900 523 10424 1293 25662 28 Safe
5 B. Kothagudem 59054 9344 6114 8803 83315 7591 75724 18581 8464 27045 8608 48535 36 Safe
6 Mulugu 26842 6168 0 8348 41359 2068 39291 14797 243 15040 942 23552 38 Safe
7 Khammam 30076 34599 6058 43175 113907 10256 103651 37352 3887 41240 5363 60937 40 Safe
8 Nirmal 28982 8286 0 12840 50109 1616 48493 18079 1941 20020 2595 27819 41 Safe
9 Peddapally 16865 4648 0 26347 47860 2392 45468 17797 1676 19473 2855 24816 43 Safe
10 Narayanpet 10577 8990 2122 8577 30267 1513 28753 11937 398 12335 2602 14215 43 Safe
11 Wanaparthy 10768 4919 11005 8497 35189 3186 32002 13536 1264 14801 1945 16521 46 Safe
12 Nalgonda 32930 35010 8426 45303 121669 6519 115157 45032 8546 53577 9199 60926 47 Safe
13 J. Bhupalapally 19802 4865 161 6998 31825 2721 29106 12622 1257 13879 1691 14793 48 Safe
14 Adilabad 23403 1528 0 2891 27822 1863 25960 8118 5112 13230 5184 12659 51 Safe
15 Karimnagar 16341 6888 1620 30519 55369 4912 50457 24350 2054 26404 4246 21861 52 Safe
16 Yadadri 20146 10248 4460 13212 48065 2528 45541 22187 3044 25231 4398 18955 55 Safe
17 Mahabubabad 25803 7719 3007 14115 50644 2561 47863 23934 2908 26842 3922 20008 56 Safe
18 Medak 19982 9286 1931 11434 42633 4107 38524 21745 1011 22756 2797 13981 59 Safe
19 Warangal Rural 15658 11825 761 26446 54691 4229 50462 28574 1641 30215 2085 19998 60 Safe
20 Jagityal 19506 10212 149 16892 46745 3936 42822 24735 1020 25755 3208 15012 60 Safe
21 Nagarkurnool 26298 4630 7027 8732 46687 2334 44353 21946 5261 27207 5327 17080 61 Safe
22 Medchal 6365 814 1352 1337 9869 493 9376 3302 2480 5782 1725 4350 62 Safe
23 Warangal Urban 10659 4239 80 4984 19962 998 18915 10602 1210 11812 5279 4412 62 Safe
24 Sangareddy 21302 3868 4375 4579 34123 1903 32226 17685 2605 20290 5120 9420 63 Safe
25 Vikarabad 21233 1974 2697 5338 31242 1562 29680 15897 2797 18695 3562 10220 63 Safe
26 Kamareddy 28256 6733 1411 12782 49192 3110 46080 27460 2027 29487 3842 14778 64 Safe
27 Siddipet 23672 10366 4345 16176 54559 2728 51836 32866 1113 33979 3584 15386 66 Safe
28 Nizamabad 39047 14397 321 23720 77485 3874 73611 49961 1583 51544 4311 19339 70 Safe
29 Mahabubnagar 13533 3977 2614 7249 27373 1369 26005 17757 979 18736 3422 4826 72 Semi Critical
30 Rangareddy 25477 3579 5908 5210 40174 2009 38165 21755 6501 28256 6651 9759 74 Semi Critical
31 Jangaon 15964 2486 2452 5683 26584 1330 25255 16974 2681 19655 2683 5598 78 Semi Critical
32 Rajanna Siricilla 14301 6673 2066 11451 34491 1729 32843 25385 705 26090 5653 1805 79 Semi Critical
33 Hyderabad 2473 323 3870 4169 10835 1049 9786 0 9525 9525 0 0 97 Critical
Grand Total 724470 329055 88387 473566 1615470 102457 1512859 666842 90749 757590 124019 713920 50 Safe](https://image.slidesharecdn.com/telanganastateresourcereport2020-240918145451-29f3929a/85/Telangana_State_Resource_Report_2020-pdf-64-320.jpg)