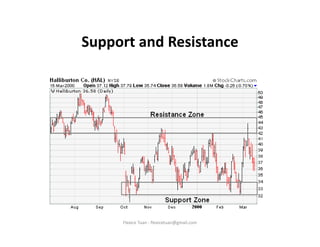
Technical analysis is the forecasting of future security prices based on past market data like price and volume. Key principles are that all information is reflected in prices, prices trend upward, downward, or sideways, and history tends to repeat. Charts like line, bar, and candlestick are used to identify trends, support and resistance levels, and common patterns like double tops/bottoms, head and shoulders, triangles, and channels. Technical analysis seeks to identify opportunities within these patterns and trends.