Download to read offline


![Notes
1 Carbon Dioxide Information Analysis Center, ‘Fossil-Fuel CO2
Emissions by Region’, http://cdiac.ornl.gov/trends/emis/
tre_regn.html
2 C. Le Quéré et al. ‘The Global Carbon Budget 1959–2011’
Earth System Science Data Discussions, 5, 1107–1157,
2 December 2012, doi:10.5194/ essdd-5-1107-2012,
http://bit.ly/UY8GTQ
3 M. Sandiford ‘Our effect on the earth is real: how we’re
geo-engineering the planet’, The Conversation, June 16,
2011, http://theconversation.com/our-effect-on-the-earth-is-
real-how-were-geo-engineering-the-planet-1544
4 S. Solomon et al. (eds.), Climate Change 2007: The Physical
Science Basis. Contribution of Working Group I to the Fourth
Assessment Report of the Intergovernmental Panel on
Climate Change, Cambridge University Press, Cambridge,
United Kingdom and New York, NY, USA, 2007.
5 Potsdam Institute for Climate Impact Research and
Climate Analytics, 4°: Turn Down the Heat, The World Bank,
Washington, DC, November 2012.
6 Le Quéré et al, Op Cit.
7 Le Quéré et al, Op Cit.
8 IEA, ‘Tracking Clean Energy Progress’, International
Energy Agency, 2012, http://www.iea.org/publications/
freepublications/publication/Tracking_Clean_Energy_
Progress.pdf
9 R. Monroe, ‘What Does 400 ppm Look Like?’ The Keeling
Curve, Scripps Institution of Oceanography, April 25, 2013,
http://keelingcurve.ucsd.edu/what-does-400-ppm-look-like/
10 CSIRO, ‘The Science of Climate Change, http://www.csiro.
au/en/Outcomes/Climate/Understanding/the-science-of-
climate-change/Greenhouse-gases-and-climate-change.aspx
11 CSIRO, Op Cit.
12 Potsdam Institute for Climate Impact Research and Climate
Analytics, Op Cit.
13 Potsdam Institute for Climate Impact Research and Climate
Analytics, Op Cit.
14 http://keelingcurve.ucsd.edu/special-note-on-may-9-2013-
reading/
15 Scipps institution of Oceanography, ‘Special note on the May
9, 2013 reading’, The Keeling Curve, May 10, 2013, http://
keelingcurve.ucsd.edu/special-note-on-may-9-2013-reading/
16 Scipps Institution of Oceanography, http://keelingcurve.ucsd.
edu (specific curve re 800,000 years http://bluemoon.ucsd.
edu/co2_400/co2_800k.png)
17 Scipps Institution of Oceanography, http://keelingcurve.ucsd.
edu (specific curve re 300 years http://bluemoon.ucsd.edu/
co2_400/co2_800k_zoom.png)
18 CSIRO and Bureau of Meteorology, State of the Climate
– 2012, April 26, 2012, http://www.csiro.au/Outcomes/
Climate/Understanding/State-of-the-Climate-2012.aspx
19 CSIRO and BOM, Op Cit.
20 National Snow and Ice Data Center, ‘Arctic sea ice reaches
lowest extent for the year and the satellite’ September
19, 2012, recordhttp://nsidc.org/news/press/2012_
seaiceminimum.html
21 National Snow and Ice Data Center, ‘Arctic Sea Ice Shatters
All Previous Record Lows’, October 1, 2007, http://
nsidc.org/news/press/2007_seaiceminimum/20071001_
pressrelease.html
22 P. J. Durack, et al. ‘Ocean Salinities Reveal Strong Global
Water Cycle Intensification During 1950 to 2000’, Science,
2012; 336 (6080): 455 DOI: 10.1126/science.1212222
23 C. Lucas et al., Bushfire Weather in Southeast Australia:
Recent Trends and Projected Climate Change Impacts,
Bushfire CRC, Australian Bureau of Meteorology, and CSIRO
Marine and Atmospheric Research, Consultancy Report
prepared for The Climate Institute, September 2007. http://
www.climateinstitute.org.au/articles/publications/briefing-
bushfire-weather-in-south-east-australia.html
24 Bureau of Meteorology, ‘Special Climate Statement 43 –
extreme heat in January 2013’,
Updated 1 February 2013,
http://www.bom.gov.au/climate/current/statements/scs43e.pdf
25 CSIRO and Bureau of Meteorology, Op Cit.
26 N. Plummer et al. ‘What’s causing Australia’s heat wave?’
The Conversation, http://theconversation.com/whats-
causing-australias-heat-wave-11628
27 State of Queensland, Increasing Queensland’s resilience
to inland flooding in a changing climate: Final Report of
the Inland Flooding Study, 2010, www.ehp.qld.gov.au/
climatechange/pdf/inland-flood-study.pdf
28 National Oceanic and Atmospheric Administration, ‘Arctic
Change’, http://www.arctic.noaa.gov/detect/ice-seaice.html
29 T. Schneider von Deimling et al. ‘How cold was the
Last Glacial Maximum?’, Geophys. Res. Lett., 33, L14709,
doi:10.1029/2006GL026484, 2006.
30 Schneider von Deimling et al, Op Cit.
31 Solomon et al., Op Cit.
32 Potsdam Institute for Climate Impact Research and
Climate Analytics, Op Cit.
33 K. E. Trenberth, ‘Framing the way to relate climate extremes
to climate change’, Climatic Change, 115(2), 283–290,
November 2012.
34 Potsdam Institute for Climate Impact Research and
Climate Analytics, Op Cit.
35 Department of Climate Change, Climate Change Risk to
Australia’s Coasts, Commonwealth of Australia, 2009,
http://www.climatechange.gov.au/sites/climatechange/files/
documents/03_2013/cc-risks-full-report.pdf
36 Lucas et al., Op Cit.
37 T. M. Lenton, et al., ‘Tipping Elements in the Earth’s
Climate System’, PNAS 105 (6): 1786–1793. 2008,
doi:10.1073/pnas.0705414105
38 R. Garnaut, The Garnaut Climate Change Review, May
2011, http://www.garnautreview.org.au/chp6.htm; S. M.
Howden, et al., ‘Australian agriculture in a climate of change’.
In: Managing climate change: papers from the Greenhouse
2009 conference, pp 101–111. CSIRO Publishing, 2010.;
Department of Climate Change and Energy Efficiency, Op Cit.
39 Potsdam Institute for Climate Impact Research and Climate
Analytics, Op Cit., p ix
40 Potsdam Institute for Climate Impact Research and Climate
Analytics, Op Cit.,
41 Department of Climate Change, Op Cit.
42 Potsdam Institute for Climate Impact Research and Climate
Analytics, Op Cit.
43 A. Robinson et al., ‘Multistability and critical thresholds of the
Greenland ice sheet’, Nature Climate Change, 2, 429–432,
March 2012 [doi:10.1038/NCLIMATE1449]](https://image.slidesharecdn.com/8d01e872-6e24-405f-a6b4-922808d8a407-150225224217-conversion-gate01/85/TCI_DangerousDegrees_print-28-320.jpg)


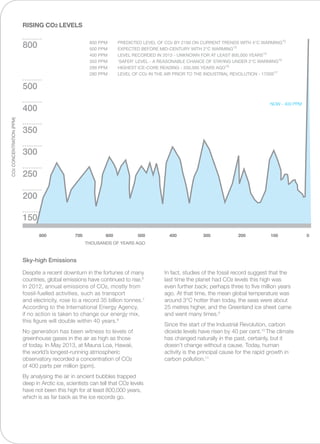
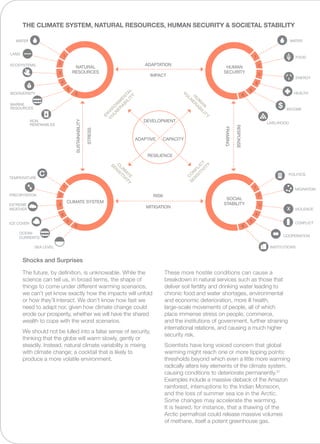
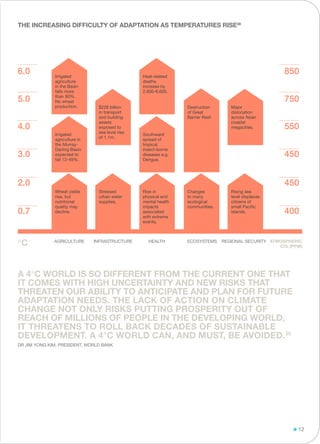
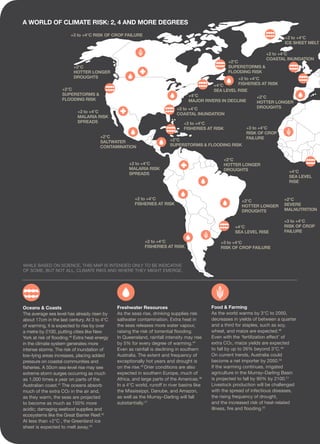
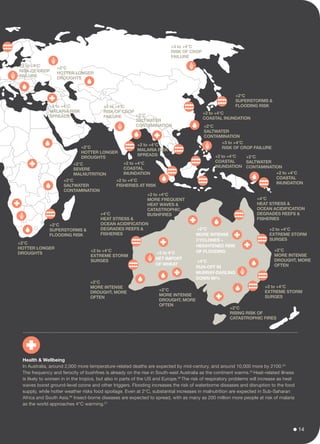
The document discusses the impacts of climate change caused by rising levels of greenhouse gases in the atmosphere. It notes that carbon dioxide levels are now higher than at any point in the last 800,000 years, and a rise in global temperatures of 4-6°C is projected by 2100 if emissions continue unchecked. Such warming would have severely detrimental effects on global agriculture, coastlines, health, and ecosystems. The precise risks and impacts are difficult to predict but would challenge human and environmental resilience.


