Download as PDF, PPTX


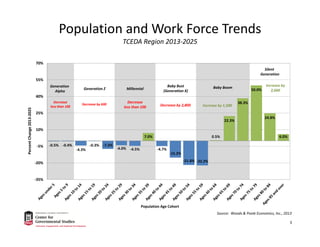
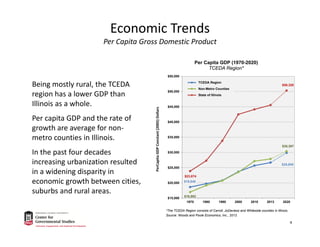
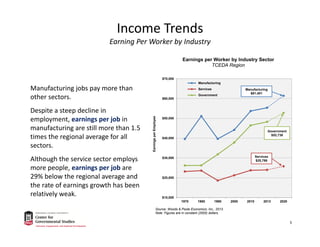
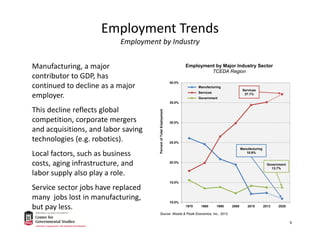
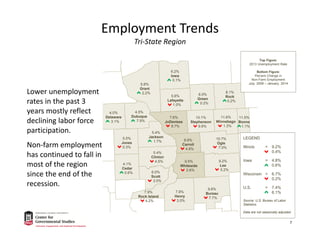
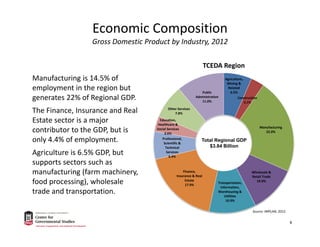
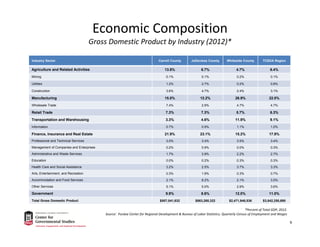
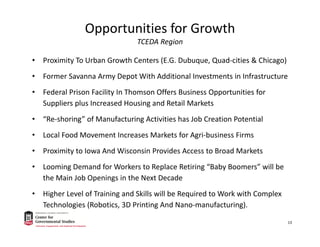


The document presents an analysis of economic trends and growth opportunities in the TCEDA region of northwest Illinois, highlighting population changes, GDP, employment sectors, and business startups. Key points include a decline in manufacturing jobs alongside the rise of lower-paying service sector roles, and potential growth opportunities in business startups and agricultural sectors. Recommendations emphasize promoting skilled job opportunities and addressing the needs of an aging population while leveraging regional assets for economic development.