The internship report examines the brand preference and image of Tata Teleservices, focusing on customer behavior and preferences in Ahmedabad. It includes a review of Tata's history, corporate values, services offered, and a detailed research methodology involving data collection from 50 respondents. Key findings reveal customer satisfaction levels, brand loyalty, and significant relationships between demographic factors and consumer usage of Tata Teleservices.
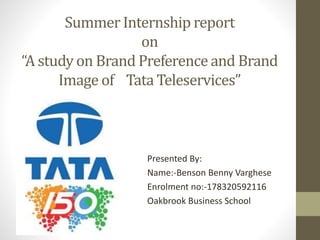


![ChisquaretestHypotheses
The chi-square statistic is 2.9753. D.F = 4 Tabulated value 9.488
Since calculated Value Of chi square-2.9753 its critical or Tabulated
Value 9.488 the null hypothesis is accepted.
Manufacturing Service Others Row Totals
YES 3 (2.99) [0.00] 13 (11.65) [0.16] 7 (8.36) [0.22] 23
NO 1 (1.04) [0.00] 2 (4.05) [1.04] 5 (2.91) [1.50] 8
Maybe 6 (5.97) [0.00] 24 (23.30) [0.02] 16 (16.73) [0.03] 46
Column
Totals 10 39 28
77 (Grand
Total)
H0: Brand Preference is independent of Business Vertical
H1: Brand Preference is independent of Business Vertical](https://image.slidesharecdn.com/bensonsipppt-190106123108/85/Tata-Teleservice-41-320.jpg)
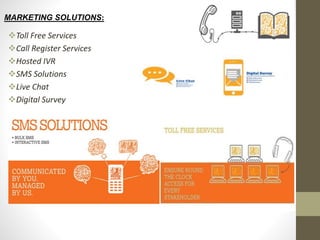
![ChisquaretestHypotheses
The chi-square statistic is 3.4084. D.F = 2 Tabulated value 5.991
• Since calculated Value Of chi square-3.4084 its critical or Tabulated Value
5.991 the null hypothesis is accepted .
H0: Brand Preference is independent of Gender
H1: Brand Preference is not independent of Gender
Gender Yes No Maybe Total
Male 21 (18.40) [0.37] 5 (5.60) [0.06] 14 (16.00) [0.25] 40
Female 2 (4.60) [1.47] 2 (1.40) [0.26] 6 (4.00) [1.00] 10
Total 23 7 20 50](https://image.slidesharecdn.com/bensonsipppt-190106123108/85/Tata-Teleservice-42-320.jpg)
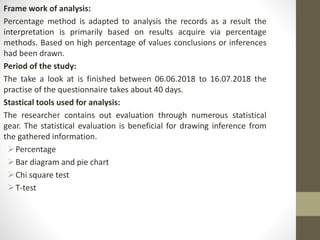
![ChisquaretestHypotheses
• The chi-square statistic is 1.94, D.F = 6 Tabulated value 12.59
• Since calculated Value Of chi square 1.94 its critical or Tabulated Value 12.59
the null hypothesis is accepted.
•
H0: Brand Preference is independent of age group
H1: Brand Preference is not independent of age group
Age Yes No Maybe total
18-25 11 (10.56)
[0.02]
3 (3.84) [0.18] 10 (9.60) [0.02]
24
26-35 3 (3.96) [0.23] 2 (1.44) [0.22] 4 (3.60) [0.04] 9
36-55 5 (4.40) [0.08] 1 (1.60) [0.23] 4 (4.00) [0.00] 10
above-55 3 (3.08) [0.00] 2 (1.12) [0.69] 2 (2.80) [0.23] 7
total 22 8 20 50](https://image.slidesharecdn.com/bensonsipppt-190106123108/85/Tata-Teleservice-43-320.jpg)


