Download as PDF, PPTX


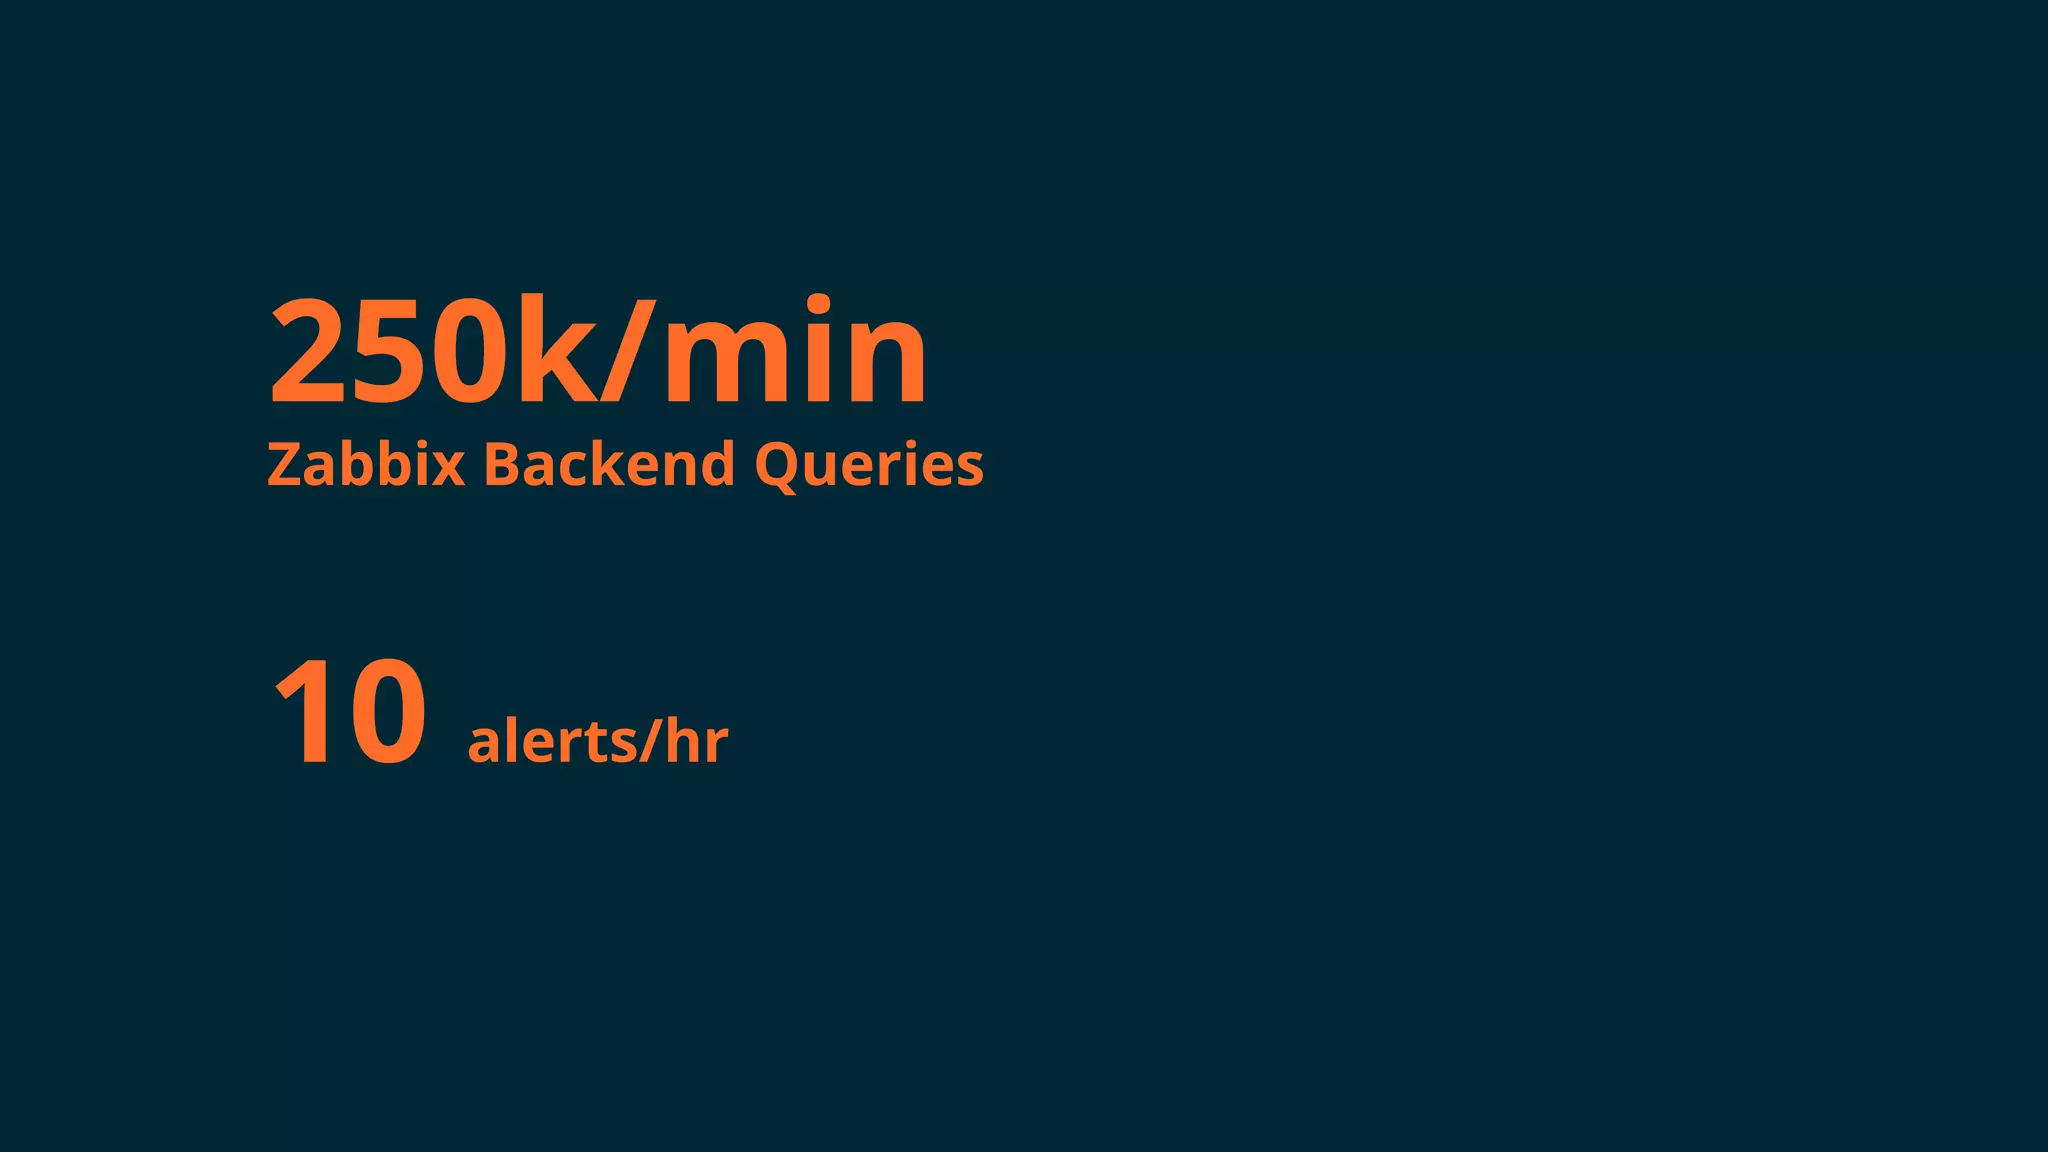


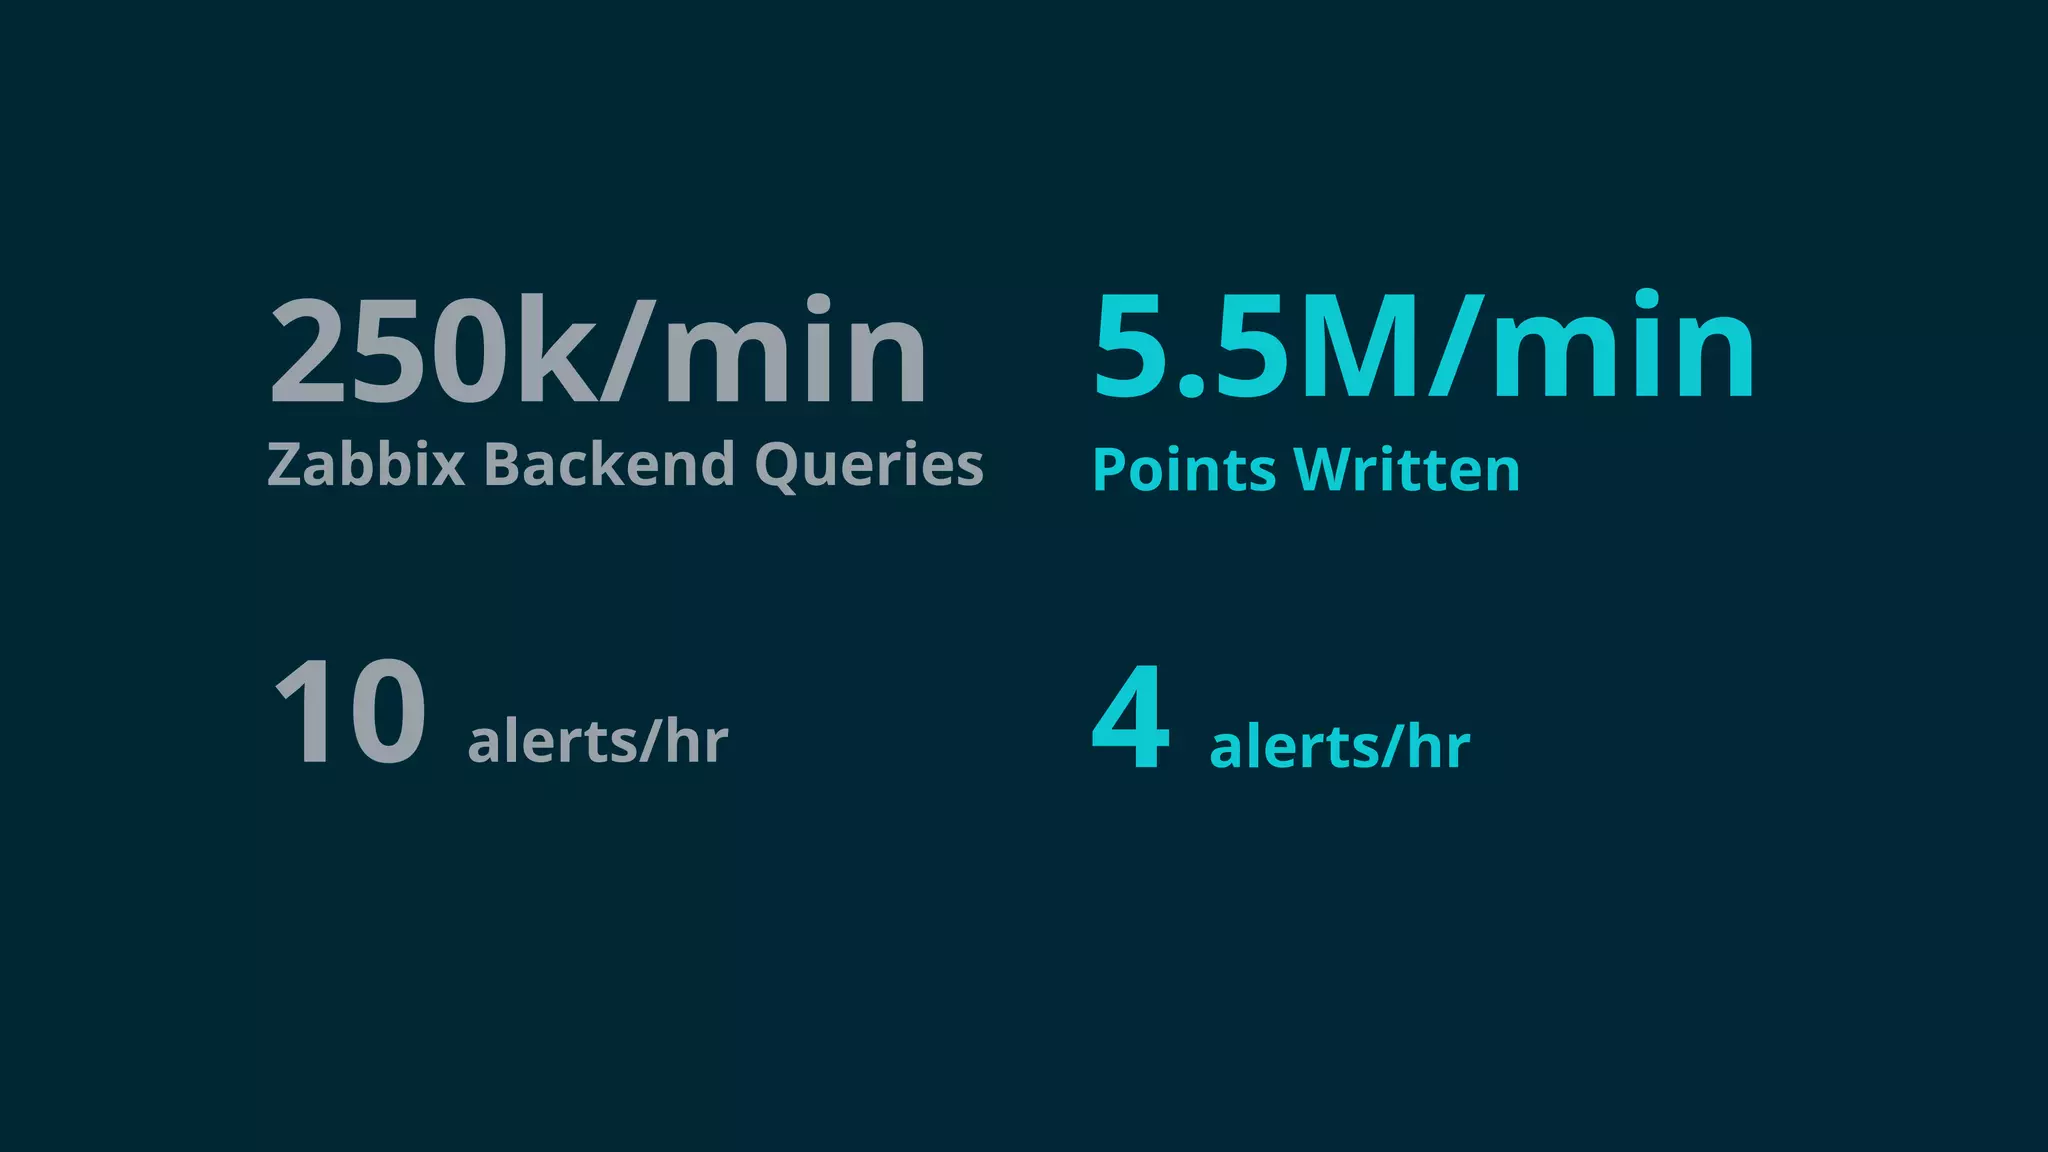


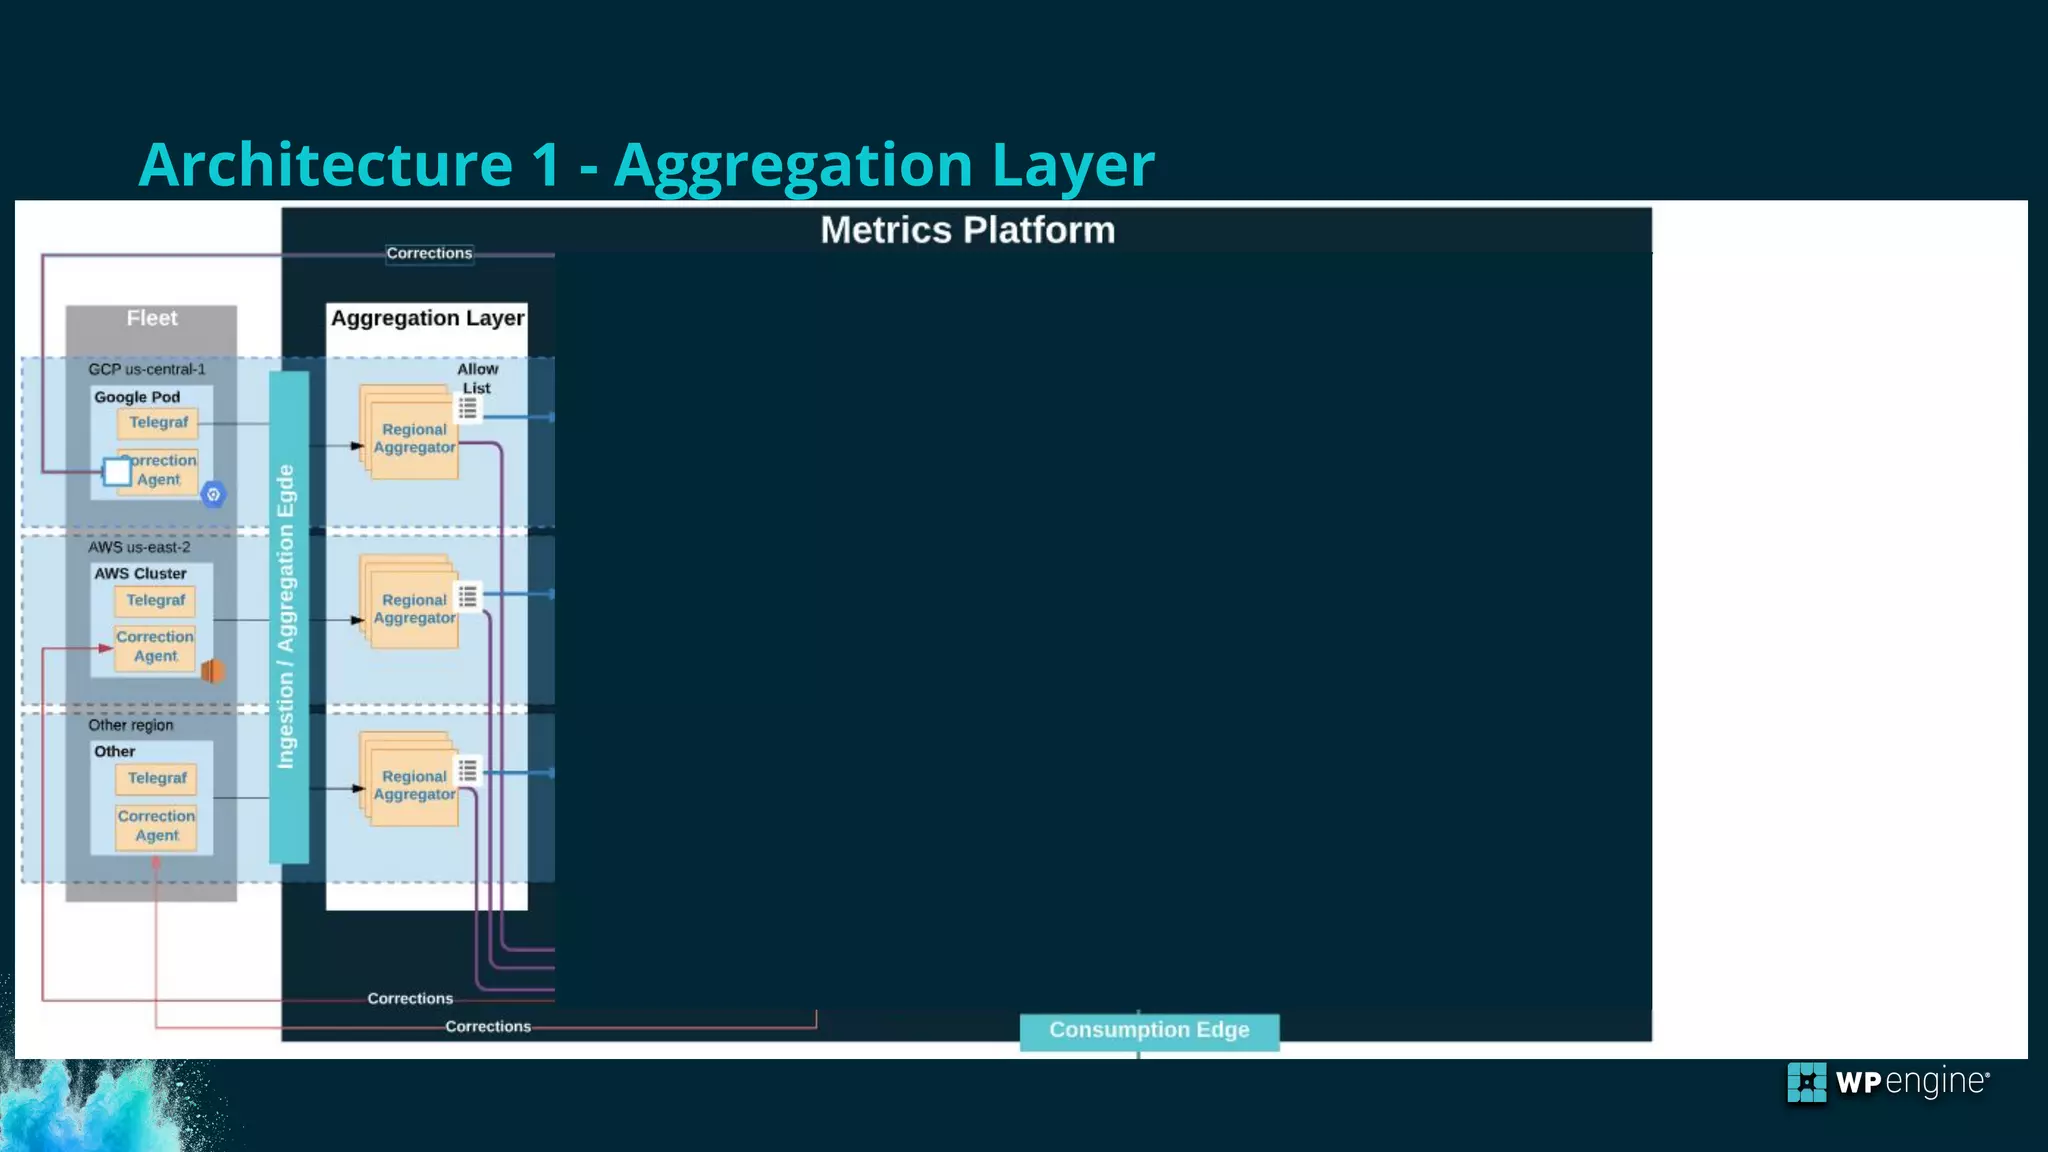
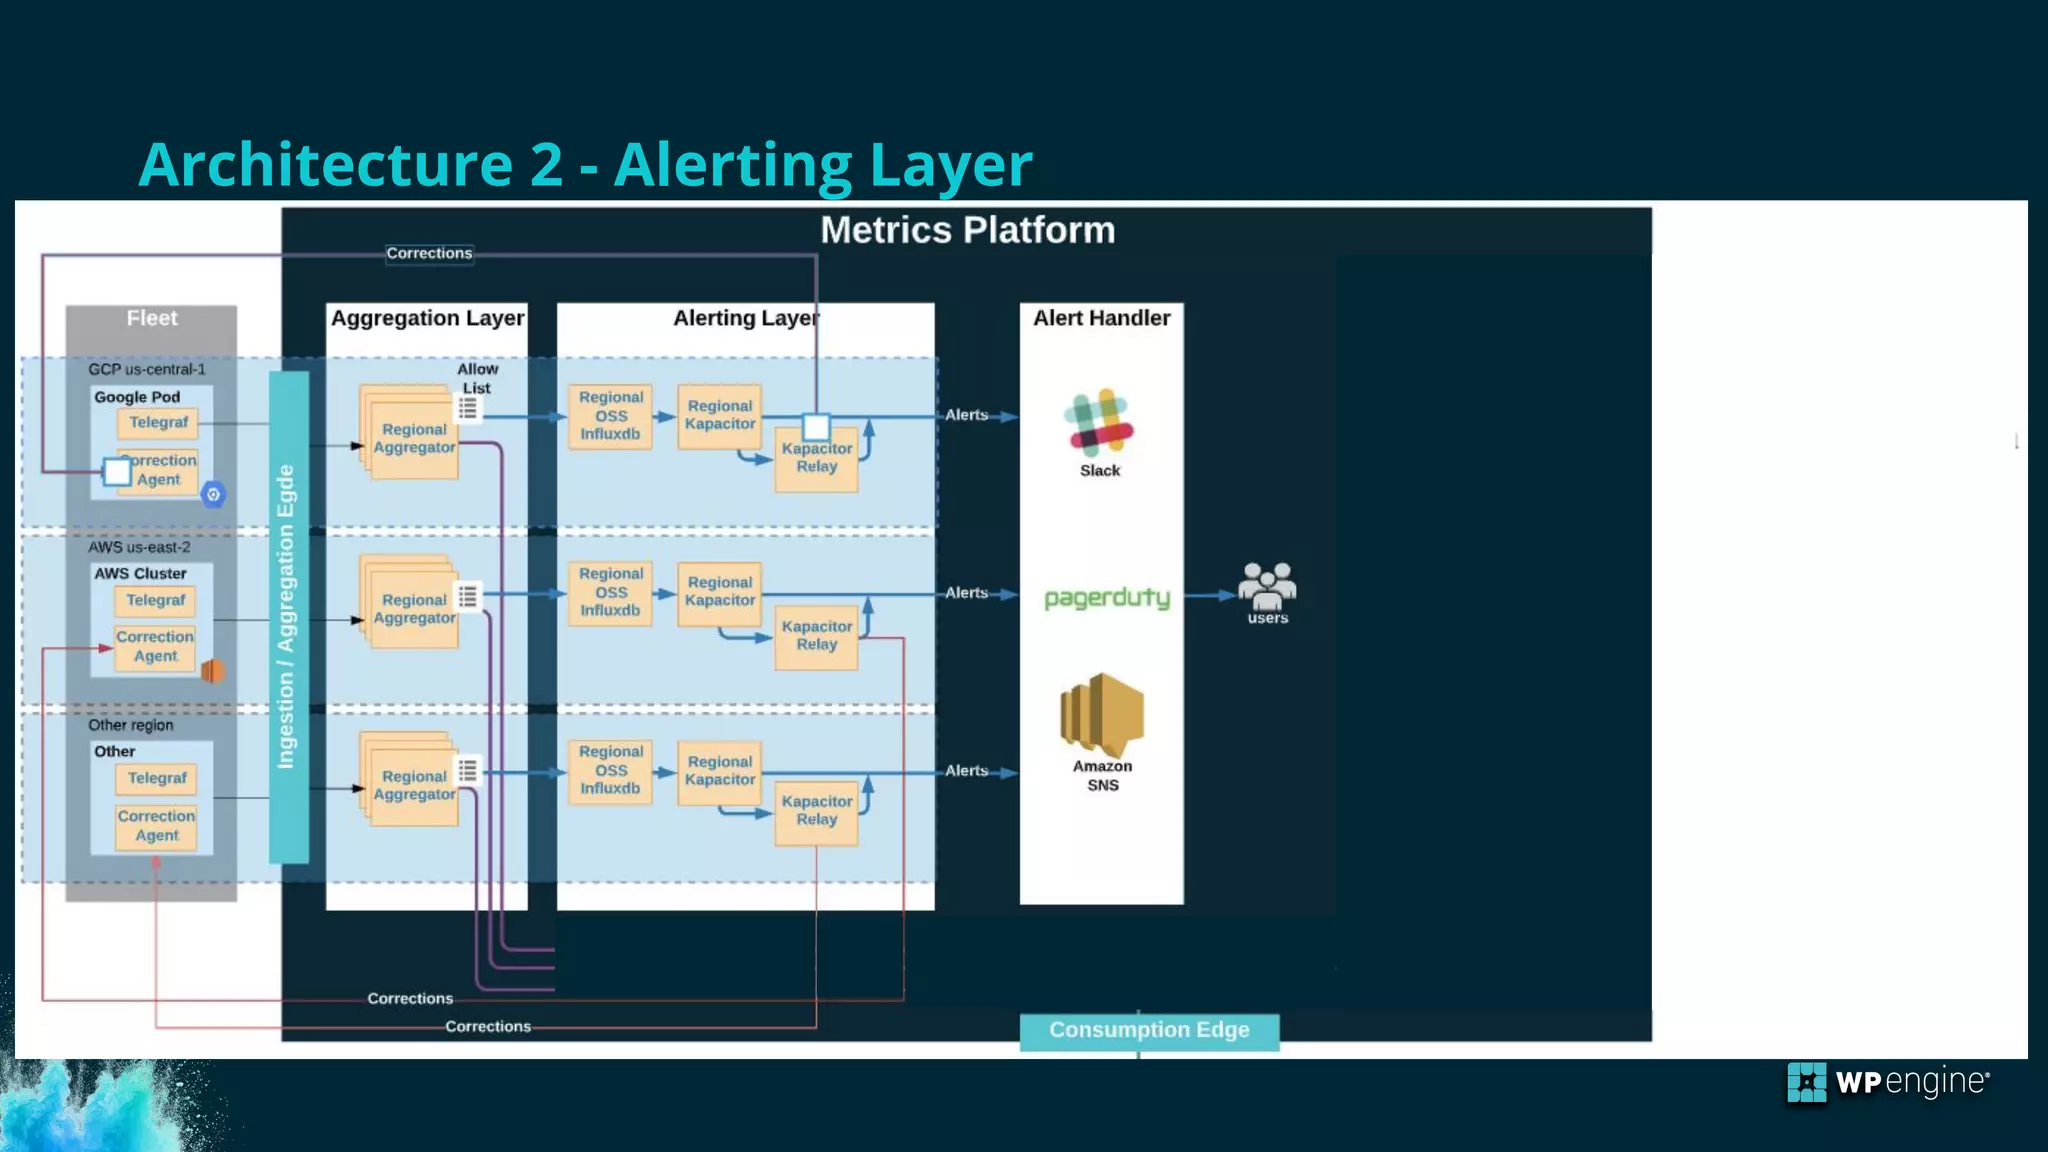
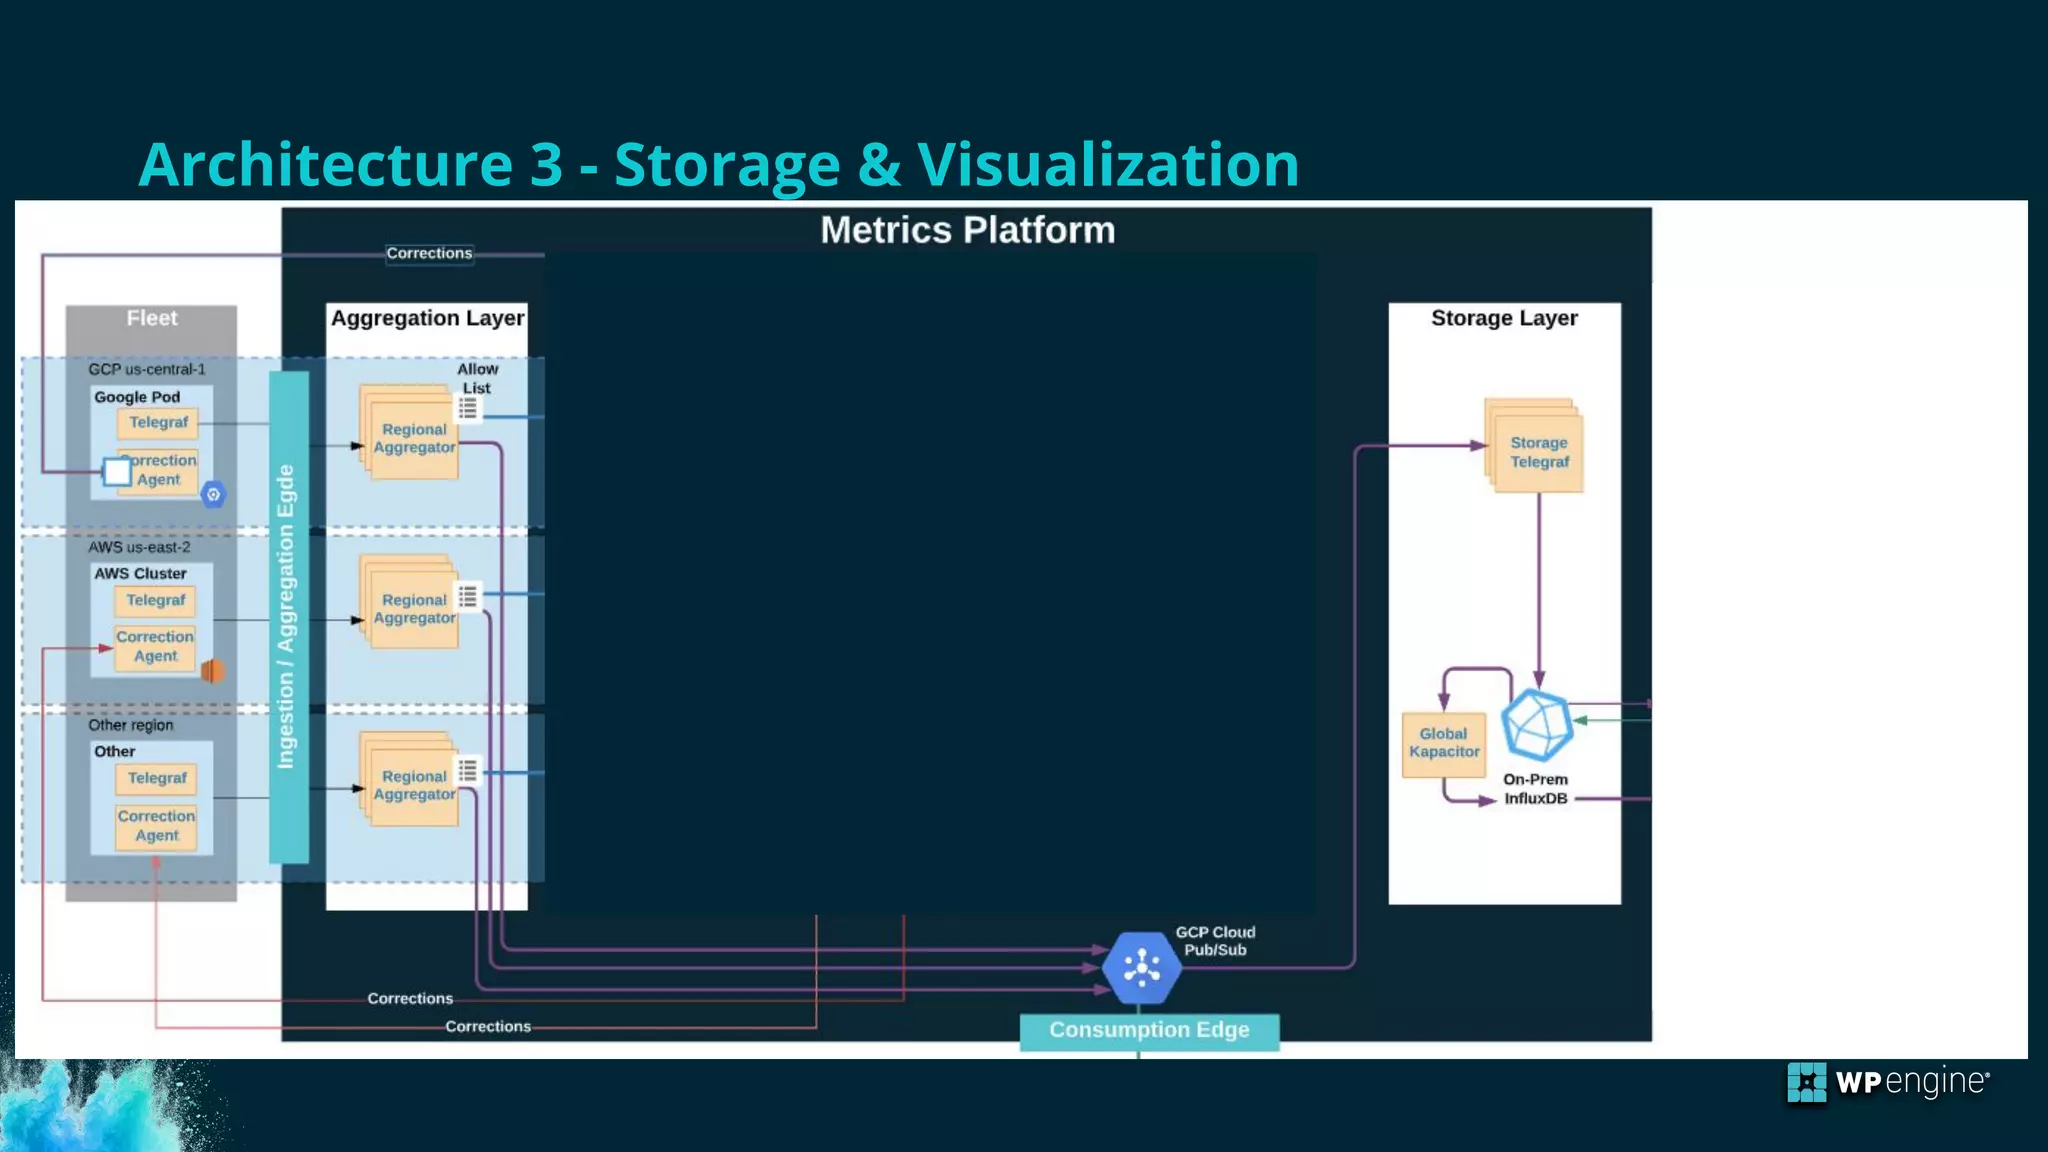

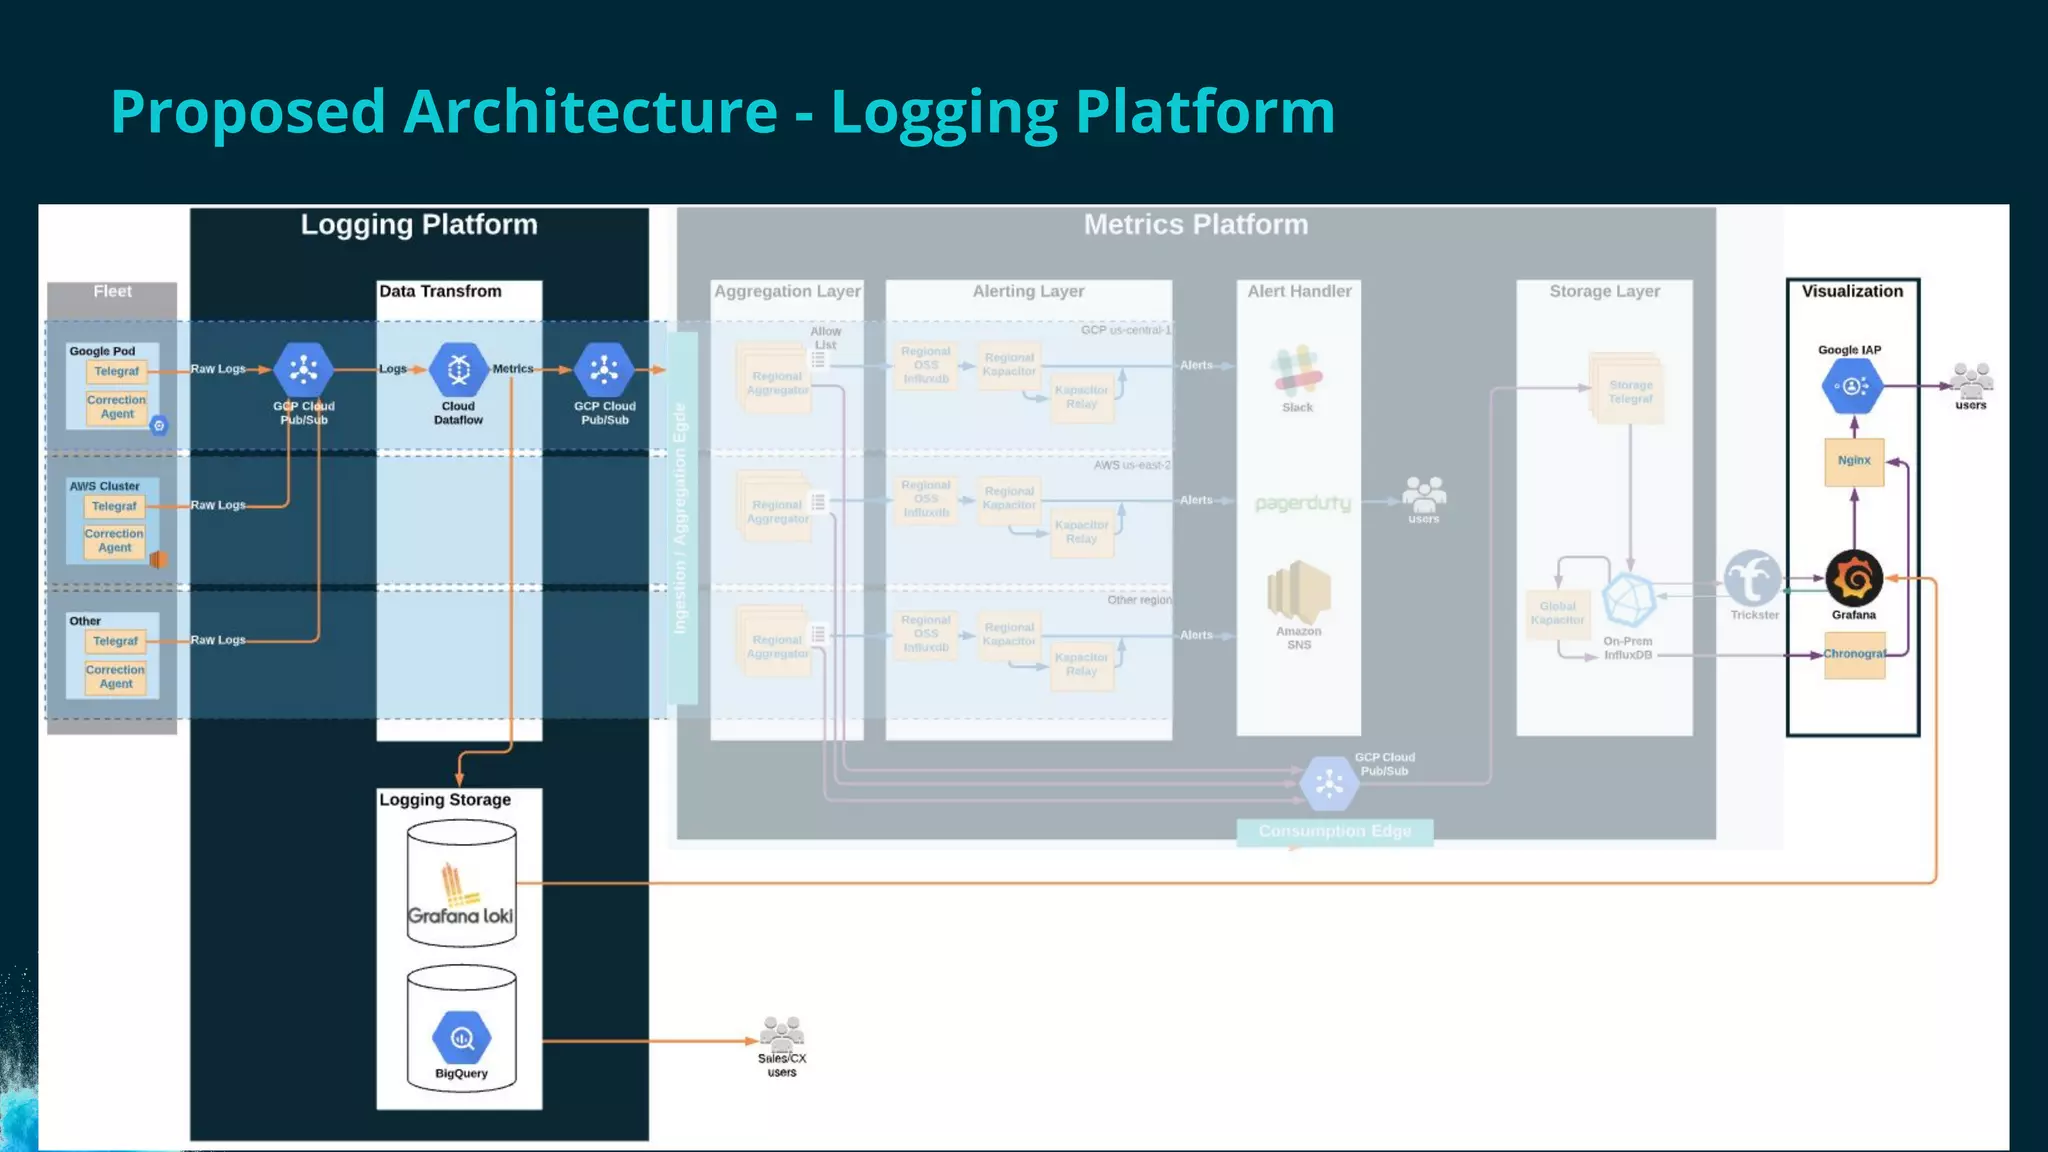
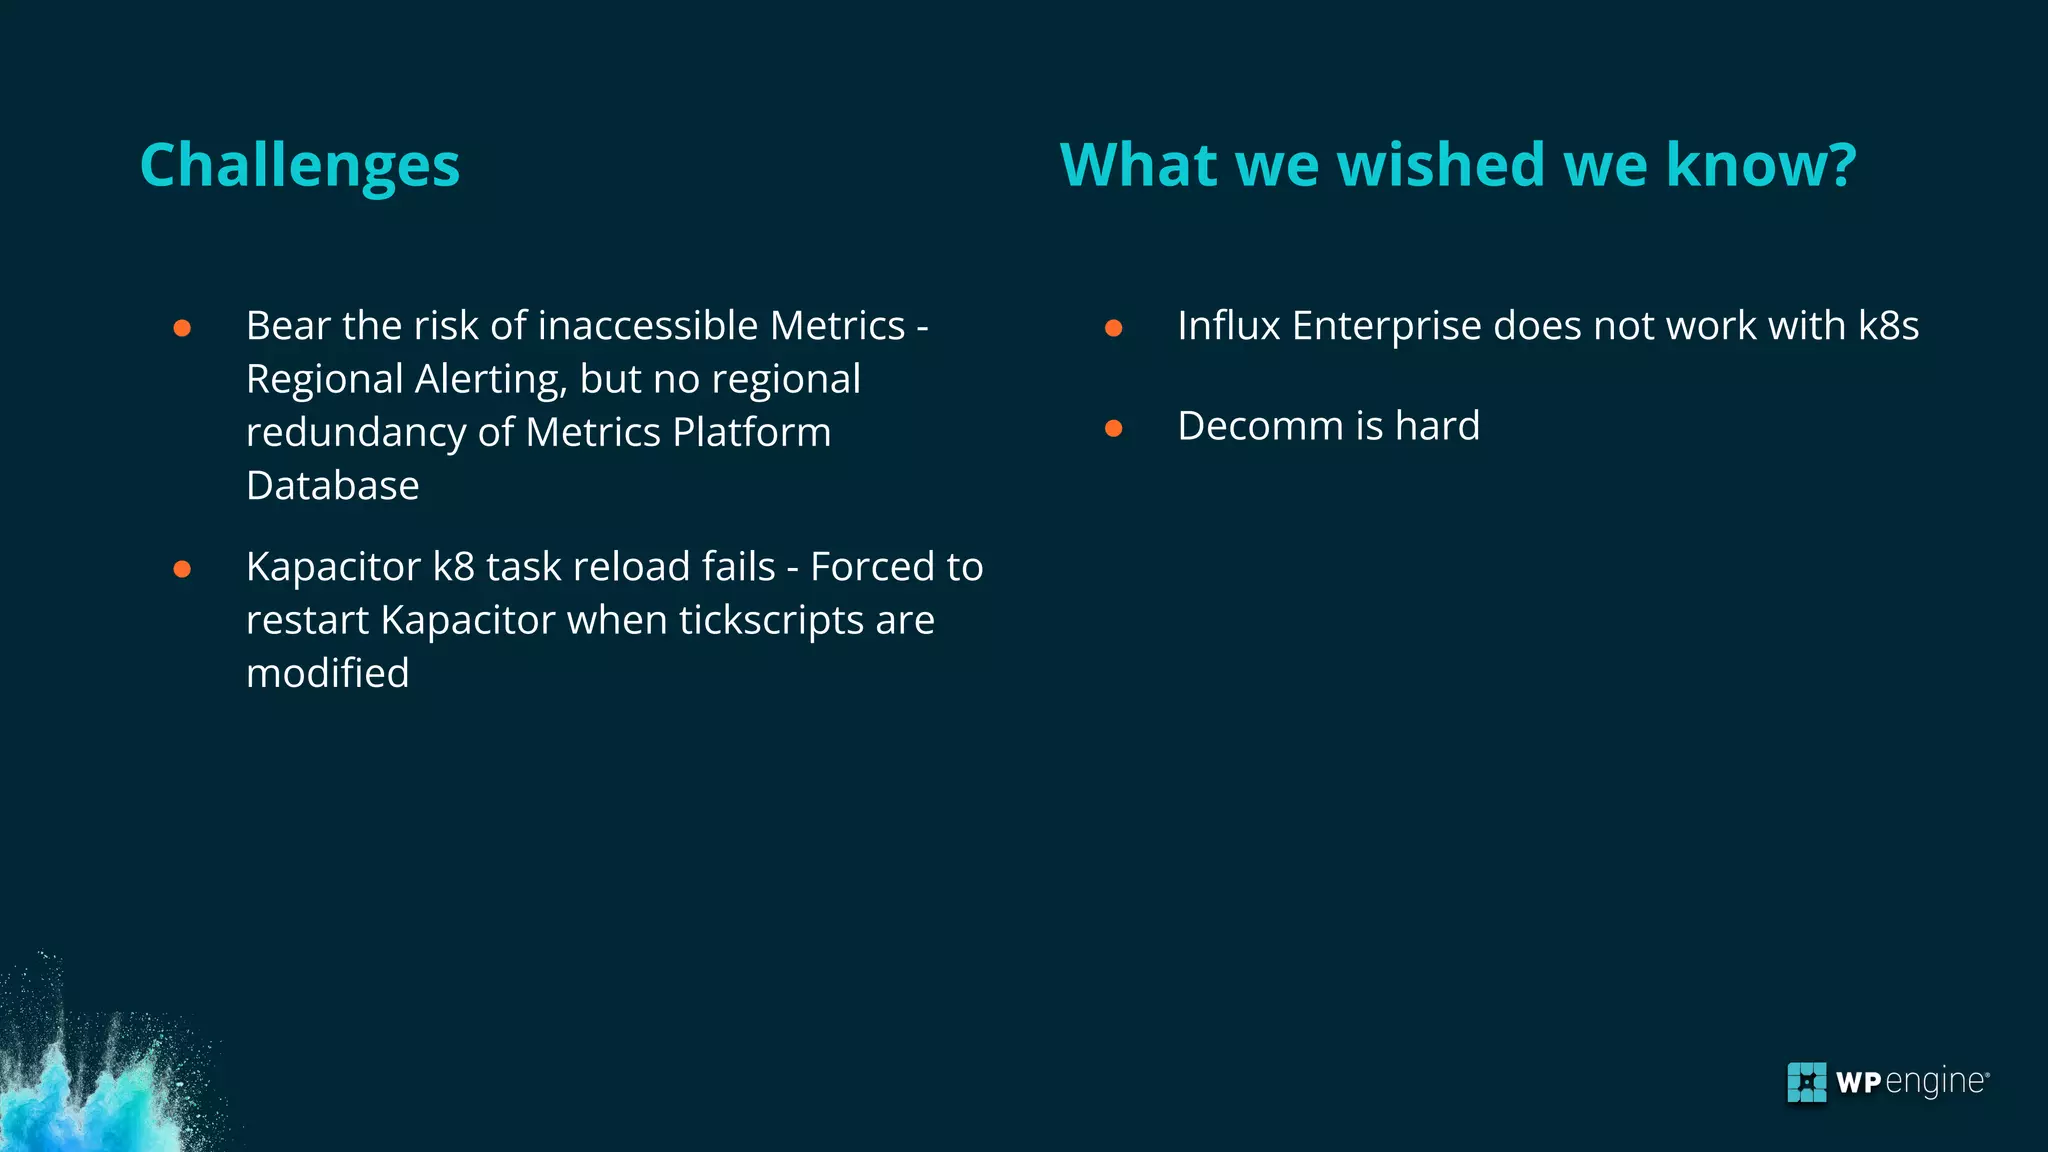


The document discusses transforming monitoring into an observability platform using InfluxDB, highlighting pain points such as downtime and stakeholder impact. It outlines a proposed architecture and challenges faced, including issues with regional alerting and system management. Additionally, it mentions recruitment opportunities at WP Engine.


![Tobias Braun [Herrenknecht AG] | Going Underground with InfluxDB | InfluxDays...](https://cdn.slidesharecdn.com/ss_thumbnails/tobiasbrauninfluxdays-goingundergroundwithinfluxdb-211005172827-thumbnail.jpg?width=640&height=640&fit=bounds)


![Gilmore, Palani [InfluxData] | Use Case: Monitoring / Observability | InfluxD...](https://cdn.slidesharecdn.com/ss_thumbnails/usecasemonitoringobservabilityreviewed-221020212958-9acef1d5-thumbnail.jpg?width=640&height=640&fit=bounds)

![Tim Hall [InfluxData] | InfluxDB Roadmap | InfluxDays Virtual Experience NA 2020](https://cdn.slidesharecdn.com/ss_thumbnails/influxdaysna2020-influxdbroadmap1-201111180905-thumbnail.jpg?width=640&height=640&fit=bounds)
![Brian Gilmore [InfluxData] | InfluxDB in an IoT Application Architecture | In...](https://cdn.slidesharecdn.com/ss_thumbnails/brian-gilmoreinfluxdays-2021iot1-211022195133-thumbnail.jpg?width=640&height=640&fit=bounds)
![Charles Mahler [InfluxData] | Use Case: Networking Monitoring | InfluxDays 2022](https://cdn.slidesharecdn.com/ss_thumbnails/networkmonitoringusecaseoverviewcharles-221020212537-fda46bca-thumbnail.jpg?width=640&height=640&fit=bounds)


![Ward Bowman [PTC] | ThingWorx Long-Term Data Storage with InfluxDB | InfluxDa...](https://cdn.slidesharecdn.com/ss_thumbnails/influxdays-221027185325-5d2f430b-thumbnail.jpg?width=640&height=640&fit=bounds)
![Paul Dix [InfluxData] The Journey of InfluxDB | InfluxDays 2022](https://cdn.slidesharecdn.com/ss_thumbnails/2022-11-02influxdays-journeyofinfluxdb-221020214252-ff7c76c5-thumbnail.jpg?width=640&height=640&fit=bounds)


![Steinkamp, Clifford [InfluxData] | Welcome to InfluxDays 2022 - Day 2 | Influ...](https://cdn.slidesharecdn.com/ss_thumbnails/influxdays2022welcometoday2-221020215815-c8463942-thumbnail.jpg?width=640&height=640&fit=bounds)
![Steinkamp, Clifford [InfluxData] | Closing Thoughts | InfluxDays 2022](https://cdn.slidesharecdn.com/ss_thumbnails/influxdays2022closingthoughtsday2-221020220104-abde55ea-thumbnail.jpg?width=640&height=640&fit=bounds)
![Steinkamp, Clifford [InfluxData] | Closing Thoughts Day 1 | InfluxDays 2022](https://cdn.slidesharecdn.com/ss_thumbnails/influxdays2022closingthoughtsday1-221020215301-f8040e1f-thumbnail.jpg?width=640&height=640&fit=bounds)

![Scott Anderson [InfluxData] | New & Upcoming Flux Features | InfluxDays 2022](https://cdn.slidesharecdn.com/ss_thumbnails/influxdays2022-fluxupdates-scott-221021210238-9d323cba-thumbnail.jpg?width=640&height=640&fit=bounds)


