Download as PDF, PPTX
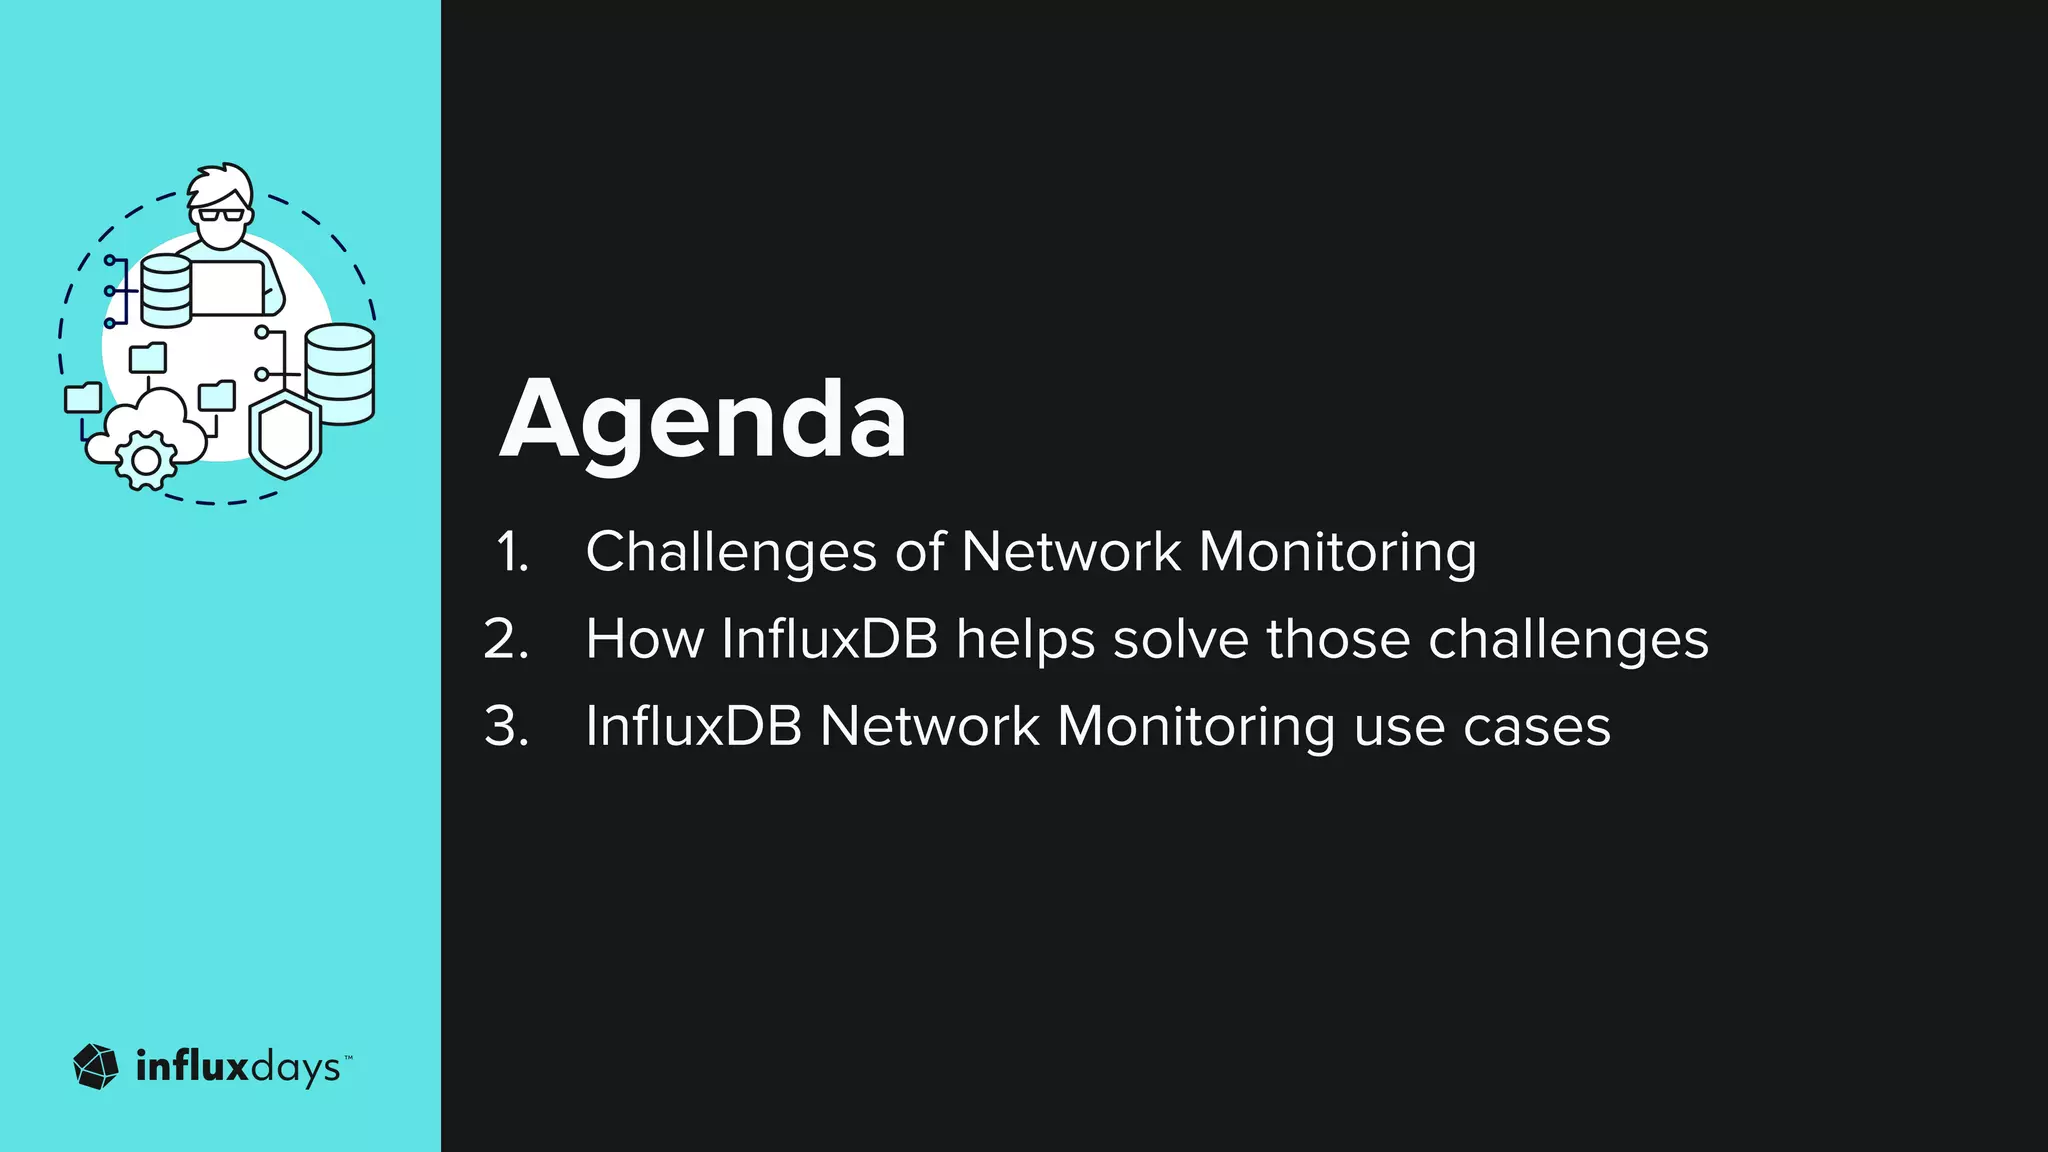
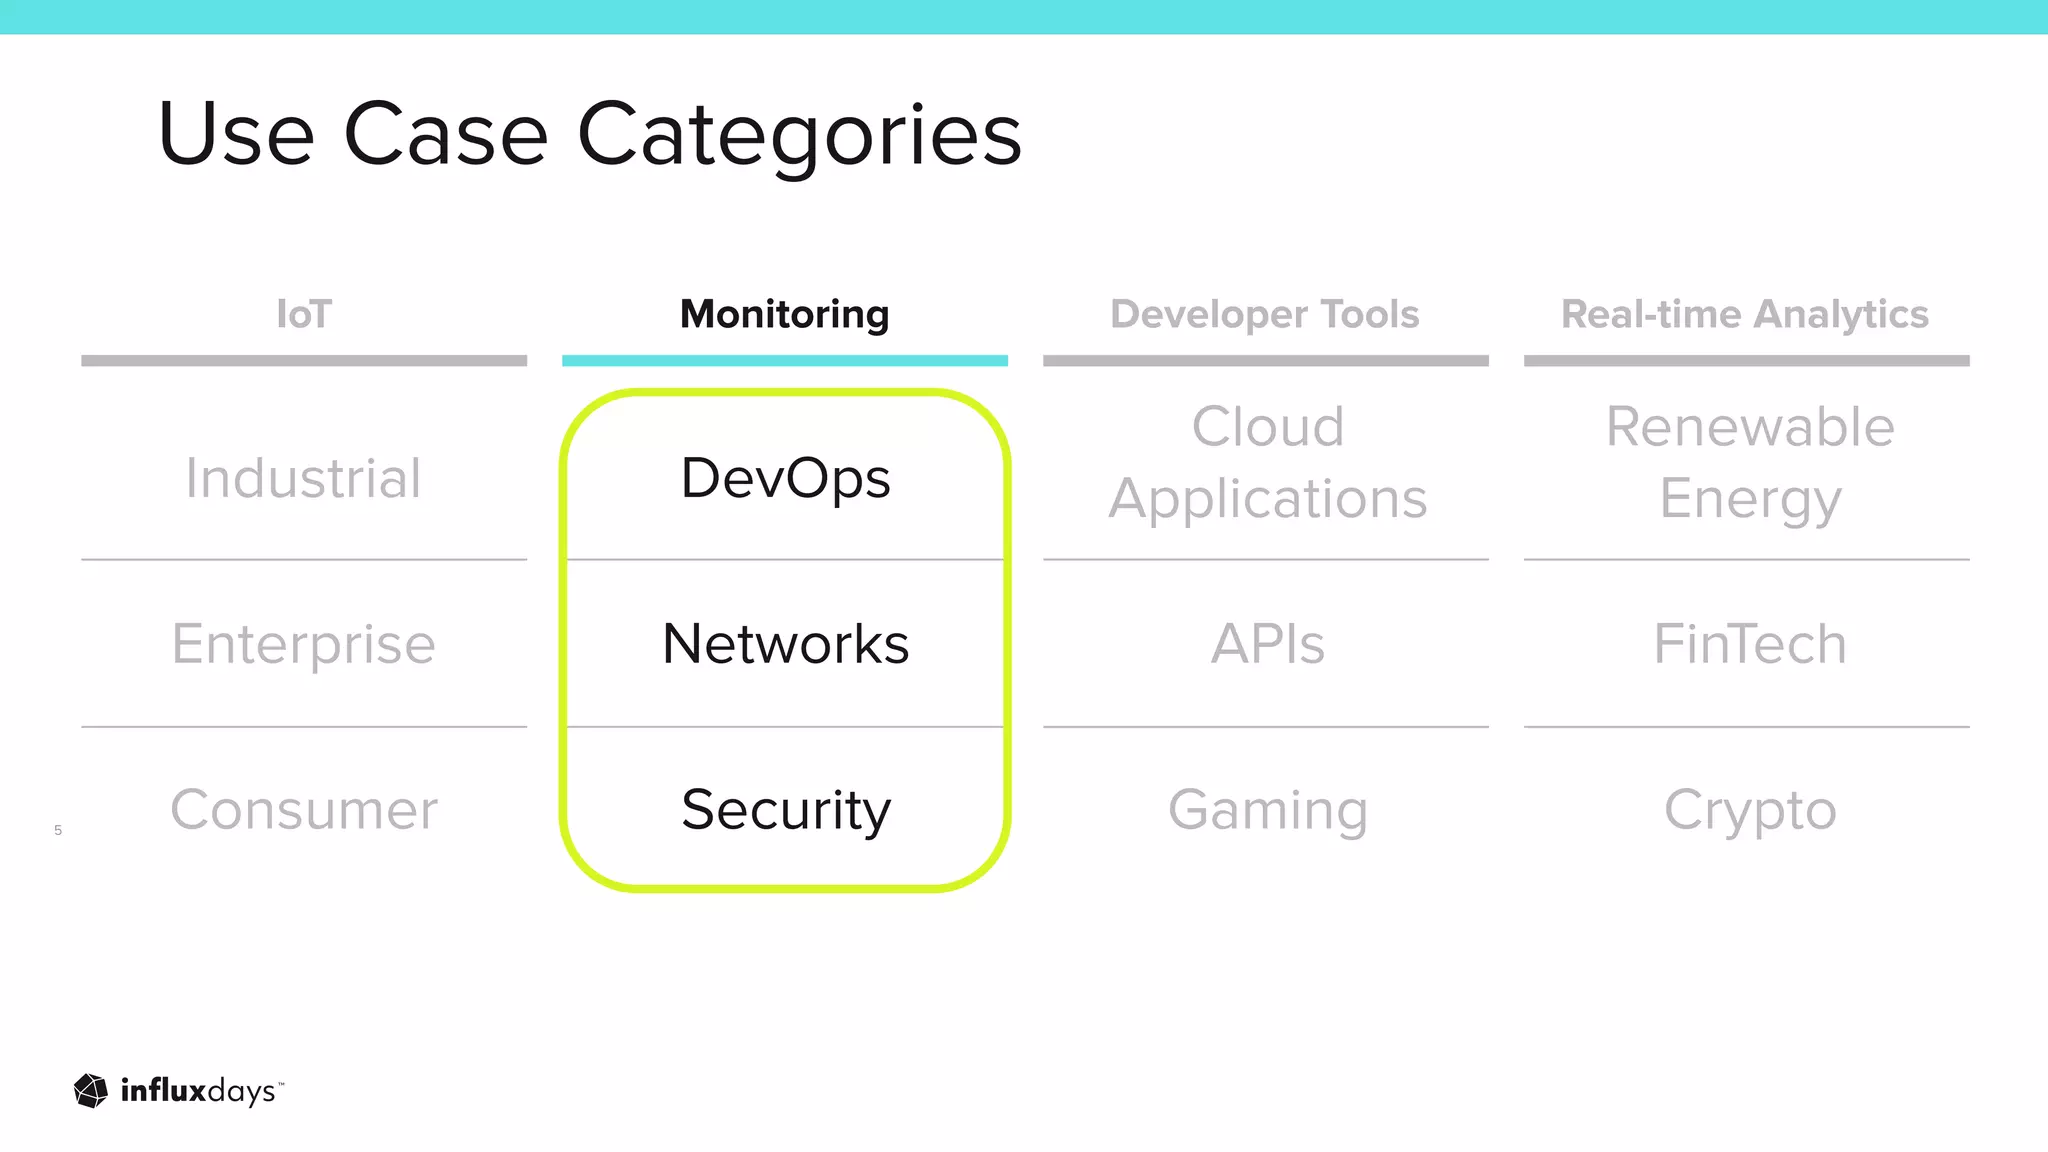
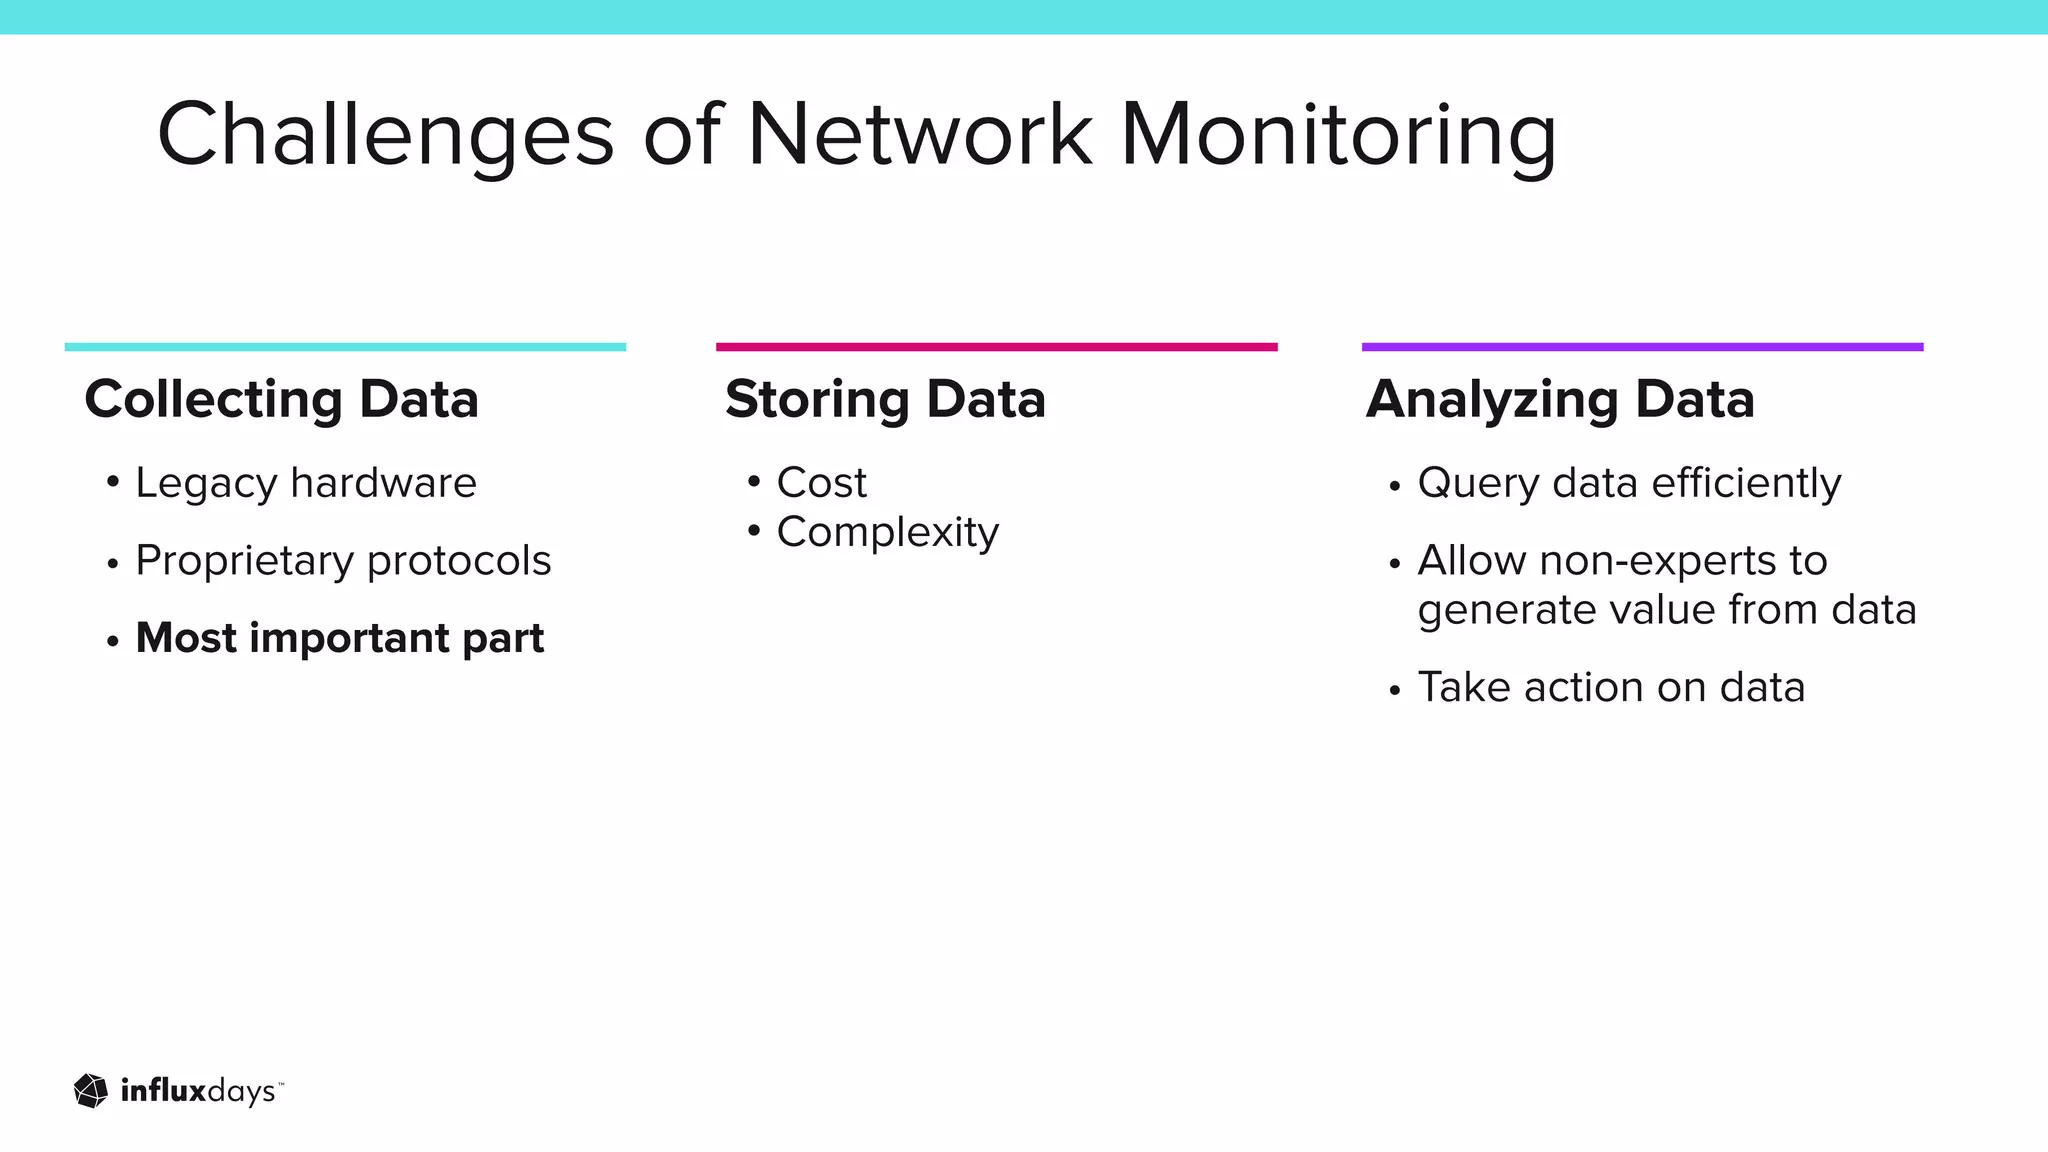
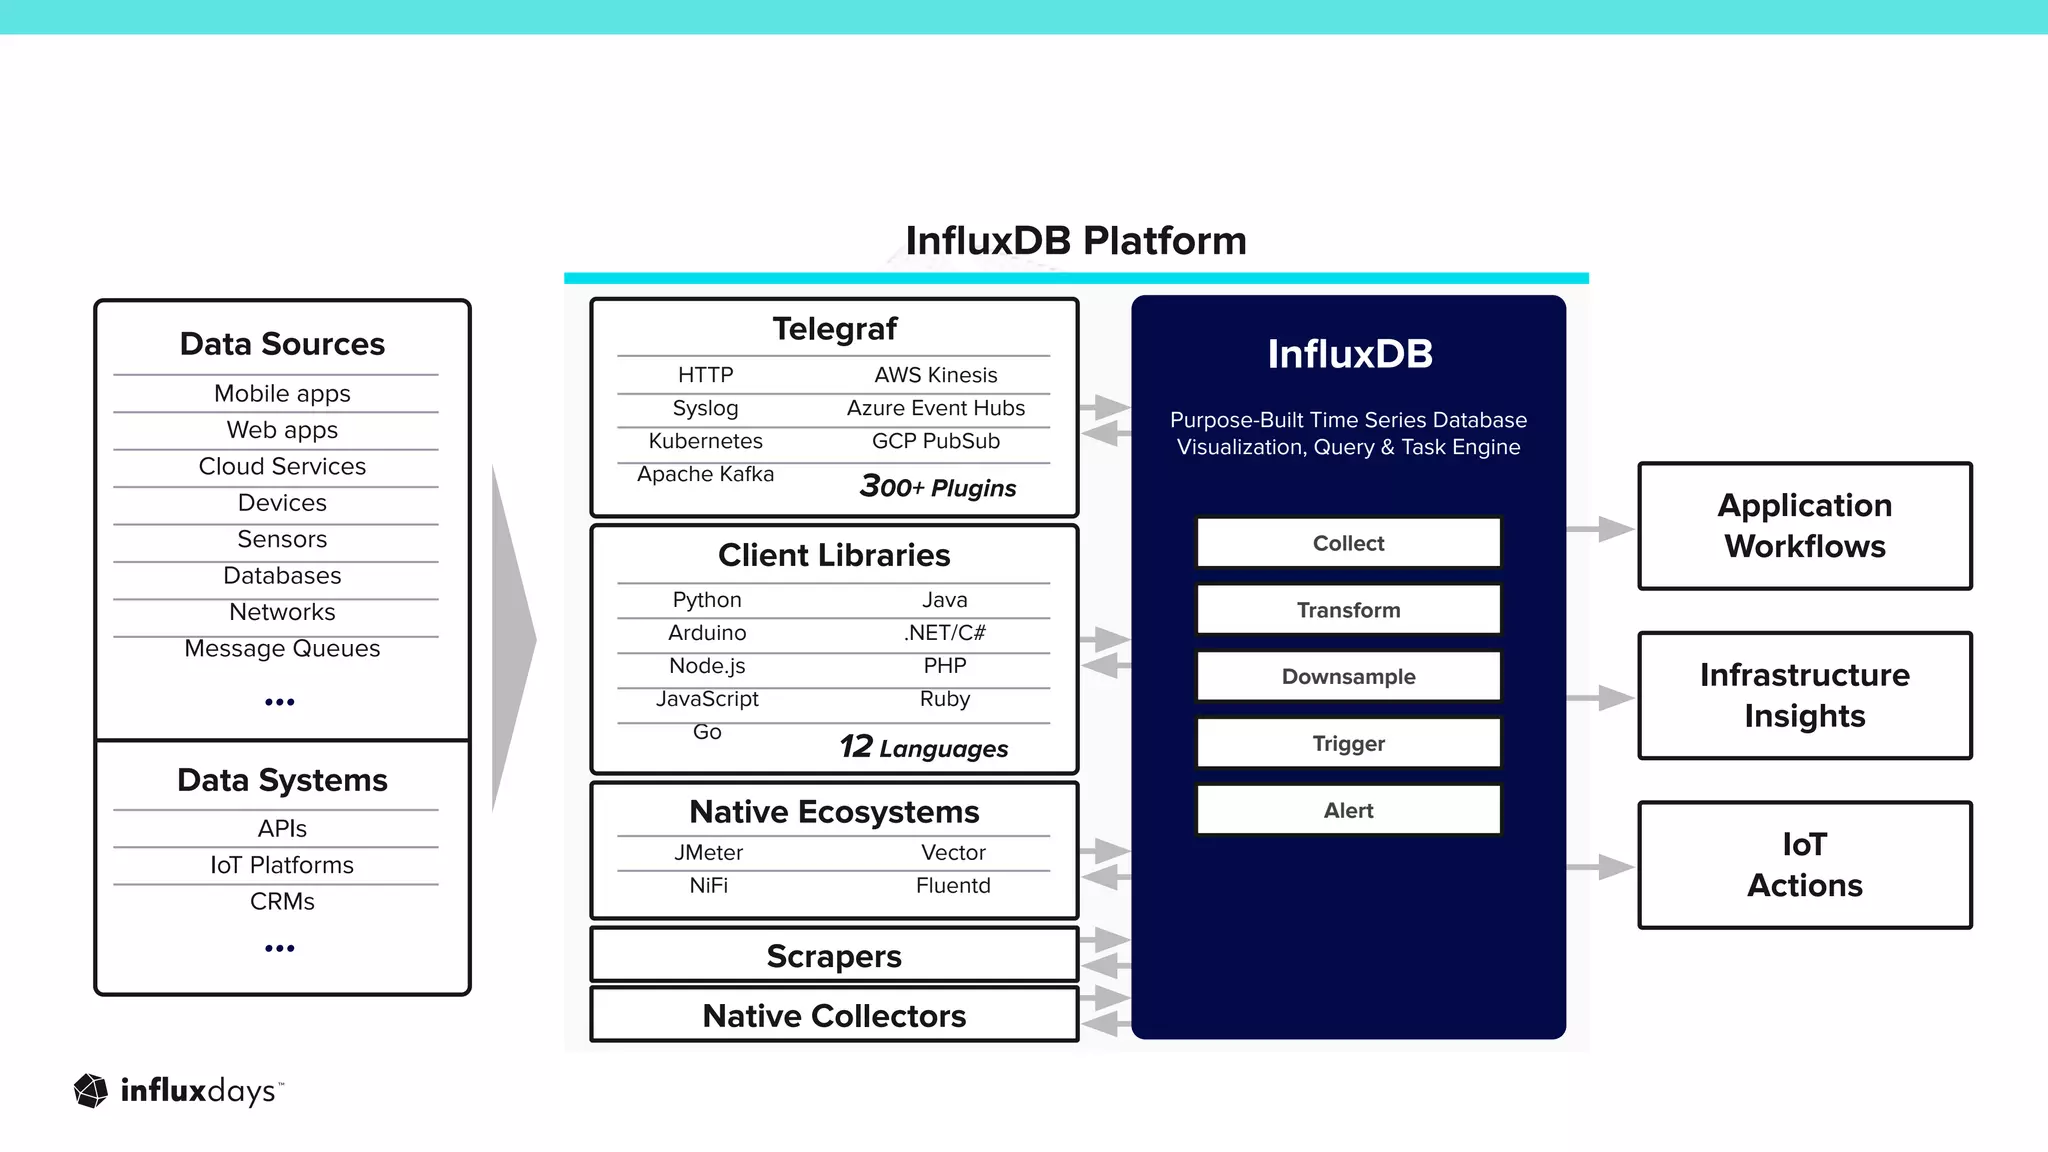
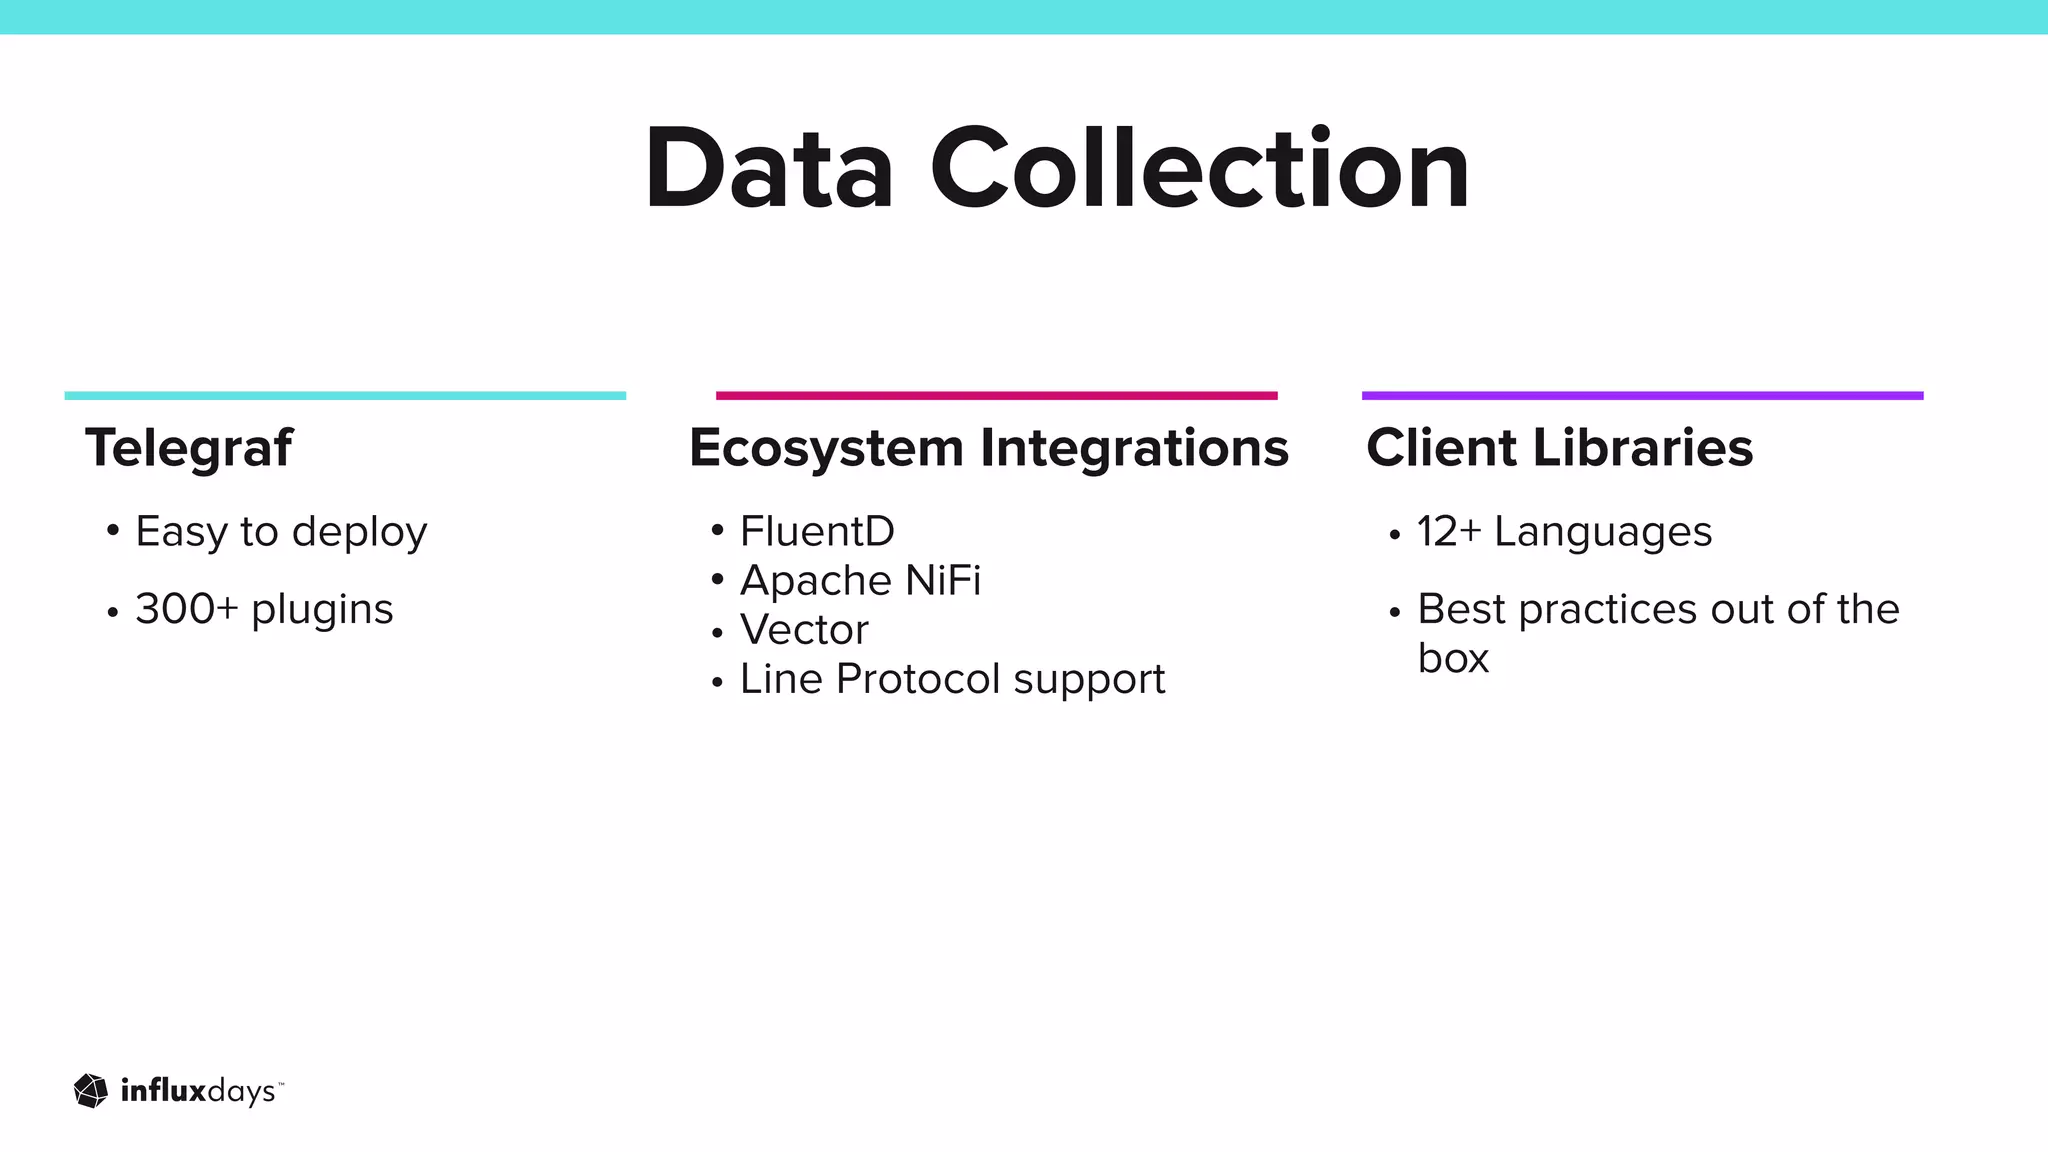
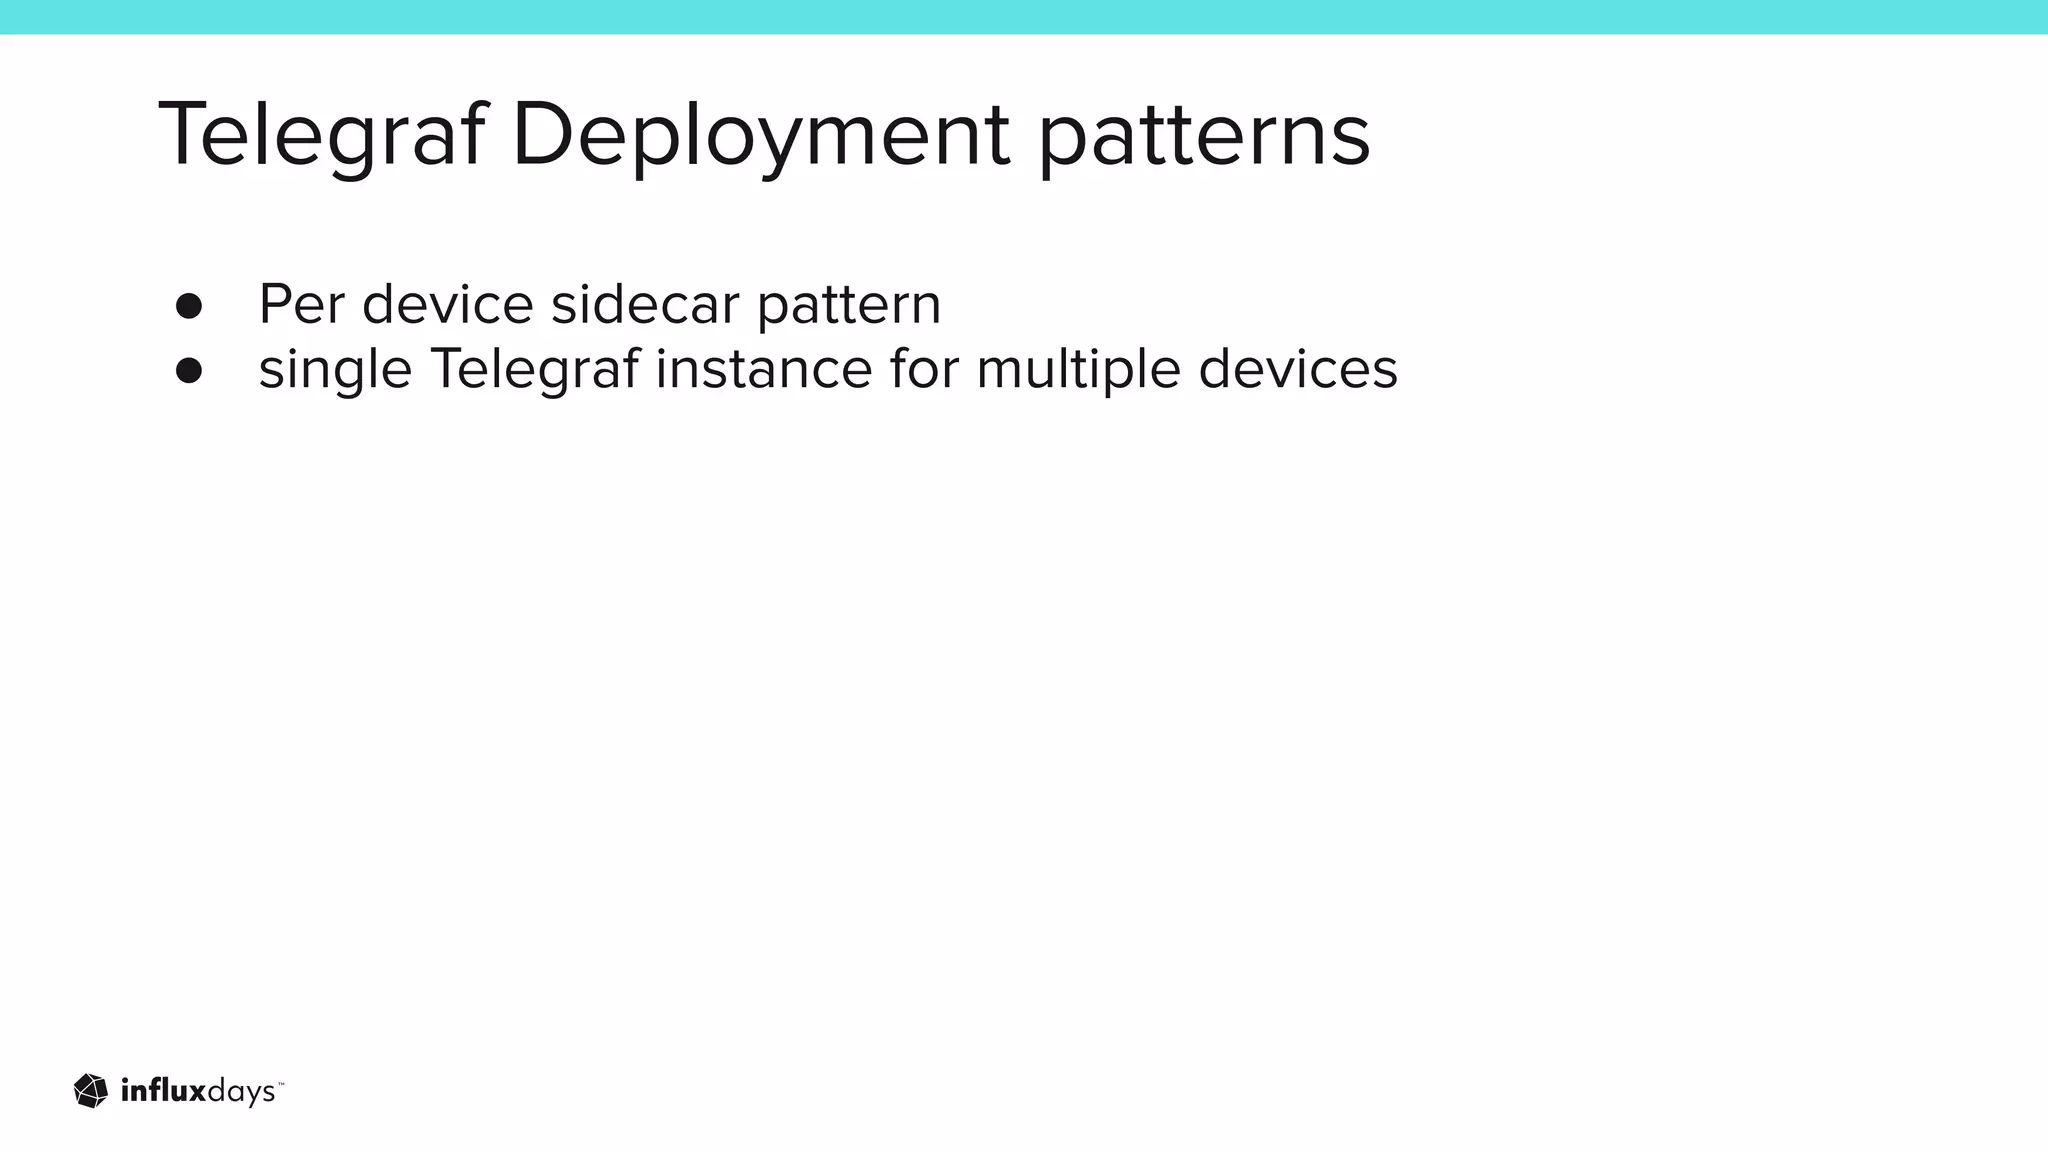
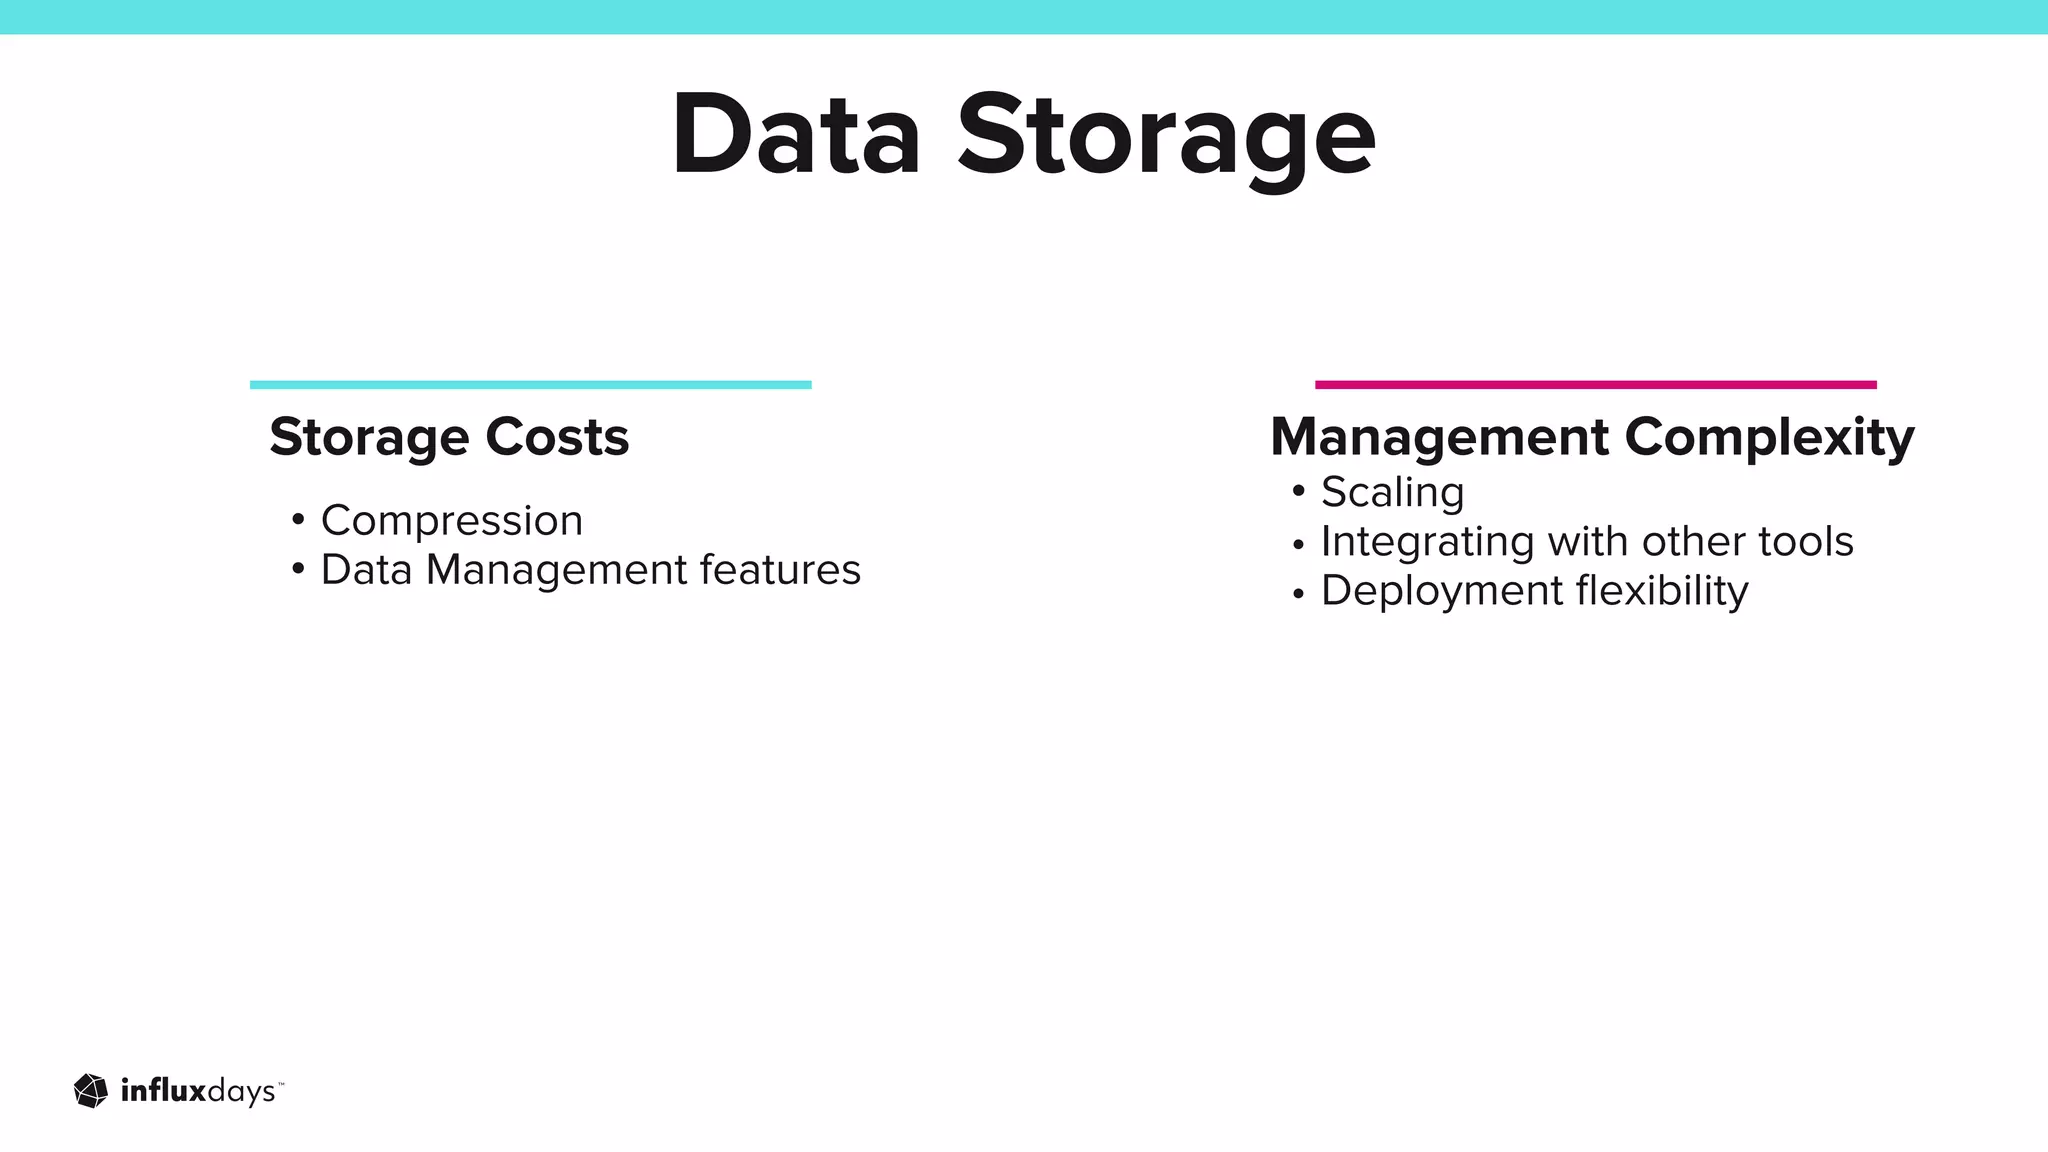
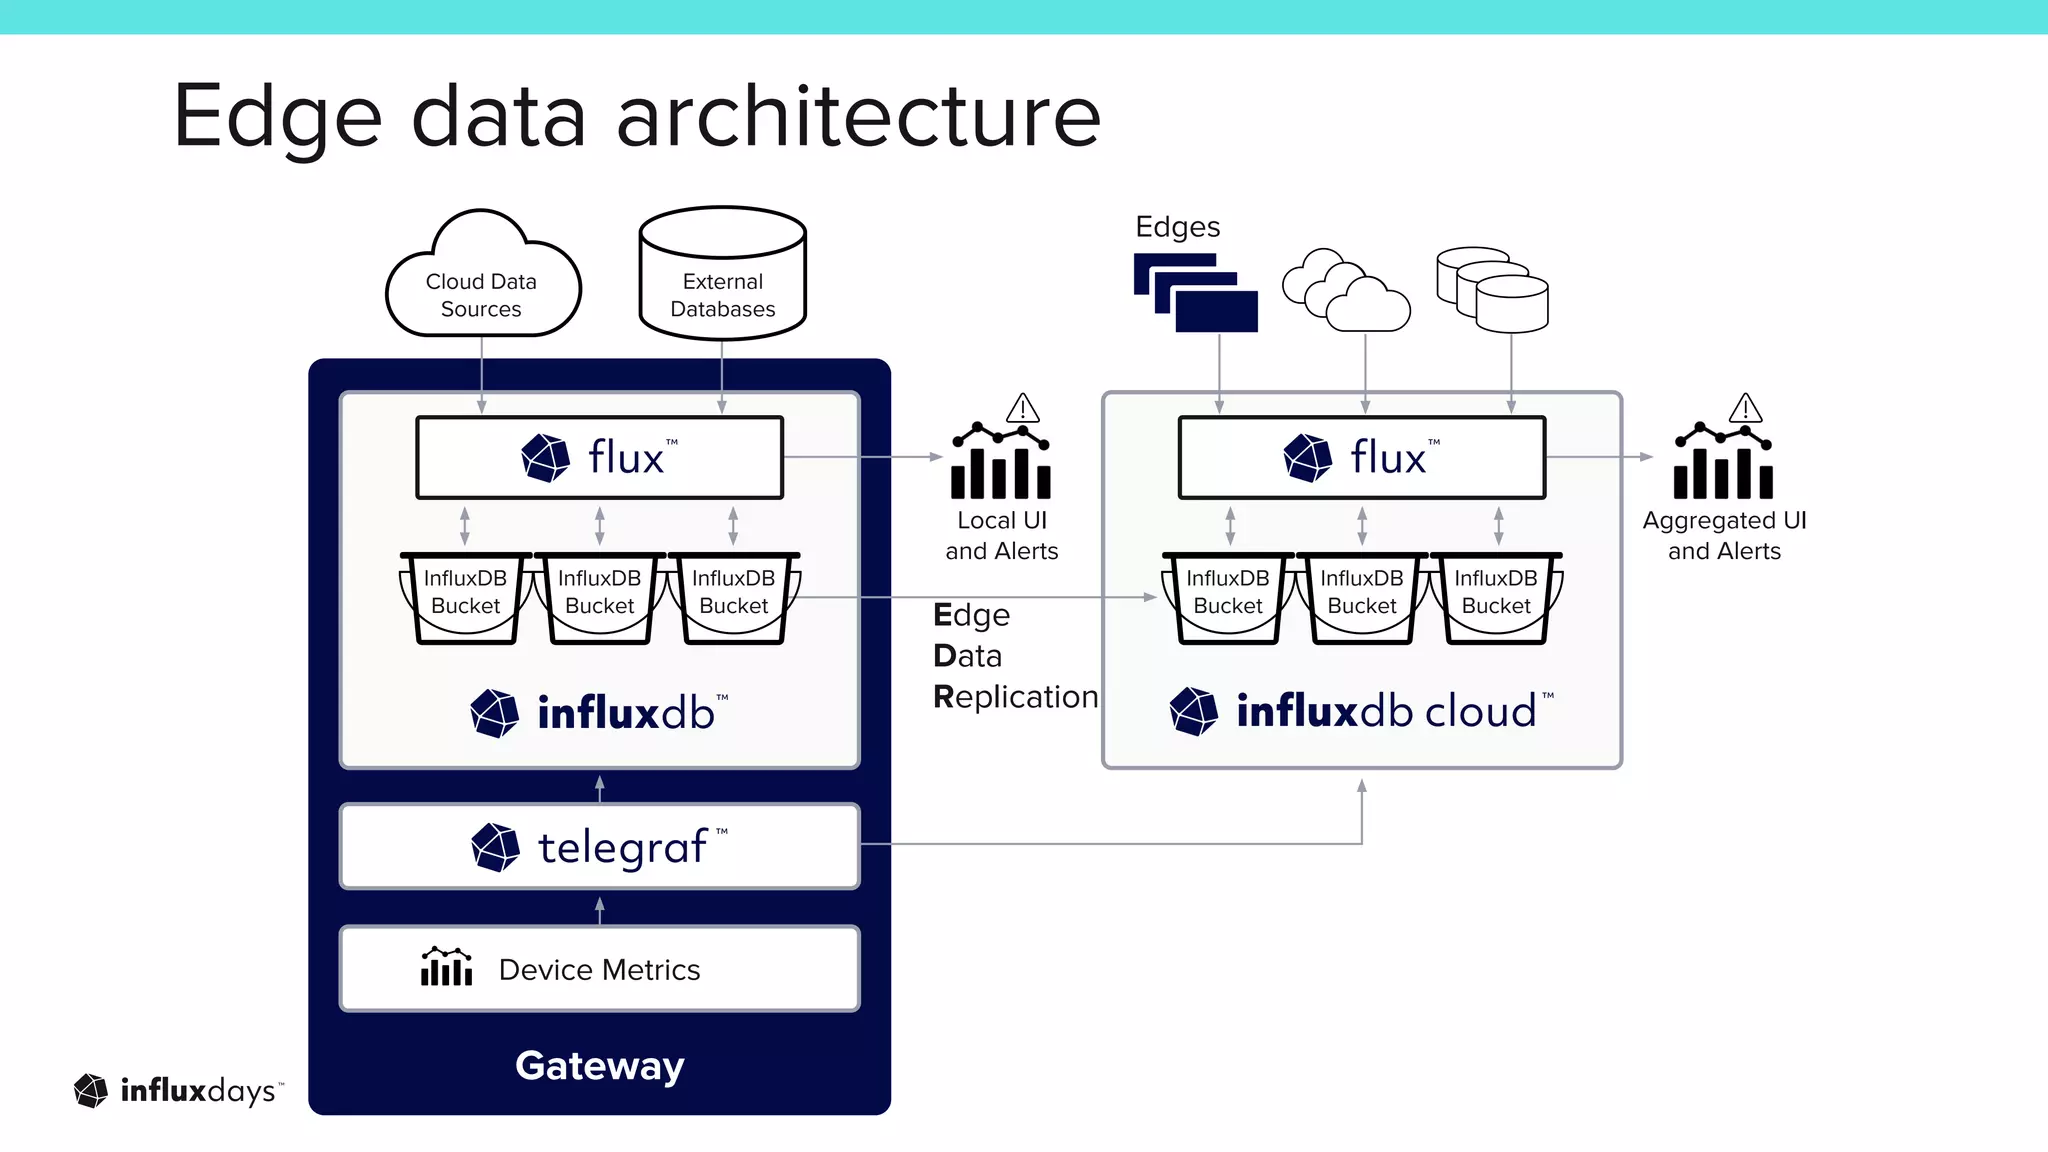
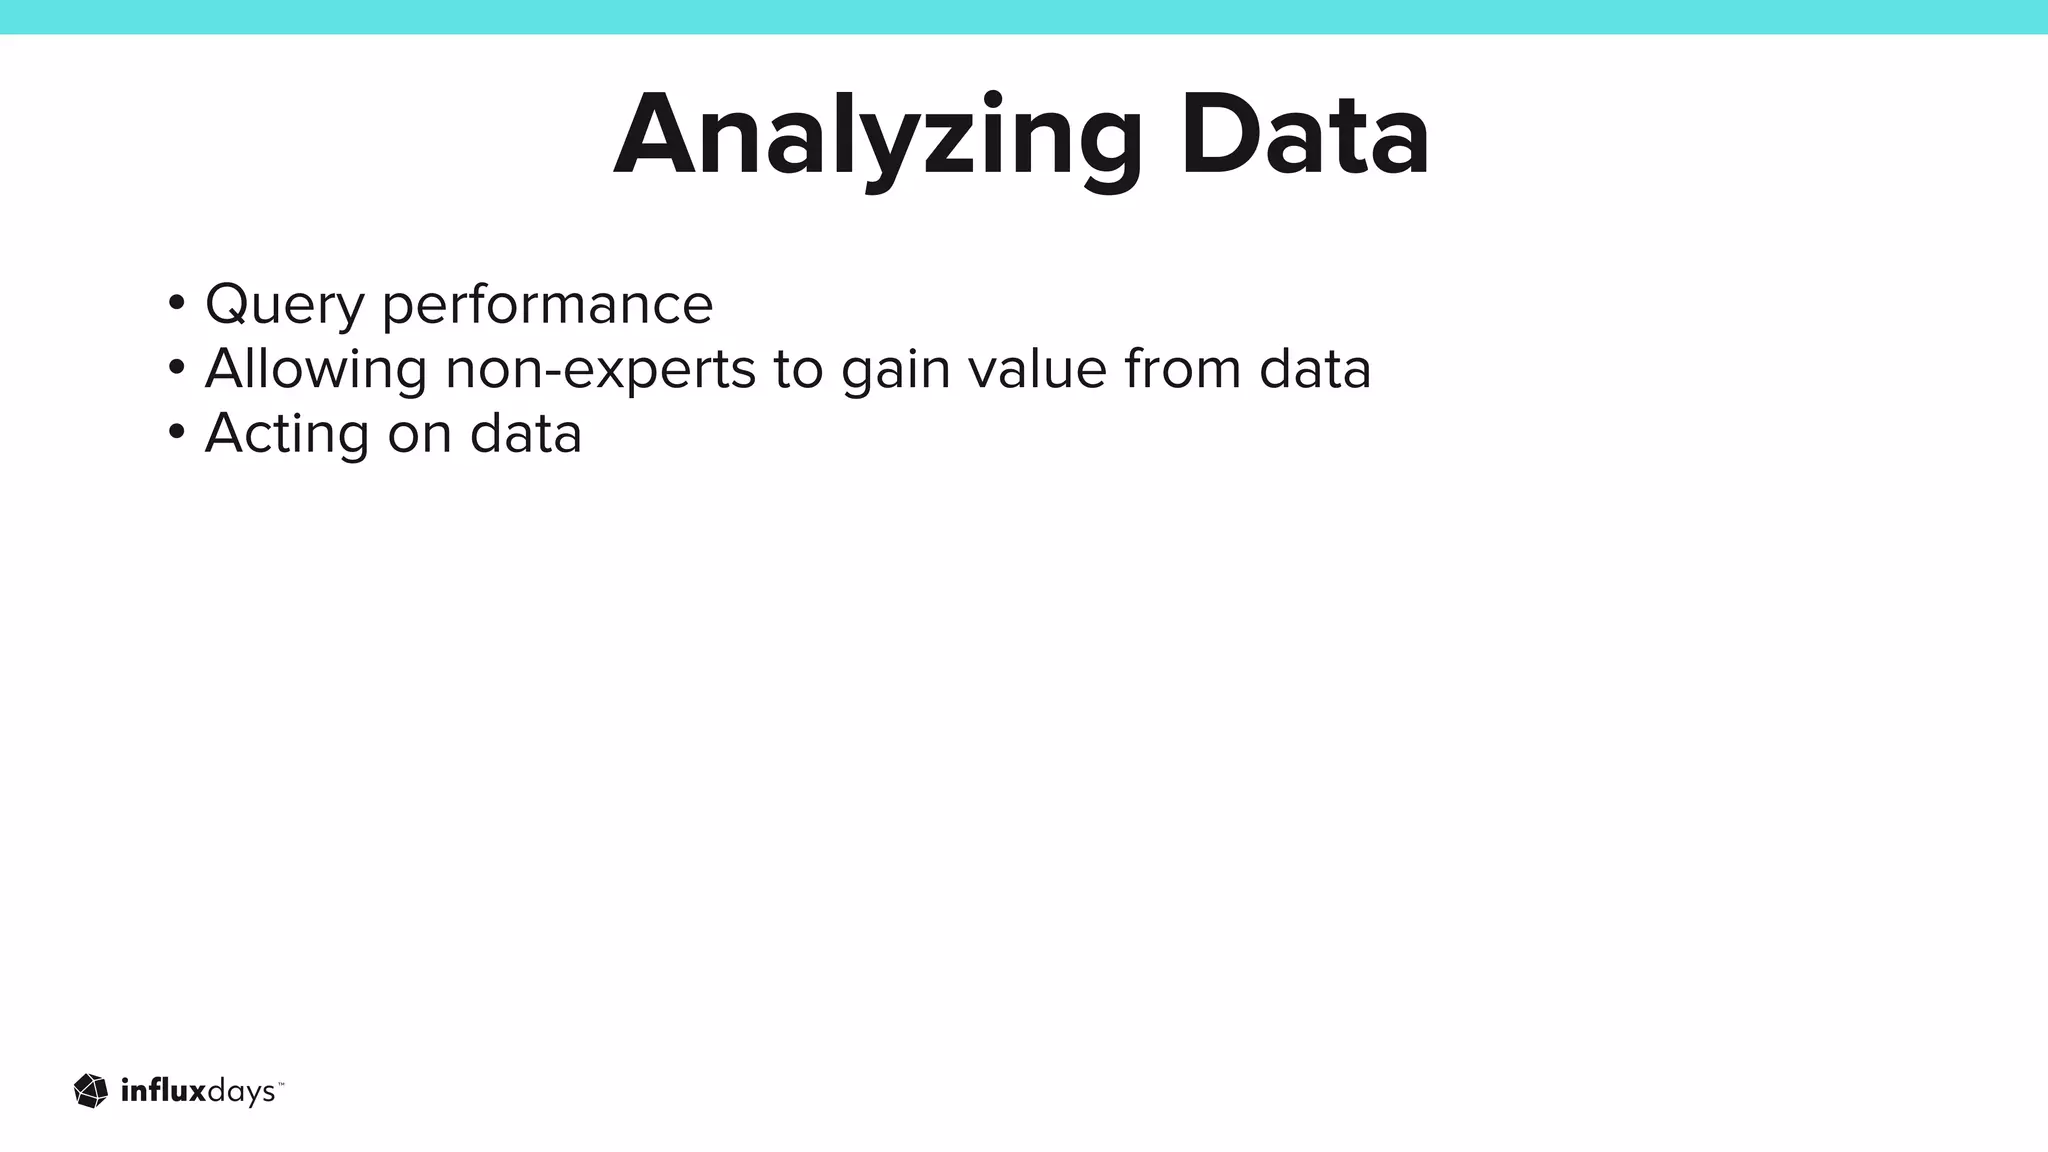
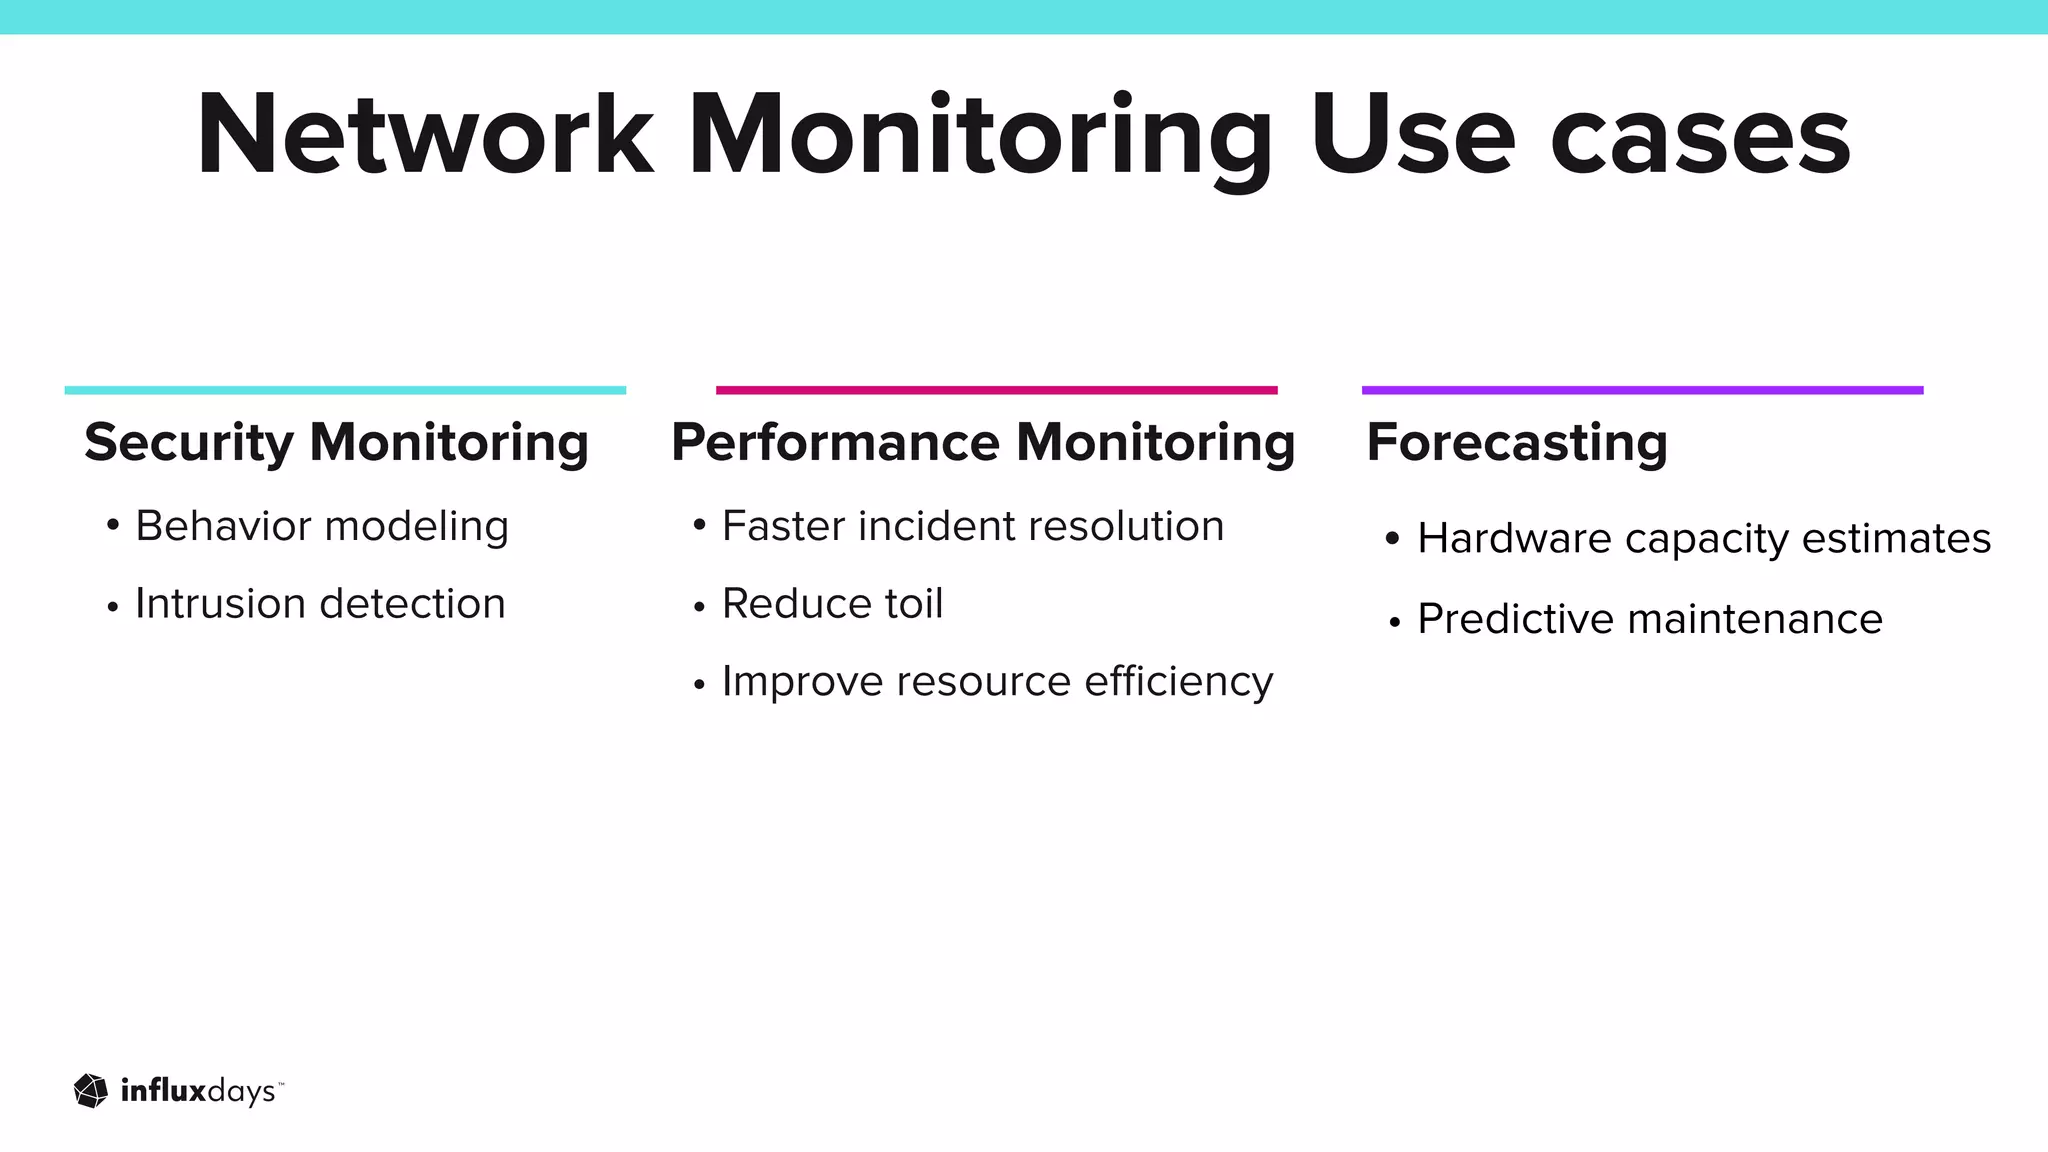
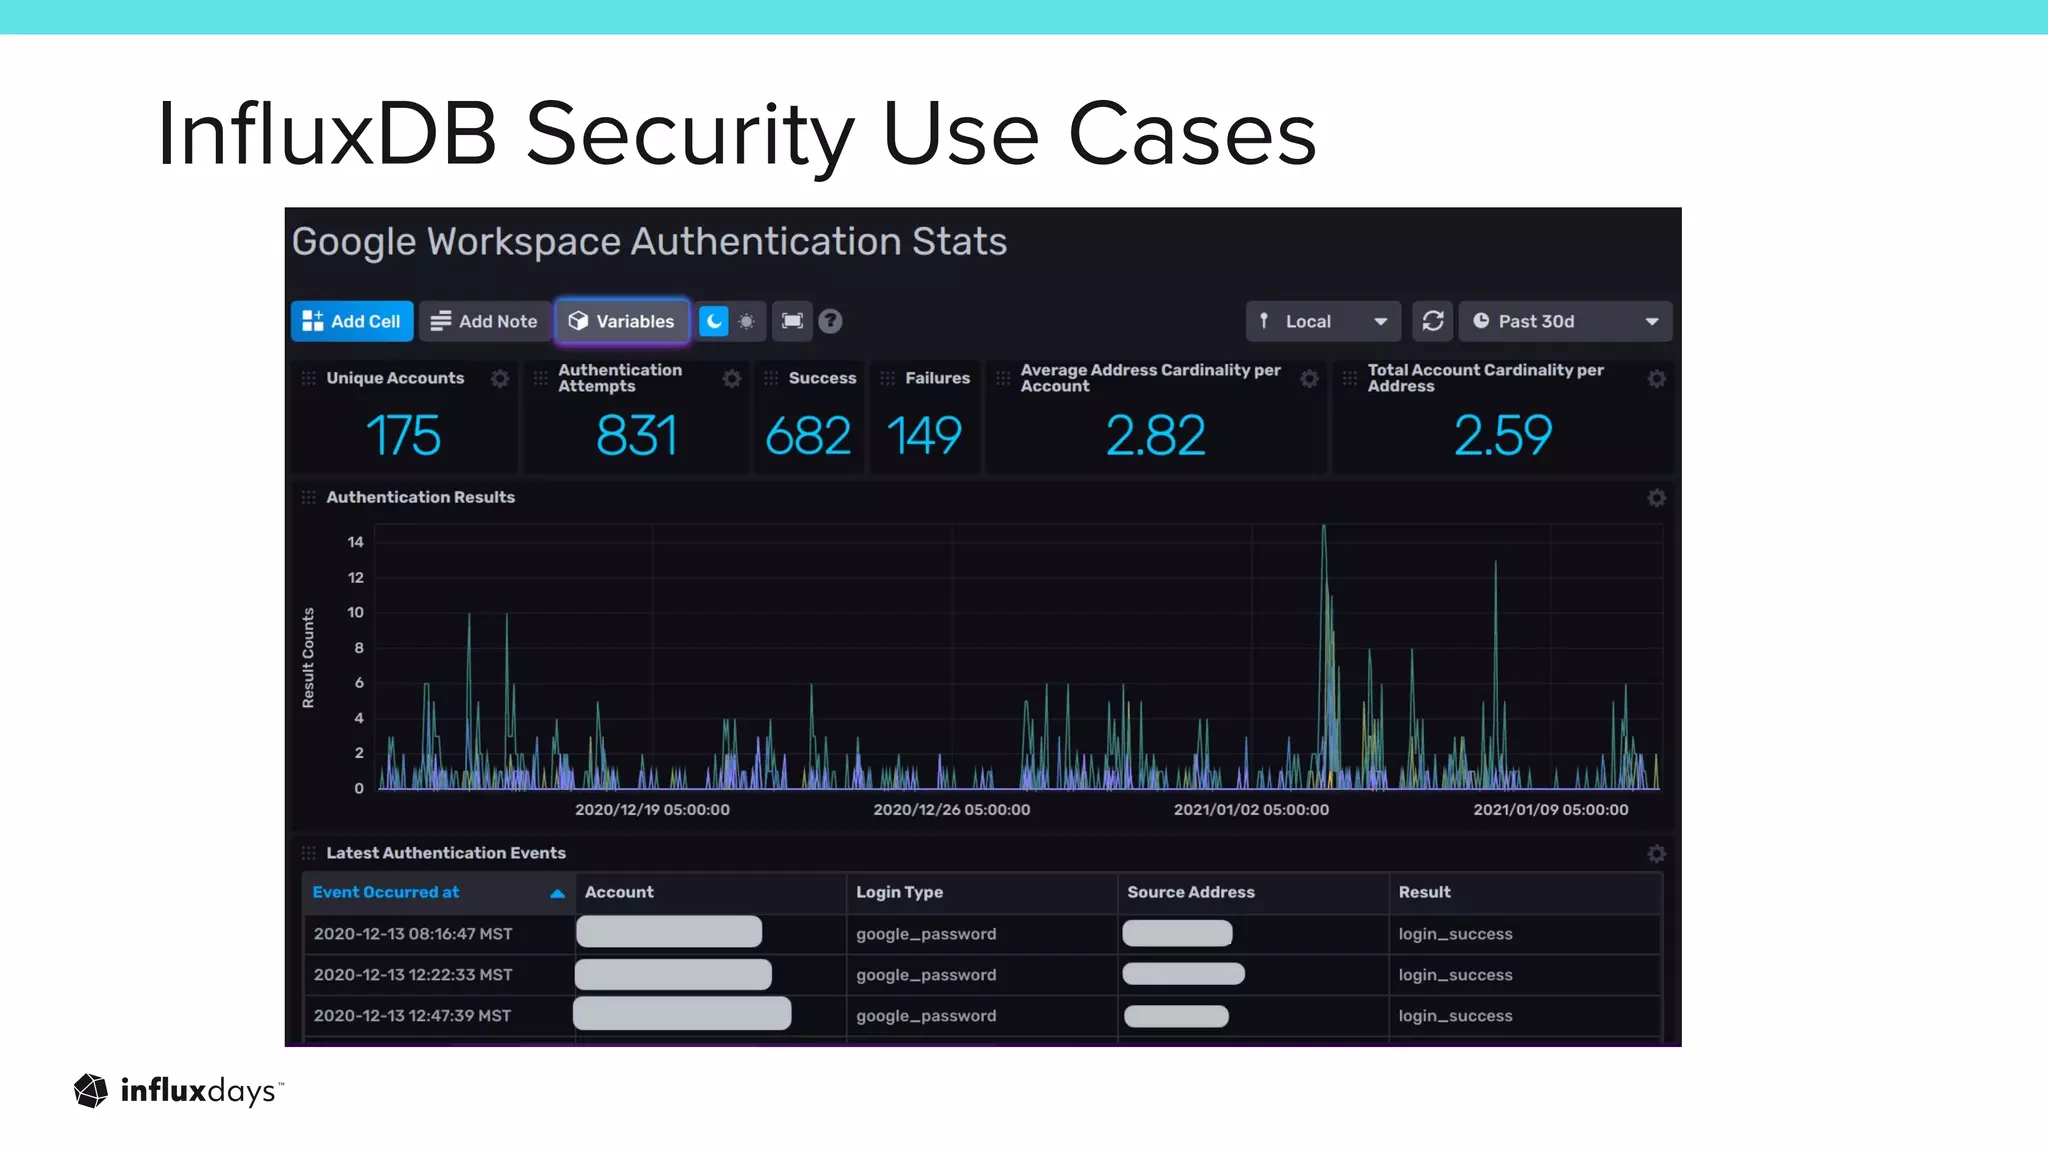
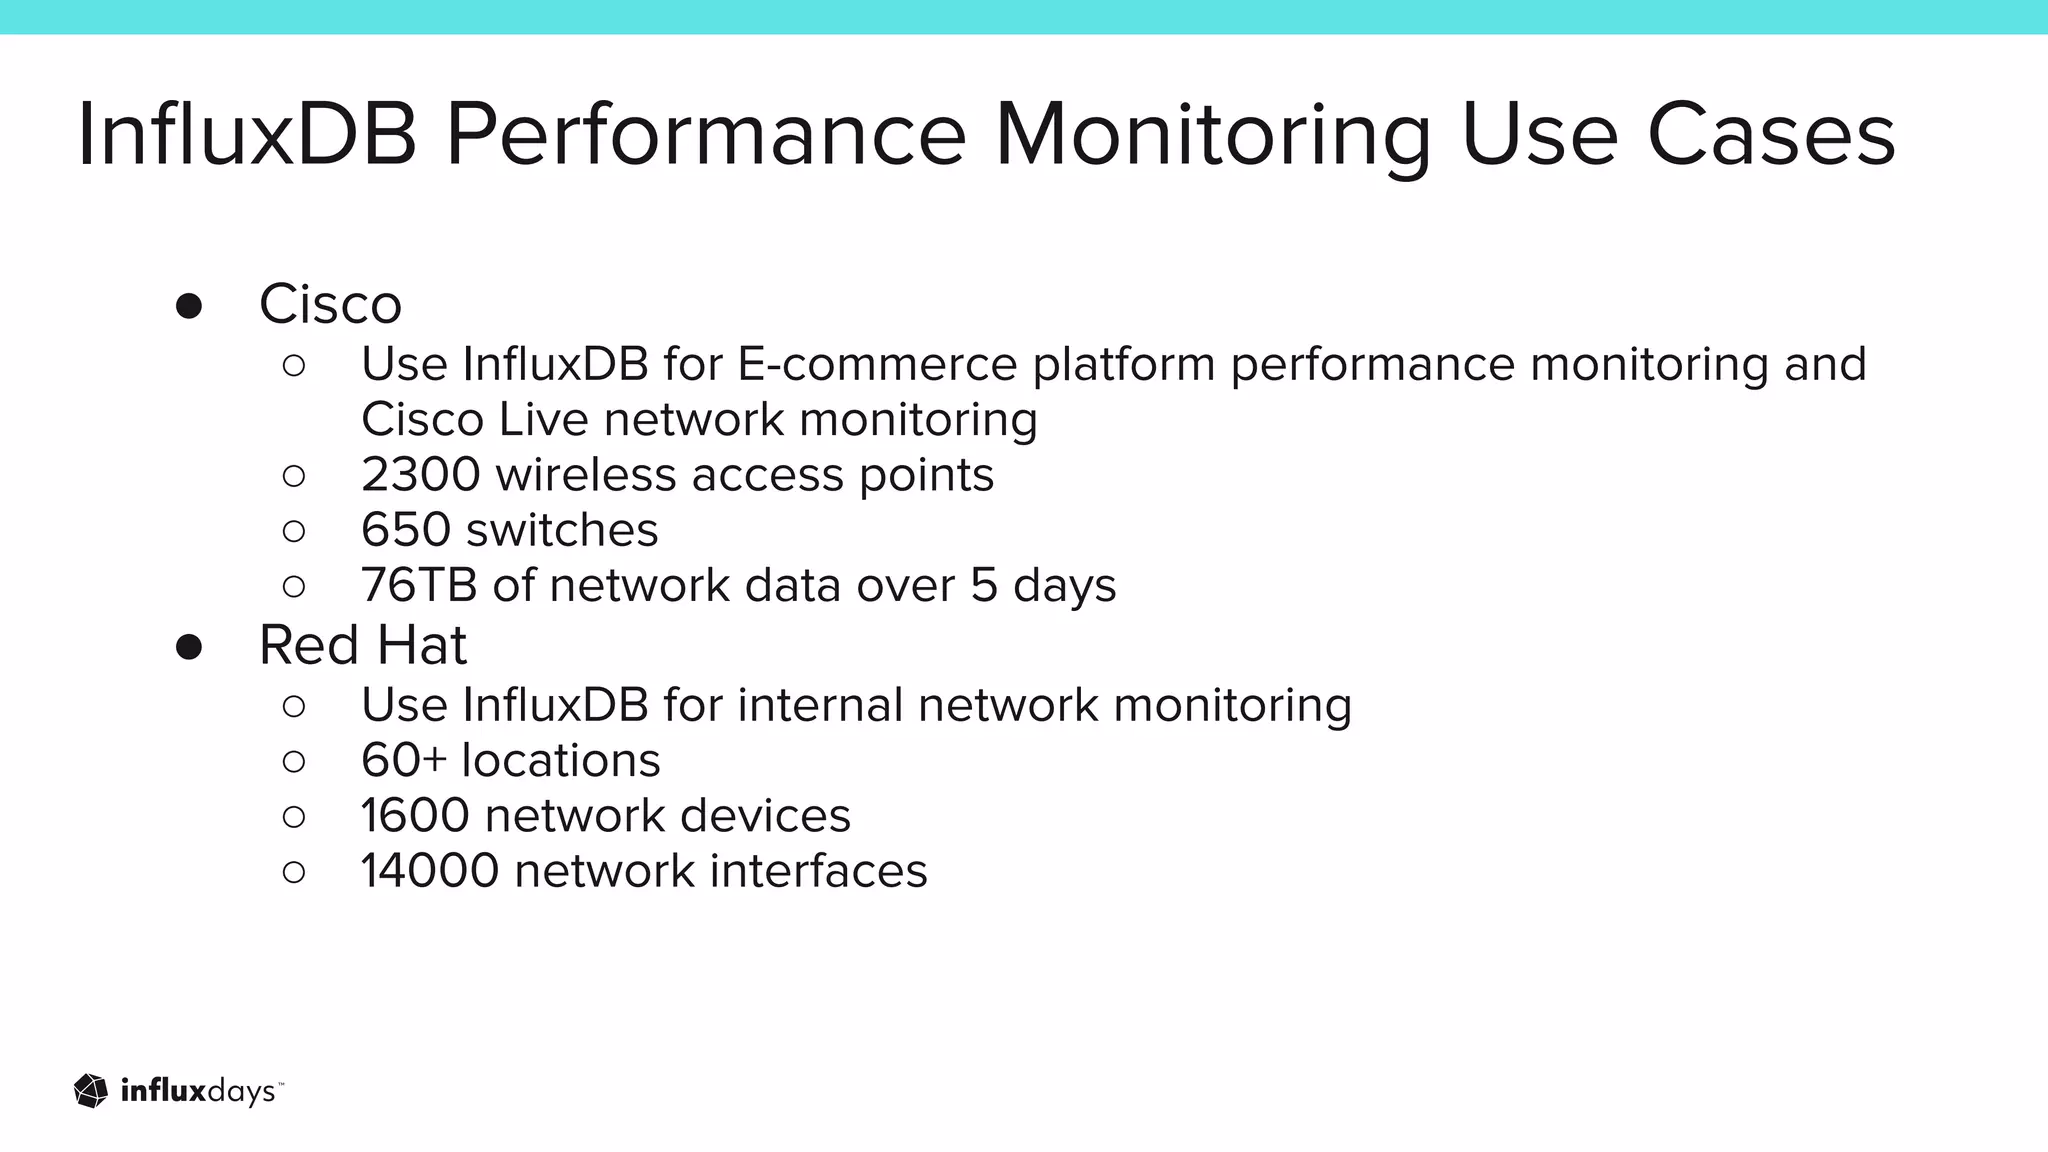
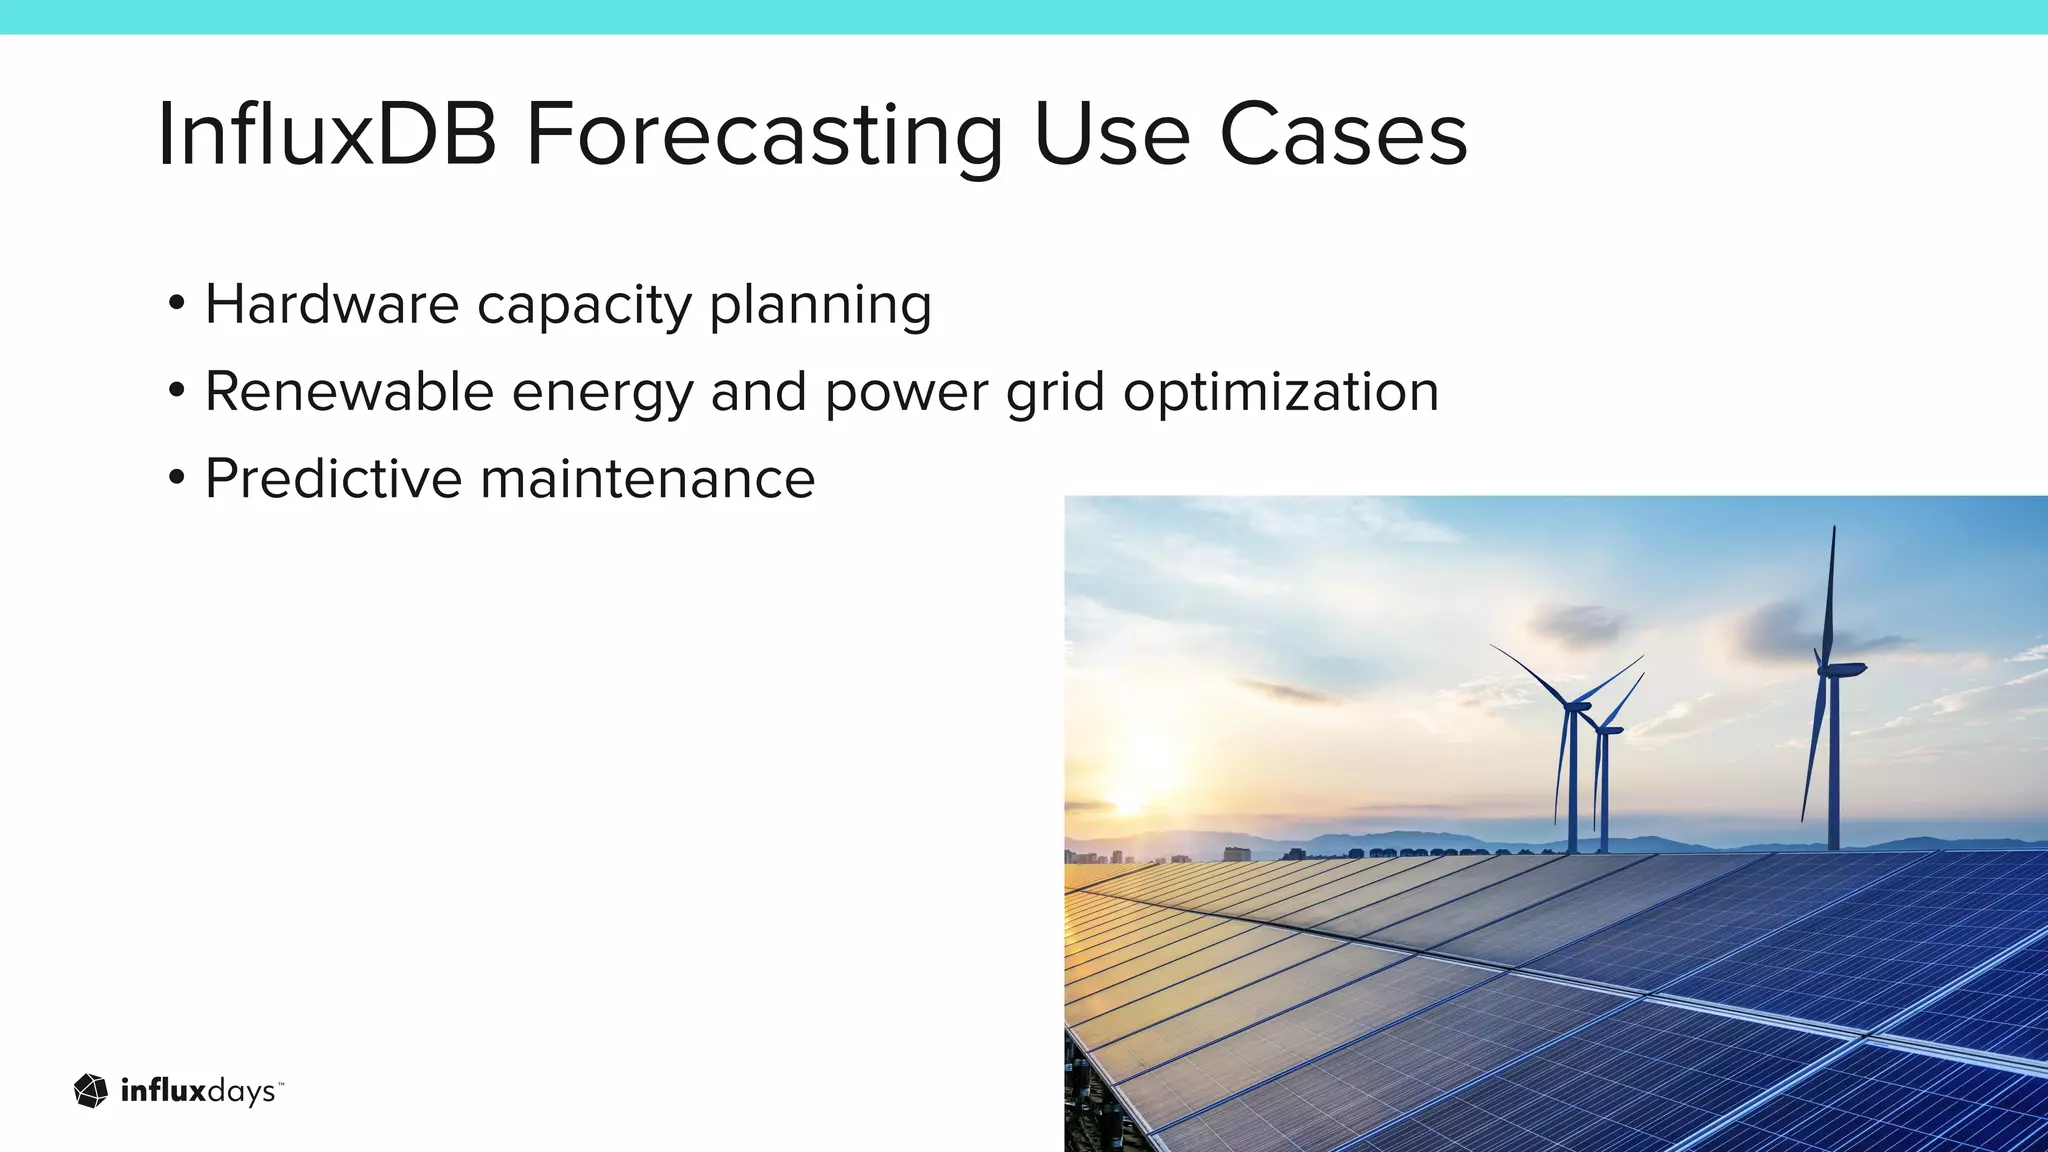

The document outlines how InfluxDB can address challenges in network monitoring, such as data collection, storage, and analysis. It highlights various use cases, including security monitoring, performance monitoring, and predictive maintenance across different industries. The session discusses the ecosystem's tools, like telegraf, and integration capabilities for effective network management.

![Gilmore, Palani [InfluxData] | Use Case: Monitoring / Observability | InfluxD...](https://cdn.slidesharecdn.com/ss_thumbnails/usecasemonitoringobservabilityreviewed-221020212958-9acef1d5-thumbnail.jpg?width=640&height=640&fit=bounds)


![Paul Dix [InfluxData] | InfluxDays Keynote: Future of InfluxDB | InfluxDays N...](https://cdn.slidesharecdn.com/ss_thumbnails/2021-10-26whytimeseries-influxdaysna-211026005527-thumbnail.jpg?width=640&height=640&fit=bounds)


![Tim Hall [InfluxData] | InfluxDB Roadmap | InfluxDays Virtual Experience NA 2020](https://cdn.slidesharecdn.com/ss_thumbnails/influxdaysna2020-influxdbroadmap1-201111180905-thumbnail.jpg?width=640&height=640&fit=bounds)


![Ryan Betts [InfluxData] | Influxdays Keynote: Engineering Update | InfluxDays...](https://cdn.slidesharecdn.com/ss_thumbnails/ryan-influxdays-na-2021-211026005555-thumbnail.jpg?width=640&height=640&fit=bounds)
![Evan Kaplan [InfluxData] | InfluxDays Opening Remarks | InfluxDays EMEA 2021](https://cdn.slidesharecdn.com/ss_thumbnails/evankaplanslides-210519180533-thumbnail.jpg?width=640&height=640&fit=bounds)


![Ward Bowman [PTC] | ThingWorx Long-Term Data Storage with InfluxDB | InfluxDa...](https://cdn.slidesharecdn.com/ss_thumbnails/influxdays-221027185325-5d2f430b-thumbnail.jpg?width=640&height=640&fit=bounds)


![Steinkamp, Clifford [InfluxData] | Welcome to InfluxDays 2022 - Day 2 | Influ...](https://cdn.slidesharecdn.com/ss_thumbnails/influxdays2022welcometoday2-221020215815-c8463942-thumbnail.jpg?width=640&height=640&fit=bounds)
![Steinkamp, Clifford [InfluxData] | Closing Thoughts | InfluxDays 2022](https://cdn.slidesharecdn.com/ss_thumbnails/influxdays2022closingthoughtsday2-221020220104-abde55ea-thumbnail.jpg?width=640&height=640&fit=bounds)
![Steinkamp, Clifford [InfluxData] | Closing Thoughts Day 1 | InfluxDays 2022](https://cdn.slidesharecdn.com/ss_thumbnails/influxdays2022closingthoughtsday1-221020215301-f8040e1f-thumbnail.jpg?width=640&height=640&fit=bounds)

![Scott Anderson [InfluxData] | New & Upcoming Flux Features | InfluxDays 2022](https://cdn.slidesharecdn.com/ss_thumbnails/influxdays2022-fluxupdates-scott-221021210238-9d323cba-thumbnail.jpg?width=640&height=640&fit=bounds)


