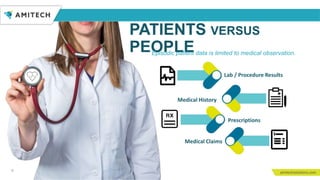
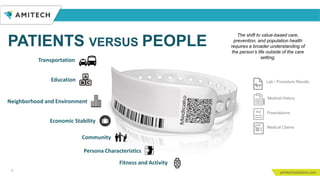
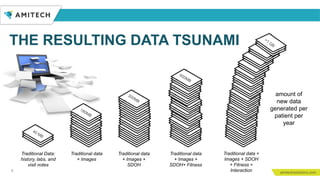
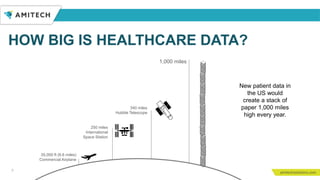
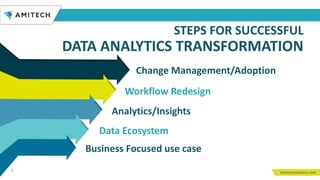
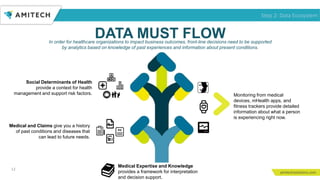
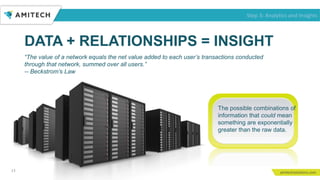
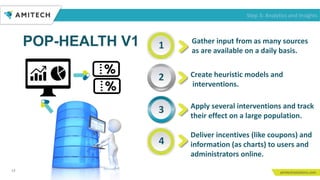
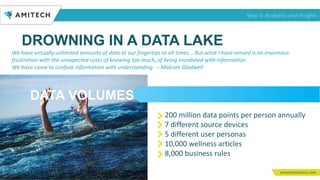
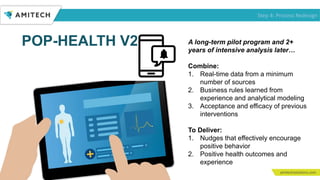
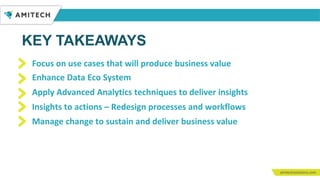
TAMING THE DATA TSUNAMI:
1
Tools, Tactics and New Trials for
Next-Gen Population Health
Engagement That Drives Change
Minimal Data Necessary
Value Of Streaming
Value Of Diverse Data
2
Triple
Aim
Reduce cost
of care
Improve
Population
Health
Improve
Patient
experience
TRIPLE AIM
IN HEALTHCARE
3
“America’s first priority must be to eliminate avoidable suffering, mortality, and waste in its uniquely costly health care system…
delaying payment reform is not an option.”
(Harvard Business Review, Oct 4, 2017)
“Kaiser Permanente CEO: Health Care Must Mean More Than
Coverage”
“Delivering better health for all means transforming an industry so when someone needs health care, it is delivered in a 21st
century way that combines technology with the personal touch.” - Bernard J. Tyson, Chairman and CEO of Kaiser Permanente
(TIME Magazine, Sep 22, 2017)
“UnitedHealth, Aetna, Anthem Near 50% Value-Based Care Spending”
“The nation’s largest health insurers say they are paying out almost half of their reimbursements via value-based care models
sweeping the U.S. medical system.”
(Forbes, Feb 2, 2017)
“U.S. Health Care Reform Can’t Wait for Quality Measures to Be
Perfect”
VALUE - THE IMPORTANCE AND URGENCY
PATIENTS VERSUS
PEOPLE
4
Episodic patient data is limited to medical observation.
Lab / Procedure Results
Medical History
Prescriptions
Medical Claims
$
5
The shift to value-based care,
prevention, and population health
requires a broader understanding of
the person’s life outside of the care
setting.
Economic Stability
Persona Characteristics
Fitness and Activity
Community
Education
Neighborhood and Environment
Transportation
Lab / Procedure Results
Medical History
Prescriptions
Medical Claims$
PATIENTS VERSUS PEOPLE
6
Traditional Data:
history, labs, and
visit notes
Traditional data
+ Images
Traditional data
+ Images +
SDOH+ Fitness
Traditional data +
Images + SDOH
+ Fitness +
Interaction
amount of
new data
generated per
patient per
year
Traditional data
+ Images +
SDOH
THE RESULTING DATA TSUNAMI
HOW BIG IS HEALTHCARE DATA?
7
New patient data in
the US would
create a stack of
paper 1,000 miles
high every year.
1,000 miles
250 miles
International
Space Station
340 miles
Hubble Telescope
35,000 ft (6.6 miles)
Commercial Airplane
...And…
Less than
3%
Of data produced worldwide will be analyzed by 2025
* Source: The Data Age 2025 White Paper by IDC
STEPS FOR SUCCESSFUL
DATA ANALYTICS TRANSFORMATION
9
Business Focused use case
Data Ecosystem
Analytics/Insights
Workflow Redesign
Change Management/Adoption
10
Step 1: Business-focused Use Case
• Align payment / reimbursement models by proactively
monitoring value-based performance metrics and enabling
informed contract negotiations
• Improve outcomes, experience and cost by openly sharing
provider performance metrics and creating a focus on
improvement
• Adjust service levels and align offerings to minimize the total
cost of care and maximize lifetime total value of patient /
member relationships
BUSINESS CASE EXAMPLES
11
The data lake approach allows healthcare organizations to capture and make data available for analysis
without necessarily knowing ahead of time how it will need to be used in the future.
Touch-it, take-it
Data should flow
Keep all the changes
Schema on demand
Monitor usage
Document uses
DATA LAKE PRINCIPLES
Step 2: Data Ecosystem
SWIMMING IN THE DATA LAKE
DATA MUST FLOW
12
In order for healthcare organizations to impact business outcomes, front-line decisions need to be supported
by analytics based on knowledge of past experiences and information about present conditions.
$
Medical and Claims give you a history
of past conditions and diseases that
can lead to future needs.
Social Determinants of Health
provide a context for health
management and support risk factors.
Medical Expertise and Knowledge
provides a framework for interpretation
and decision support.
Monitoring from medical
devices, mHealth apps, and
fitness trackers provide detailed
information about what a person
is experiencing right now.
Step 2: Data Ecosystem
DATA + RELATIONSHIPS = INSIGHT
13
“The value of a network equals the net value added to each user’s transactions conducted
through that network, summed over all users.”
-- Beckstrom’s Law
The possible combinations of
information that could mean
something are exponentially
greater than the raw data.
Step 3: Analytics and Insights
14
Apply several interventions and track
their effect on a large population.
Deliver incentives (like coupons) and
information (as charts) to users and
administrators online.
Gather input from as many sources
as are available on a daily basis.
Create heuristic models and
interventions.
1
2
3
4
Step 3: Analytics and Insights
POP-HEALTH V1
DROWNING IN A DATA LAKE
15
We have virtually unlimited amounts of data at our fingertips at all times... But what I have sensed is an enormous
frustration with the unexpected costs of knowing too much, of being inundated with information.
We have come to confuse information with understanding. -- Malcom Gladwell
200 million data points per person annually
7 different source devices
5 different user personas
10,000 wellness articles
8,000 business rules
DATA VOLUMES
Step 3: Analytics and Insights
POP-HEALTH V2
16
A long-term pilot program and 2+
years of intensive analysis later…
Combine:
1. Real-time data from a minimum
number of sources
2. Business rules learned from
experience and analytical modeling
3. Acceptance and efficacy of previous
interventions
To Deliver:
1. Nudges that effectively encourage
positive behavior
2. Positive health outcomes and
experience
Step 4: Process Redesign
ACHIEVING POSITIVE RESULTS
17
To achieve positive results with people, it’s more
important to know who that person is than to know the
minutia of every step they take.
Needed data (steps, activity, heartrate, sleep)
can come from most smart phones.
Has to be personal and contextual
Keep messages valuable and fresh
Apply user personas to tone and content
Personalize communication timing
INTERVENTION
Step 4: Process Redesign
18
•Share data insights to explain why we need to make the change
Communicate
“Why Change?”
•Get fingerprints of folks in the redesign of the new process so that they
have a sense of ownershipGet folks involved
•What gets measured gets done - Develop metrics to measure change
regularly (weekly, monthly, quarterly, annually)Develop metrics
•Ensure incentives are aligned to implement changeAlign Incentives
•Redesign process might need new skills – provide training and support
employees for them to be successful in implementing change
Provide Support
CHANGE MANAGEMENT/ADOPTION
Step 5: Change Management / Adoption
KEY TAKEAWAYS
Focus on use cases that will produce business value
Enhance Data Eco System
Apply Advanced Analytics techniques to deliver insights
Insights to actions – Redesign processes and workflows
Manage change to sustain and deliver business value
Amitech’s expertise lies at the intersection of big
data, predictive analytics and cloud-based,
enterprise solutions for the healthcare industry.
Visit us online at amitechsolutions.com to
learn more about how our work is changing the
landscape of healthcare and discuss how we can
help you solve your most complex data and IT
challenges.
INFORMED
HEALTHCARE
FOR BETTER
HEALTH.
Paul Boal
Vice President, Delivery
paul.boal@amitechsolutions.com
Amit Bhagat
CEO
amit.bhagat@amitechsolutions.com

Taming the Data Tsunami

  • 1.
    TAMING THE DATATSUNAMI: 1 Tools, Tactics and New Trials for Next-Gen Population Health Engagement That Drives Change Minimal Data Necessary Value Of Streaming Value Of Diverse Data
  • 2.
  • 3.
    3 “America’s first prioritymust be to eliminate avoidable suffering, mortality, and waste in its uniquely costly health care system… delaying payment reform is not an option.” (Harvard Business Review, Oct 4, 2017) “Kaiser Permanente CEO: Health Care Must Mean More Than Coverage” “Delivering better health for all means transforming an industry so when someone needs health care, it is delivered in a 21st century way that combines technology with the personal touch.” - Bernard J. Tyson, Chairman and CEO of Kaiser Permanente (TIME Magazine, Sep 22, 2017) “UnitedHealth, Aetna, Anthem Near 50% Value-Based Care Spending” “The nation’s largest health insurers say they are paying out almost half of their reimbursements via value-based care models sweeping the U.S. medical system.” (Forbes, Feb 2, 2017) “U.S. Health Care Reform Can’t Wait for Quality Measures to Be Perfect” VALUE - THE IMPORTANCE AND URGENCY
  • 4.
    PATIENTS VERSUS PEOPLE 4 Episodic patientdata is limited to medical observation. Lab / Procedure Results Medical History Prescriptions Medical Claims $
  • 5.
    5 The shift tovalue-based care, prevention, and population health requires a broader understanding of the person’s life outside of the care setting. Economic Stability Persona Characteristics Fitness and Activity Community Education Neighborhood and Environment Transportation Lab / Procedure Results Medical History Prescriptions Medical Claims$ PATIENTS VERSUS PEOPLE
  • 6.
    6 Traditional Data: history, labs,and visit notes Traditional data + Images Traditional data + Images + SDOH+ Fitness Traditional data + Images + SDOH + Fitness + Interaction amount of new data generated per patient per year Traditional data + Images + SDOH THE RESULTING DATA TSUNAMI
  • 7.
    HOW BIG ISHEALTHCARE DATA? 7 New patient data in the US would create a stack of paper 1,000 miles high every year. 1,000 miles 250 miles International Space Station 340 miles Hubble Telescope 35,000 ft (6.6 miles) Commercial Airplane
  • 8.
    ...And… Less than 3% Of dataproduced worldwide will be analyzed by 2025 * Source: The Data Age 2025 White Paper by IDC
  • 9.
    STEPS FOR SUCCESSFUL DATAANALYTICS TRANSFORMATION 9 Business Focused use case Data Ecosystem Analytics/Insights Workflow Redesign Change Management/Adoption
  • 10.
    10 Step 1: Business-focusedUse Case • Align payment / reimbursement models by proactively monitoring value-based performance metrics and enabling informed contract negotiations • Improve outcomes, experience and cost by openly sharing provider performance metrics and creating a focus on improvement • Adjust service levels and align offerings to minimize the total cost of care and maximize lifetime total value of patient / member relationships BUSINESS CASE EXAMPLES
  • 11.
    11 The data lakeapproach allows healthcare organizations to capture and make data available for analysis without necessarily knowing ahead of time how it will need to be used in the future. Touch-it, take-it Data should flow Keep all the changes Schema on demand Monitor usage Document uses DATA LAKE PRINCIPLES Step 2: Data Ecosystem SWIMMING IN THE DATA LAKE
  • 12.
    DATA MUST FLOW 12 Inorder for healthcare organizations to impact business outcomes, front-line decisions need to be supported by analytics based on knowledge of past experiences and information about present conditions. $ Medical and Claims give you a history of past conditions and diseases that can lead to future needs. Social Determinants of Health provide a context for health management and support risk factors. Medical Expertise and Knowledge provides a framework for interpretation and decision support. Monitoring from medical devices, mHealth apps, and fitness trackers provide detailed information about what a person is experiencing right now. Step 2: Data Ecosystem
  • 13.
    DATA + RELATIONSHIPS= INSIGHT 13 “The value of a network equals the net value added to each user’s transactions conducted through that network, summed over all users.” -- Beckstrom’s Law The possible combinations of information that could mean something are exponentially greater than the raw data. Step 3: Analytics and Insights
  • 14.
    14 Apply several interventionsand track their effect on a large population. Deliver incentives (like coupons) and information (as charts) to users and administrators online. Gather input from as many sources as are available on a daily basis. Create heuristic models and interventions. 1 2 3 4 Step 3: Analytics and Insights POP-HEALTH V1
  • 15.
    DROWNING IN ADATA LAKE 15 We have virtually unlimited amounts of data at our fingertips at all times... But what I have sensed is an enormous frustration with the unexpected costs of knowing too much, of being inundated with information. We have come to confuse information with understanding. -- Malcom Gladwell 200 million data points per person annually 7 different source devices 5 different user personas 10,000 wellness articles 8,000 business rules DATA VOLUMES Step 3: Analytics and Insights
  • 16.
    POP-HEALTH V2 16 A long-termpilot program and 2+ years of intensive analysis later… Combine: 1. Real-time data from a minimum number of sources 2. Business rules learned from experience and analytical modeling 3. Acceptance and efficacy of previous interventions To Deliver: 1. Nudges that effectively encourage positive behavior 2. Positive health outcomes and experience Step 4: Process Redesign
  • 17.
    ACHIEVING POSITIVE RESULTS 17 Toachieve positive results with people, it’s more important to know who that person is than to know the minutia of every step they take. Needed data (steps, activity, heartrate, sleep) can come from most smart phones. Has to be personal and contextual Keep messages valuable and fresh Apply user personas to tone and content Personalize communication timing INTERVENTION Step 4: Process Redesign
  • 18.
    18 •Share data insightsto explain why we need to make the change Communicate “Why Change?” •Get fingerprints of folks in the redesign of the new process so that they have a sense of ownershipGet folks involved •What gets measured gets done - Develop metrics to measure change regularly (weekly, monthly, quarterly, annually)Develop metrics •Ensure incentives are aligned to implement changeAlign Incentives •Redesign process might need new skills – provide training and support employees for them to be successful in implementing change Provide Support CHANGE MANAGEMENT/ADOPTION Step 5: Change Management / Adoption
  • 19.
    KEY TAKEAWAYS Focus onuse cases that will produce business value Enhance Data Eco System Apply Advanced Analytics techniques to deliver insights Insights to actions – Redesign processes and workflows Manage change to sustain and deliver business value
  • 20.
    Amitech’s expertise liesat the intersection of big data, predictive analytics and cloud-based, enterprise solutions for the healthcare industry. Visit us online at amitechsolutions.com to learn more about how our work is changing the landscape of healthcare and discuss how we can help you solve your most complex data and IT challenges. INFORMED HEALTHCARE FOR BETTER HEALTH. Paul Boal Vice President, Delivery paul.boal@amitechsolutions.com Amit Bhagat CEO amit.bhagat@amitechsolutions.com

Editor's Notes

  • #2 High Level Overview
  • #5 TODO: I think we need an introduction slide before this one that lays out the current state of the healthcare industry. Some headlines from CMS, big insurers, Kaiser Permanente, etc that talk about the importance and value of the shift from fee for service to value-based payment models. Can we grab some headlines for the first slide?
  • #6 But just having claims and clinical data are not enough. We need to look at people as a whole and social determinants of health so that we can look holistically at a patient and try to improve their health by helping in other area of their lives. A patient may have many other challenges in their lives that may inhibit successful treatment. E.g. Transportation – lack of transportation for low income population forces them to use higher cost ER visits vs physician visits. If they have to depend on friends or take public transportation they may be late or miss an appointment. Education is also a determinant of heath. During vistis doctors use medical terms in explaining the conditions to patients, and provide handouts that are written at a high school or college level englisg that may be hard to understand. How do you help them understand their condition, when and how to take medication etc. based on their education level. Better housing leads to better health. Income is important in terms of resources people may have to take of their health and stay healthy. E.g. access to healthy food, Affordability of medication and access to health care. Patients with low income have a lot of challenges with these. Engaging communities to work together in improving health of the community is very helpful Bringing psychographic and demographic data to the see the person as a whole helps us pinpoint factors that is impacting their health and develop programs to intervne them. On top of all this if we start to bring device data from consumer grade wearbles for fitness and activity or medical device data near realtime to help the people be more active and healthier. We are expecting all of this to translate into helping reduce cost of care. So as we start to look at bringing administrative clinical and social determinants data, we have a data tsunami.
  • #9 TODO: Could someone cross-validate my numbers with a couple of sources? Social determinants of health data, I just sort of took a guess at. Fitness stuff was based on a rough calculation. Maybe we need to turn them into absurdly big “whole US population” kinds of numbers. 500MB doesn’t sound like a very big number until you take it times 300 million people and get 150 PB per year. And that’s just the RAW data, not to mention anything about the copies that have to be made and different versions of things and…
  • #11 TODO: I think we need an introduction slide before this one that lays out the current state of the healthcare industry. Some headlines from CMS, big insurers, Kaiser Permanente, etc that talk about the importance and value of the shift from fee for service to value-based payment models. Can we grab some headlines for the first slide? Highlight some business cases
  • #12 I’ll probably spend several minutes on this slide talking about what each of those check-mark items mean.
  • #13 This is another several-minute slide.
  • #15 I think this slide / the bullets could use some sprucing up. They’re the right steps from version 1, but I’m not sure they stand out.
  • #16 These are calculated from actual BCA Maybe I need to draw it out to the whole population, too. About 10,000 people.
  • #17 I think we need to say more about the analytics that took us from v1 to v2 as well. It took significant study to understand what will and won’t have an impact on users. I don’t’ like the “brain” icon. What I’m trying to convey is that there’s “smarts” in there based on previous experience and the methodology for combing the right data in the right way. Maybe more of a “connection” icon rather than brain.
  • #19 This is the ”30,000 foot” slide you suggested and I think it would be most effective if we actually offered some real examples (even if they’re hypothetical) about how this information could improve outcomes and experiences and/or lower costs. The additional content or graphics here should either support those examples or the larger concept, in general (similar to slide 8).
  • #21 This is the slide that should remain visible during the QA.