This document provides information on Tagum City in the Philippines, including its location, population, climate, hazards, and climate change adaptation plan (LCCAP). Key points:
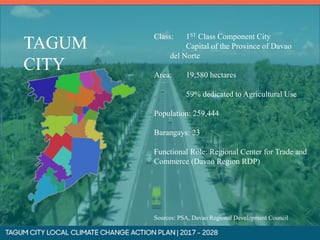
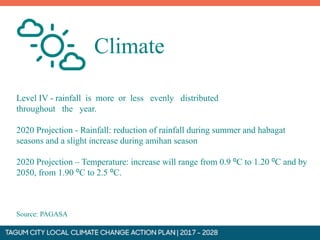
- Tagum City has a population of 259,444 and is located on the island of Mindanao. It has a tropical climate with rainfall evenly distributed throughout the year.
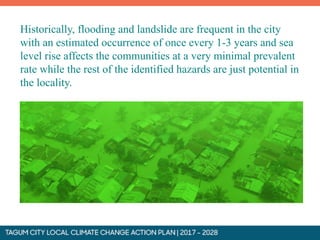
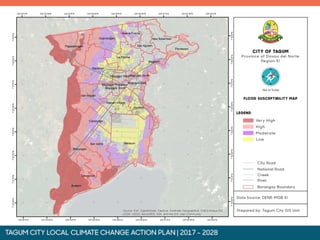
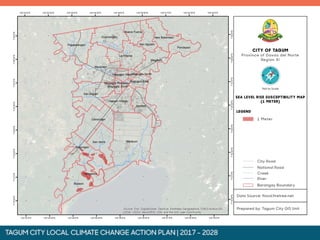
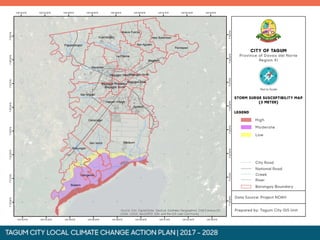
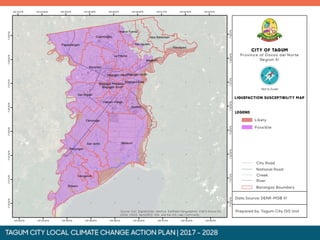
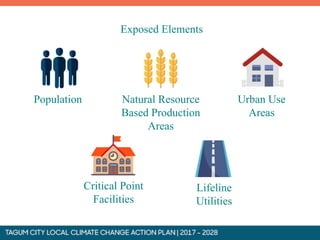
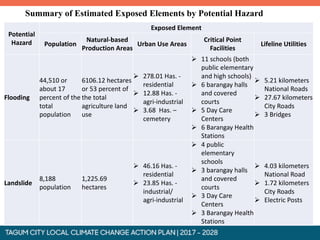
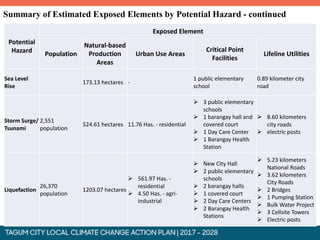
- Major hazards include flooding, landslides, sea level rise, storm surge, earthquakes, liquefaction, and potential tsunamis. These hazards threaten the city's population, agriculture, urban areas, facilities, and infrastructure.
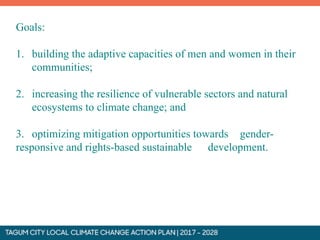
- The draft LCCAP aims to enhance climate resilience in Tagum City over 12 years by building adaptive capacity, increasing resilience