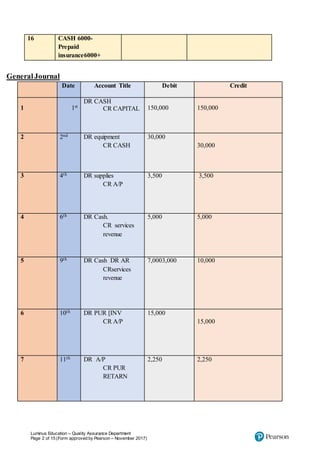
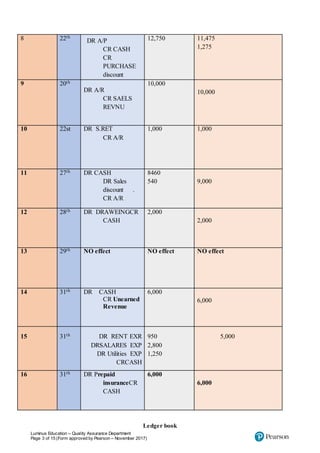
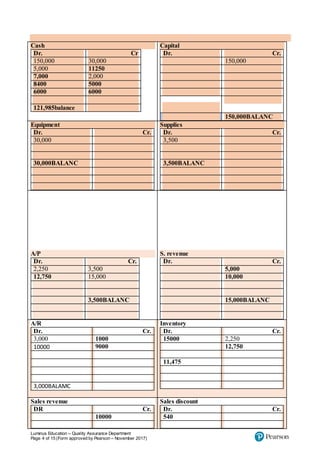
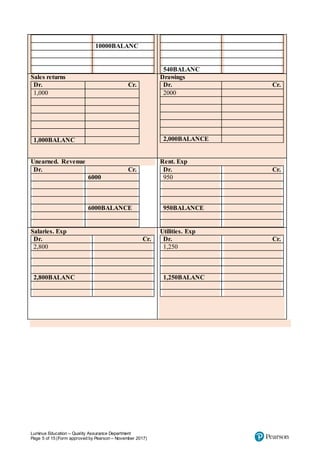
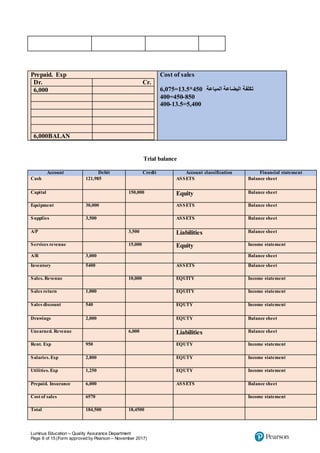
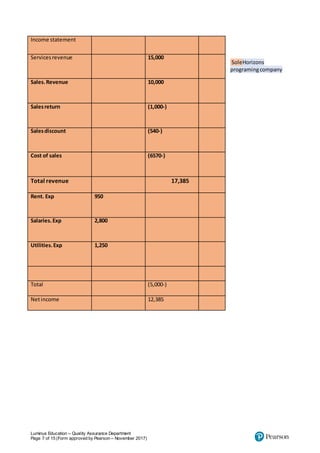
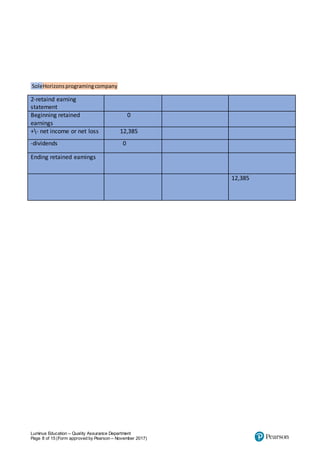
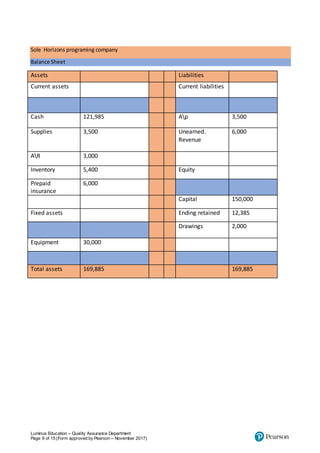
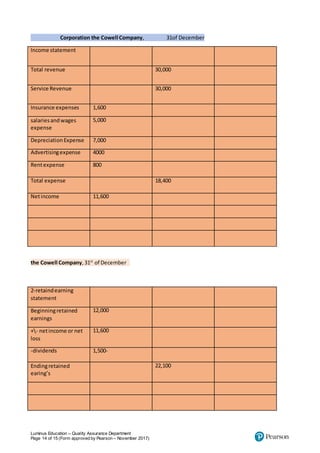
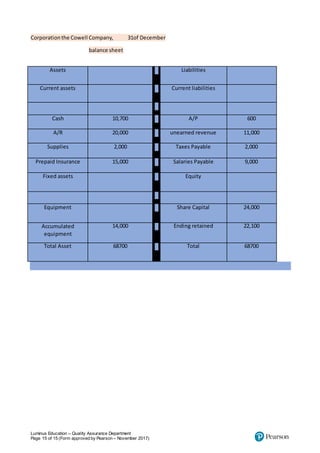
1) The document contains accounting journal entries, ledger accounts, trial balance, income statement, retained earnings statement, and balance sheet for Sole Horizons programming company.
2) It records transactions from January 1st to December 31st and prepares the annual financial statements for the company.
3) The income statement shows net income of $12,385, the retained earnings statement shows an ending balance of $12,385, and the balance sheet shows total assets of $169,885 equal to total liabilities and equity.
![Luminus Education – Quality Assurance Department
Page 1 of 15 (Form approved by Pearson – November 2017)
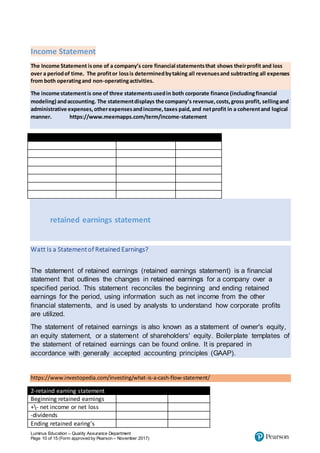
Tabular analysis
date
Assets = Liabilities + Equity
1 cash 150,000+ Capital 150,000+
2 equipment 30,000+
cash.30,000-
3 supplies3,500+ A/P 3,500+
4 Cash 5,000+ services revenue5,000+
5 Cash 7,000+
A/R3,000 +
services revenue10,000+
6 PUR [INV]15,000 + A/P 15,000 +
7 PUR return 2,250- A/P2,250-
8 CASH 11,475-
purchase
discount1,275-
A/P 12,750-
9 .AR 10000+ SELS REVNU 10,000+
10 A/R 1,000- S.RETUN 1,000-
11 CASH 8,460+
A/R 9,000-
Sales discount 540-
12 CASH 2000- DRAWEING2000-
13 NO EFFCT NO EFFCT NO EFFCT
14 CASH6000+ Unearned. Revenue
6000+
15 CASH 5000 - rent EXP 950-
SALARIS EXP 2,800 -
UTILITES EXP 1,250-](https://image.slidesharecdn.com/tabularanalysis-211031124432/85/Tabular-analysis-1-320.jpg)
![Luminus Education – Quality Assurance Department
Page 1 of 15 (Form approved by Pearson – November 2017)
Tabular analysis
date
Assets = Liabilities + Equity
1 cash 150,000+ Capital 150,000+
2 equipment 30,000+
cash.30,000-
3 supplies3,500+ A/P 3,500+
4 Cash 5,000+ services revenue5,000+
5 Cash 7,000+
A/R3,000 +
services revenue10,000+
6 PUR [INV]15,000 + A/P 15,000 +
7 PUR return 2,250- A/P2,250-
8 CASH 11,475-
purchase
discount1,275-
A/P 12,750-
9 .AR 10000+ SELS REVNU 10,000+
10 A/R 1,000- S.RETUN 1,000-
11 CASH 8,460+
A/R 9,000-
Sales discount 540-
12 CASH 2000- DRAWEING2000-
13 NO EFFCT NO EFFCT NO EFFCT
14 CASH6000+ Unearned. Revenue
6000+
15 CASH 5000 - rent EXP 950-
SALARIS EXP 2,800 -
UTILITES EXP 1,250-](https://image.slidesharecdn.com/tabularanalysis-211031124432/75/Tabular-analysis-1-2048.jpg)