11
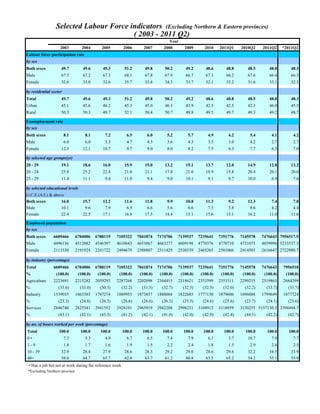
- 1. Selected Labour Force indicators (Excluding Northern & Eastern provinces)
( 2003 - 2011 Q2)
Year
2003 2004 2005 2006 2007 2008 2009 2010 2011Q1 2010Q2 2011Q2 *2011Q2
Labour force participation rate
by sex
Both sexes 49.7 49.6 49.3 51.2 49.8 50.2 49.2 48.6 48.8 48.5 48.8 48.3
Male 67.5 67.2 67.3 68.1 67.8 67.9 66.7 67.3 66.2 67.6 66.4 66.3
Female 32.6 33.0 32.6 35.7 33.4 34.3 33.7 32.1 33.2 31.6 33.1 32.3
by residential sector
Total 49.7 49.6 49.3 51.2 49.8 50.2 49.2 48.6 48.8 48.5 48.8 48.3
Urban 45.1 45.6 46.2 45.3 45.0 46.3 43.9 42.5 42.5 42.3 46.0 45.5
Rural 50.3 50.3 49.7 52.1 50.4 50.7 49.8 49.5 49.7 49.3 49.2 48.7
Unemployment rate
by sex
Both sexes 8.1 8.1 7.2 6.5 6.0 5.2 5.7 4.9 4.2 5.4 4.1 4.2
Male 6.0 6.0 5.3 4.7 4.3 3.6 4.3 3.5 3.0 4.2 2.7 2.7
Female 12.3 12.1 10.7 9.7 9.0 8.0 8.2 7.5 6.3 7.7 6.5 7.0
by selected age groups(yr)
20 - 29 19.1 18.6 16.0 15.9 15.0 13.2 15.1 13.7 12.0 14.9 12.8 13.2
20 - 24 25.8 25.2 22.4 21.0 21.1 17.8 21.0 18.9 15.8 20.4 20.1 20.0
25 - 29 11.4 11.1 9.4 11.0 9.4 9.0 10.1 9.1 8.7 10.0 6.9 7.6
by selected educational levels
G.C.E.(A/L) & above
Both sexes 16.0 15.7 12.2 11.6 11.8 9.9 10.8 11.3 9.2 12.3 7.4 7.8
Male 10.1 9.6 7.9 6.9 6.6 5.6 6.6 7.5 5.8 8.6 4.2 4.4
Female 22.4 22.5 17.1 16.8 17.5 14.4 15.1 15.6 13.1 16.2 11.0 11.6
Employed population
by sex
Both sexes 6609466 6704006 6788119 7105322 7041874 7174706 7139537 7235641 7351776 7145578 7476643 7956517.9
Male 4496136 4512082 4546397 4610643 4653067 4663277 4609198 4770376 4770710 4731075 4859996 5233537.3
Female 2113330 2191924 2241722 2494679 2388807 2511429 2530339 2465265 2581066 2414503 2616647 2722980.7
by industry (percentage)
Total 6609466 6704006 6788119 7105322 7041874 7174706 7139537 7235641 7351776 7145578 7476643 7956518
% (100.0) (100.0) (100.0) (100.0) (100.0) (100.0) (100.0) (100.0) (100.0) (100.0) (100.0) (100.0)
Agriculture 2223691 2215282 2059293 2287268 2202098 2344415 2318621 2353599 2353311 2299235 2519863 2684299
% (33.6) (33.0) (30.3) (32.2) (31.3) (32.7) (32.5) (32.5) (32.0) (32.2) (33.7) (33.7)
Industry 1539035 1663383 1787274 1889953 1873857 1888004 1822685 1777130 1879606 1696088 1799649 1877724
% (23.3) (24.8) (26.3) (26.6) (26.6) (26.3) (25.5) (24.6) (25.6) (23.7) (24.1) (23.6)
Services 2846740 2825341 2941552 2928101 2965919 2942288 2998231 3104913 3118859 3150255 3157130.3 3394494.7
% (43.1) (42.1) (43.3) (41.2) (42.1) (41.0) (42.0) (42.9) (42.4) (44.1) (42.2) (42.7)
by no. of hours worked per week (percentage)
Total 100.0 100.0 100.0 100.0 100.0 100.0 100.0 100.0 100.0 100.0 100.0 100.0
0• 7.3 5.3 4.9 6.7 6.5 7.4 7.9 6.1 3.7 10.7 7.9 7.7
1-9 1.8 1.7 1.6 1.9 1.5 2.2 2.4 1.8 1.5 2.9 2.6 2.5
10 - 39 32.9 28.4 27.9 28.6 28.3 29.2 29.0 28.6 29.6 32.2 34.5 33.9
40+ 58.0 64.7 65.7 62.8 63.7 61.2 60.8 63.5 65.2 54.2 55.1 55.9
• Has a job but not at work during the reference week
*Excluding Northern province