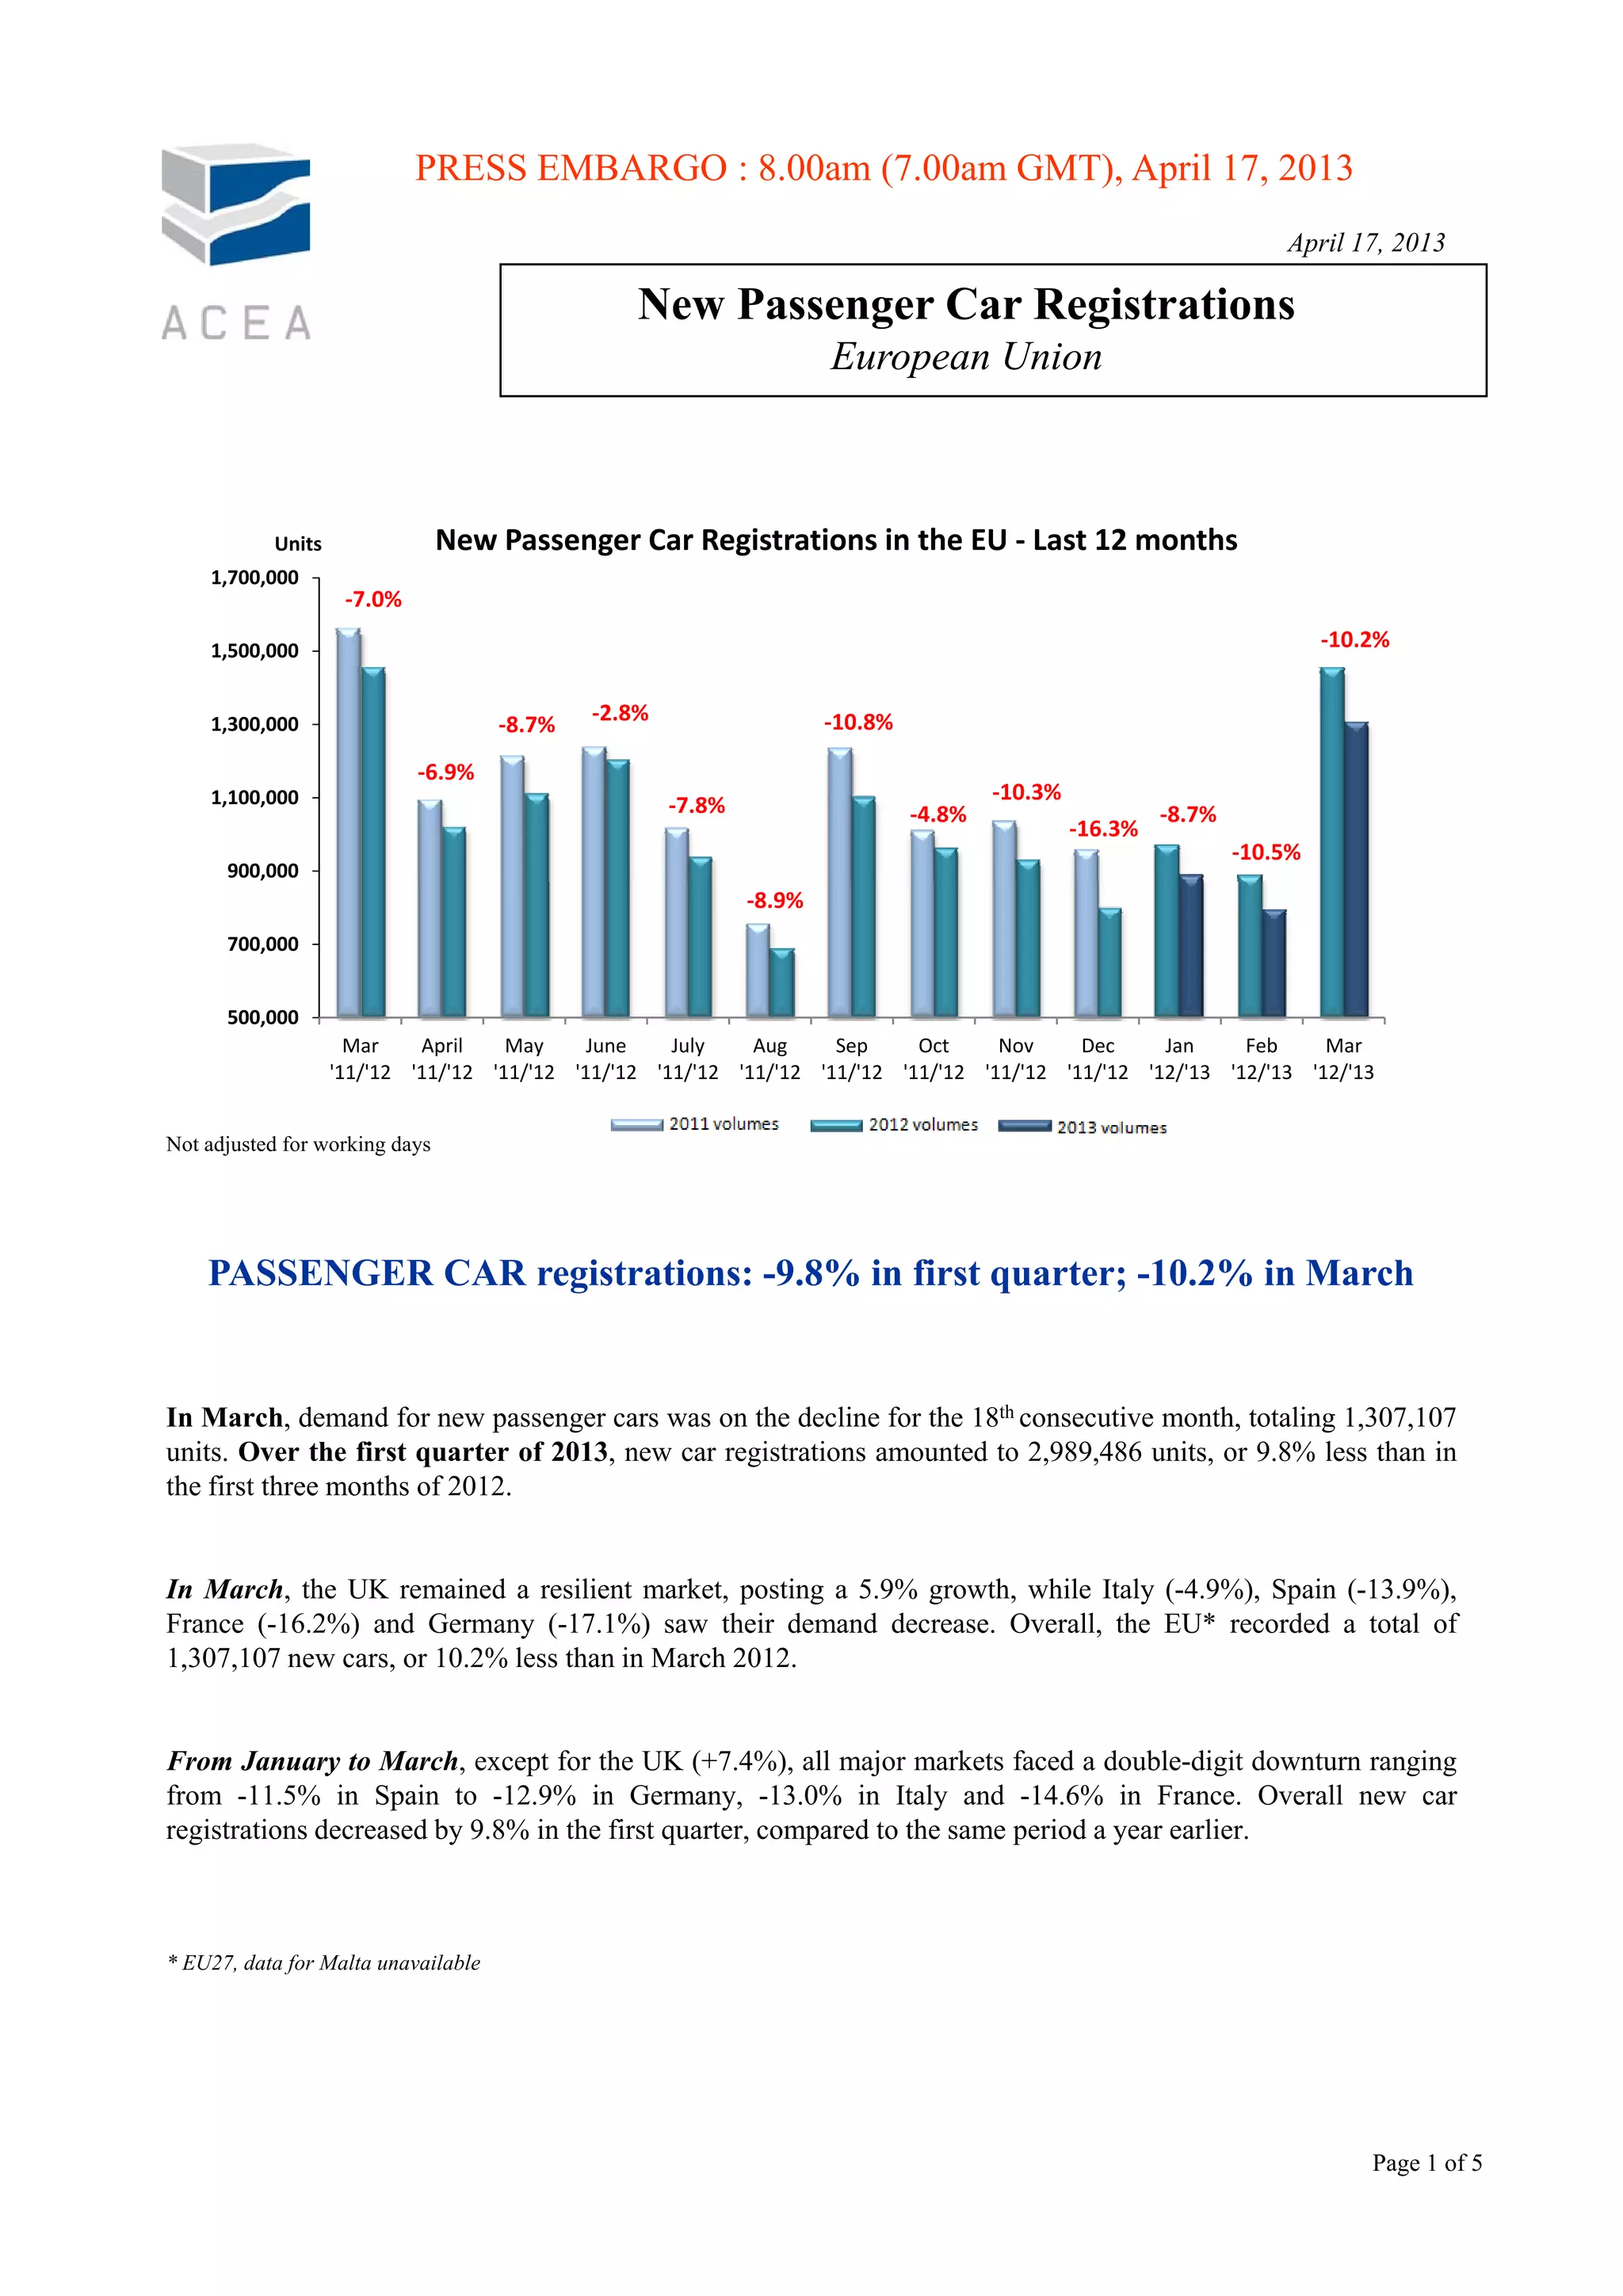
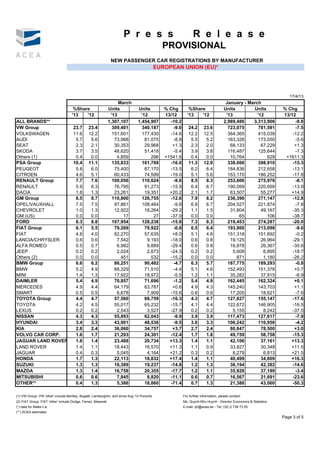
- New passenger car registrations in the EU declined 10.2% in March compared to March 2012, marking the 18th consecutive monthly decrease. For the first quarter of 2013, registrations were down 9.8% year-over-year.
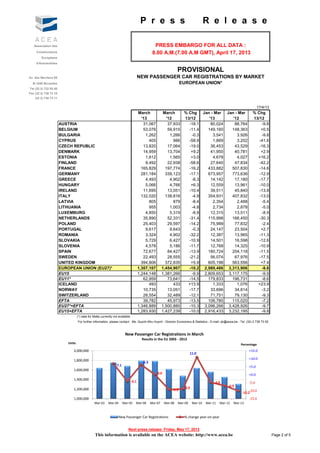
- Among major EU markets, the UK saw growth of 5.9% while Italy, Spain, France and Germany all saw double-digit declines ranging from 4.9% to 17.1%.
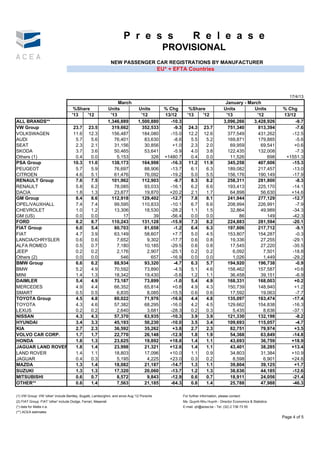
- For the top manufacturers, the VW Group saw a 9% decline in March, while PSA Group was down 16% and Renault fell 9.6% compared to the previous year.