Open Doors 2010 Fast Facts
•
0 likes•319 views

This summary of the 2010 IIE Open Doors Report sheds light on student mobility trends to/from the U.S.

Recommended
More Related Content
Similar to Open Doors 2010 Fast Facts
Similar to Open Doors 2010 Fast Facts (20)
More from Marty Bennett
More from Marty Bennett (20)
Open Doors 2010 Fast Facts
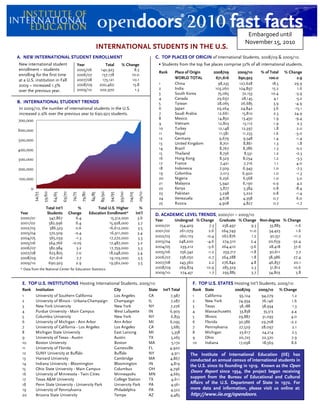
- 1. Embargoed until November 15, 2010 INTERNATIONAL STUDENTS IN THE U.S. A. NEW INTERNATIONAL STUDENT ENROLLMENT C. TOP PLACES OF ORIGIN of International Students, 2008/09 & 2009/10. New international student Year Total % Change • Students from the top five places comprise 52% of all international students. enrollment – students 2005/06 142,923 8.3 Rank Place of Origin 2008/09 2009/10 % of Total % Change enrolling for the first time 2006/07 157,178 10.0 2007/08 173,121 10.1 WORLD TOTAL 671,616 690,923 100.0 2.9 at a U.S. institution in Fall 2009 – increased 1.3% 2008/09 200,460 15.8 1 China 98,235 127,628 18.5 29.9 2009/10 202,970 1.3 2 India 103,260 104,897 15.2 1.6 over the previous year. 3 South Korea 75,065 72,153 10.4 -3.9 4 Canada 29,697 28,145 4.1 -5.2 B. INTERNATIONAL STUDENT TRENDS 5 Taiwan 28,065 26,685 3.9 -4.9 In 2009/10, the number of international students in the U.S. 6 Japan 29,264 24,842 3.6 -15.1 increased 2.9% over the previous year to 690,923 students. 7 Saudi Arabia 12,661 15,810 2.3 24.9 8 Mexico 14,850 13,450 1.9 -9.4 700,000 9 Vietnam 12,823 13,112 1.9 2.3 600,000 10 Turkey 12,148 12,397 1.8 2.0 11 Nepal 11,581 11,233 1.6 -3.0 500,000 12 Germany 9,679 9,548 1.4 -1.4 13 United Kingdom 8,701 8,861 1.3 1.8 400,000 14 Brazil 8,767 8,786 1.3 0.2 15 Thailand 8,736 8,531 1.2 -2.3 300,000 16 Hong Kong 8,329 8,034 1.2 -3.5 17 France 7,421 7,716 1.1 4.0 200,000 18 Indonesia 7,509 6,943 1.0 -7.5 19 Colombia 7,013 6,920 1.0 -1.3 100,000 20 Nigeria 6,256 6,568 1.0 5.0 21 Malaysia 5,942 6,190 0.9 4.2 0 22 Kenya 5,877 5,384 0.8 -8.4 23 Pakistan 5,298 5,222 0.8 -1.4 59/60 69/70 79/80 89/90 99/00 09/10 54/55 64/65 74/75 84/85 94/95 04/05 24 Venezuela 4,678 4,958 0.7 6.0 25 Russia 4,908 4,827 0.7 -1.7 Total Int'l % Total U.S. Higher % Year Students Change Education Enrollment* Int'l D. ACADEMIC LEVEL TRENDS, 2000/01 – 2009/10 2000/01 547,867 6.4 15,312,000 3.6 Year Undergrad % Change Graduate % Change Non-degree % Change 2001/02 582,996 6.4 15,928,000 3.7 2000/01 254,429 7.3 238,497 9.3 33,883 -1.6 2002/03 586,323 0.6 16,612,000 3.5 2001/02 261,079 2.6 264,749 11.0 34,423 1.6 2003/04 572,509 -2.4 16,911,000 3.4 2004/05 565,039 -1.3 17,272,000 3.3 2002/03 260,103 -0.4 267,876 1.2 30,551 -11.2 2005/06 564,766 -0.05 17,487,000 3.2 2003/04 248,200 -4.6 274,310 2.4 20,659 -32.4 2006/07 582,984 3.2 17,759,000 3.3 2004/05 239,212 -3.6 264,410 -3.6 28,418 37.6 2007/08 623,805 7.0 18,248,000 3.4 2005/06 236,342 -1.2 259,717 -1.8 30,611 7.7 2008/09 671,616 7.7 19,103,000 3.5 2006/07 238,050 0.7 264,288 1.8 38,986 27.4 2009/10 690,923 2.9 19,562,000 3.5 2007/08 243,360 2.2 276,842 4.8 46,837 20.1 * Data from the National Center for Education Statistics 2008/09 269,874 10.9 283,329 2.3 51,812 10.6 2009/10 274,431 1.7 293,885 3.7 54,803 5.8 E. TOP U.S. INSTITUTIONS Hosting International Students, 2009/10 F. TOP U.S. STATES Hosting Int’l Students, 2009/10 Rank Institution City State Int’l Total Rank State 2008/09 2009/10 % Change 1 University of Southern California Los Angeles CA 7,987 1 California 93,124 94,279 1.2 2 University of Illinois - Urbana-Champaign Champaign IL 7,287 2 New York 74,934 76,146 1.6 3 New York University New York NY 7,276 3 Texas 58,188 58,934 1.3 4 Purdue University - Main Campus West Lafayette IN 6,903 4 Massachusetts 33,838 35,313 4.4 5 Columbia University New York NY 6,833 5 Illinois 29,887 31,093 4.0 6 University of Michigan - Ann Arbor Ann Arbor MI 6,095 6 Florida 30,386 29,708 -2.2 7 University of California - Los Angeles Los Angeles CA 5,685 7 Pennsylvania 27,529 28,097 2.1 8 Michigan State University East Lansing MI 5,358 8 Michigan 23,617 24,214 2.5 9 University of Texas - Austin Austin TX 5,265 9 Ohio 20,725 22,370 7.9 10 Boston University Boston MA 5,172 10 Indiana 17,098 18,569 8.6 11 University of Florida Gainesville FL 4,920 12 SUNY University at Buffalo Buffalo NY 4,911 The Institute of International Education (IIE) has 13 Harvard University Cambridge MA 4,867 conducted an annual census of international students in 14 Indiana University - Bloomington Bloomington IN 4,819 the U.S. since its founding in 1919. Known as the Open 15 Ohio State University - Main Campus Columbus OH 4,796 Doors Report since 1954, the project began receiving 16 University of Minnesota - Twin Cities Minneapolis MN 4,665 17 Texas A&M University College Station TX 4,611 support from the Bureau of Educational and Cultural 18 Penn State University - University Park University Park PA 4,561 Affairs of the U.S. Department of State in 1972. For 19 University of Pennsylvania Philadelphia PA 4,522 more data and information, please visit us online at: 20 Arizona State University Tempe AZ 4,483 http://www.iie.org/opendoors.
- 2. INTERNATIONAL STUDENTS IN THE U.S. (CONTINUED) G. TOP FIELDS OF STUDY of International Students, 2008/09 & 2009/10 H. PRIMARY SOURCE OF FUNDING of International Students, 2008/09 & 2009/10 Field of Study 2008/09 2009/10 % of Total % Change % of % Business and Management 138,565 145,514 21.1% 5.0% Primary Source of Funds 2008/09 2009/10 Total Change Engineering 118,980 127,441 18.4% 7.1% Physical and Life Sciences 61,699 61,285 8.9% -0.7% Personal and Family 435,879 427,567 61.9% -1.9% Math and Computer Science 56,367 60,780 8.8% 7.8% U.S. College or University 152,457 166,369 24.1% 9.1% Social Sciences 57,348 59,865 8.7% 4.4% Home Gov’t or University 24,850 31,451 4.6% 26.6% Fine and Applied Arts 34,854 35,802 5.2% 2.7% U.S. Government 4,030 4,660 0.7% 15.6% Health Professions 35,064 32,111 4.6% -8.4% U.S. Private Sponsor 7,388 6,685 1.0% -9.5% Intensive English Language 28,524 26,075 3.8% -8.6% Foreign Private Sponsor 6,043 9,458 1.4% 56.5% Education 18,120 18,299 2.6% 1.0% International Organization 1,343 1,730 0.3% 28.8% Humanities 19,179 17,985 2.6% -6.2% Current Employment 33,581 36,201 5.2% 7.8% Agriculture 8,961 10,317 1.5% 15.1% Other Sources 6,045 6,802 0.8% 12.5% Other Fields of Study 73,011 76,743 11.1% 5.1% TOTAL 671,616 690,923 100.0 2.9 Undeclared 20,944 18,707 2.7% -10.7% U.S. STUDENTS STUDYING ABROAD I. U.S. STUDY ABROAD TRENDS J. LEADING DESTINATIONS, 2007/08 & 2008/09 260,327 U.S. students studied abroad for academic credit in 2008/09. Non-traditional destinations are increasing in popularity – 14 of the top U.S. student participation in study abroad has more than doubled over the 25 destinations are outside Europe and 19 out of 25 are destinations past decade. where English is not a primary language. 300,000 Rank Destination 2007/08 2008/09 % of Total % Change TOTAL 262,416 260,327 100.0 -0.8% 250,000 1 United Kingdom 33,333 31,342 12.0 -6.0 2 Italy 30,670 27,362 10.5 -10.8 200,000 3 Spain 25,212 24,169 9.3 -4.1 4 France 17,336 16,910 6.5 -2.5 5 China 13,165 13,674 5.3 3.9 150,000 6 Australia 11,042 11,140 4.3 0.9 7 Germany 8,253 8,330 3.2 0.9 100,000 8 Mexico 9,928 7,320 2.8 -26.3 9 Ireland 6,881 6,858 2.6 -0.3 10 Costa Rica 6,096 6,363 2.4 4.4 50,000 11 Japan 5,710 5,784 2.2 1.3 12 Argentina 4,109 4,705 1.8 14.5 13 South Africa 3,700 4,160 1.6 12.4 0 14 Czech Republic 3,417 3,664 1.4 7.2 97/98 07/08 91/92 01/02 89/90 99/00 00/01 96/97 06/07 95/96 98/99 05/06 08/09 93/94 03/04 02/03 94/95 04/05 15 Greece 3,847 3,616 1.4 -6.0 16 Chile 2,739 3,503 1.3 27.9 17 Ecuador 2,814 2,859 1.1 1.6 18 Austria 3,356 2,836 1.1 -15.5 K. FIELDS OF STUDY of U.S. Study Abroad Students, 2007/08 & 2008/09 19 Brazil 2,723 2,777 1.1 2.0 Field of Study 2007/08 2008/09 % 20 New Zealand 2,629 2,769 1.1 5.3 Total % Total % Change 21 India 3,146 2,690 1.0 -14.5 Social Sciences 56,419 21.5 53,888 20.7 -4.5 22 Netherlands 2,038 2,318 0.9 13.7 Business/Management 53,008 20.2 50,764 19.5 -4.2 23 Denmark 1,855 2,244 0.9 21.0 Humanities 34,901 13.3 32,020 12.3 -8.3 24 Peru 1,638 2,163 0.8 32.1 Fine or Applied Arts 22,043 8.4 19,004 7.3 -13.8 25 South Korea 1,597 2,062 0.8 29.1 Physical/Life Sciences 18,894 7.2 19,004 7.3 0.6 Foreign Languages 16,270 6.2 15,880 6.1 -2.4 Health Professions 11,809 4.5 11,715 4.5 -0.8 L. HOST REGIONS of U.S. Study Abroad Students, 2007/08 & 2008/09 Education 10,759 4.1 10,413 4.0 -3.2 2007/08 2008/09 % Engineering 8,135 3.1 8,330 3.2 2.4 Host Region* Total % Total % Change Math/Computer Science 4,199 1.6 4,165 1.6 -0.8 Africa 11,844 4.5 13,681 5.3 15.5 Agriculture 3,149 1.2 2,864 1.1 -9.1 Asia 29,125 11.1 29,737 11.4 2.1 Undeclared 8,660 3.3 9,111 3.5 5.2 Europe 147,676 56.3 141,955 54.5 -3.9 Other Fields of Study 14,170 5.4 23,169 8.9 63.5 Latin America 40,181 15.3 40,044 15.4 -0.3 Total 262,416 100.0 260,327 100.0 -0.8 Middle East 3,362 1.3 3,670 1.4 9.2 North America 1,159 0.4 1,355 0.5 16.9 M. DURATION of Study Abroad, 2007/08 & 2008/09 Oceania 14,028 5.3 14,261 5.5 1.7 Duration 2007/08 2008/09 Antarctica 78 0.0 60 0.0 -23.1 Multiple 14,963 5.7 15,564 6.0 4.0 Short-term (summer, January term, or eight weeks or less during the academic year) 56.3% 54.6% Total 262,416 100.0 260,327 100.0 -0.8 Mid-length (one or two quarters or one semester) 39.5% 41.1% * Cyprus and Turkey are included in Europe; Mexico is included in Latin America Long-term (academic or calendar year) 4.2% 4.3%