Recommended

Recommended
More Related Content
Similar to Swenson2010
Similar to Swenson2010 (20)
Recently uploaded
Recently uploaded (20)
Swenson2010
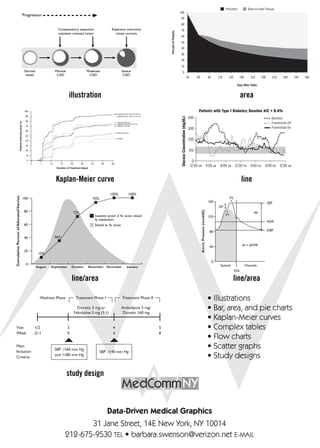
- 1. Persistent Back on Index Therapy 100 Progression 90 80 Compensatory expansion Expansion overcome: 70 Percent of Patients maintains constant lumen lumen narrows 60 50 40 30 20 10 Normal Minimal Moderate Severe 0 vessel CAD CAD CAD 30 60 90 120 150 180 210 240 270 300 330 360 Days After Index illustration area 100 Valsartan/HCTZ 320/12.5-25 mg 90 Valsartan/HCTZ 160/12.5-25 mg 80 Patients Achieving Goal (%) Valsartan 320 mg Valsartan/HCTZ 80/12.5 mg 70 Valsartan 160 mg 60 Valsartan 80 mg 50 Placebo 40 30 20 10 0 0 7 14 21 28 35 42 49 56 Duration of Treatment (days) Kaplan-Meier curve line 100% 100% Cumulative Percent of Allocated Vaccine 100 93% P2 160 SBP AP 80 Aortic Pressure (mmHG) 72% PP Cumulative percent of flu vaccine released 120 P1 by manufacturers MAP 60 Demand for flu vaccine 80 DBP 40 36% 40 AI = AP/PP 20 10% 0 0 Systole Diastole August September October November December January DN line/area line/area Washout Phase Treatment Phase I Treatment Phase II • Illustrations Diuretic 5 mg or Felodipine 5 mg (1:1) Amlodipine 5 mg/ Diuretic 160 mg • Bar, area, and pie charts • Kaplan-Meier curves Visit 1/2 3 4 5 • Complex tables Week -2/-1 0 4 8 • Flow charts Main SBP ≥160 mm Hg • Scatter graphs Inclusion SBP ≥140 mm Hg Criteria and <180 mm Hg • Study designs study design Data-Driven Medical Graphics 31 Jane Street, 14E New York, NY 10014 212-675-9530 TEL • barbara.swenson@verizon.net E-MAIL