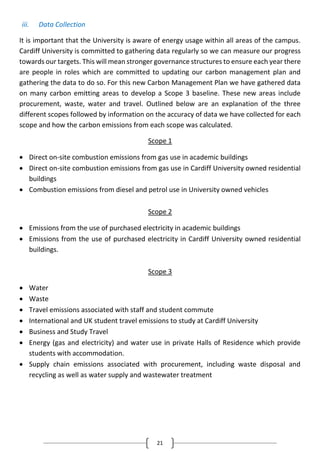
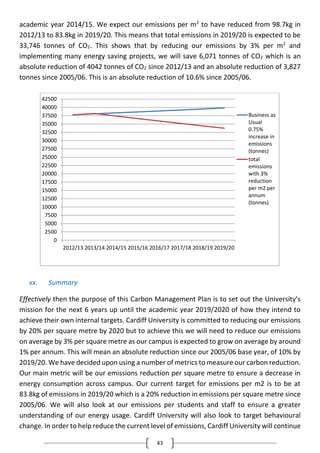
The document discusses sustainability and its importance. It defines sustainability as meeting present needs without compromising future generations' ability to meet their own needs. The document notes that climate change poses serious threats to achieving development goals by reversing development gains. Tackling climate change is important for justice as developing nations contribute very little to emissions but experience most of the impacts. The document outlines several impacts of climate change, such as declining agricultural productivity, increased water stress, rising sea levels, and health risks.


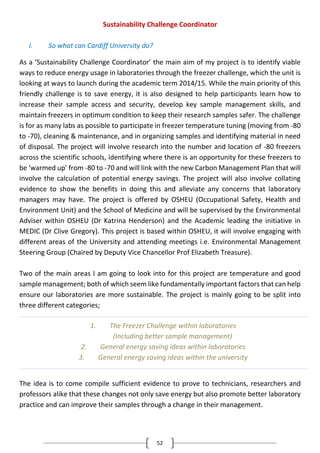
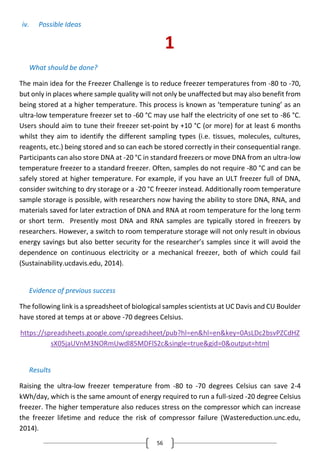
![35
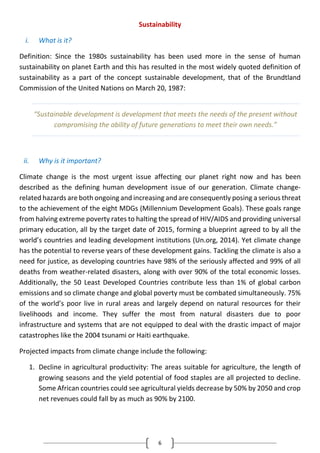
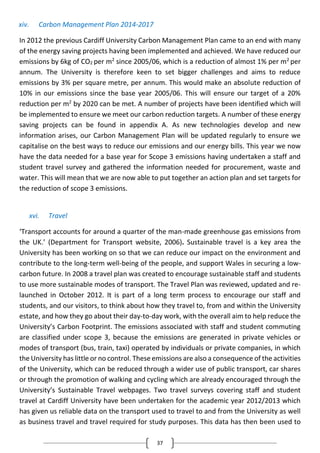
The first Higher Education Institution in Wales to achieve the Carbon Trust Standard,
achieved in 2010;
Commitment to building BREAAM ‘Excellent’ buildings. All future builds will meet this
high environmental standard with two buildings on our estate that already meet this
standard.
Achievement and continuation of ISO 14001 certification for the University as a whole;
Multiple awards and nominations for the University’s national leadership in
environmental performance and innovation
[http://www.cardiff.ac.uk/sustainability/ourperformance/awards/index.html];
Implementation of a programme of nationally-leading sustainability initiatives by the
University’s Information Services Directorate;
Currently undertaking Green Impact award throughout departments
Currently running Student Switch Off, Snap It Off & Blackout Project
Sustainability Week
Go Green Week
The Vice Chancellor signed the Green Education Declaration which has committed to
working towards sector-wide carbon reduction of 43% by 2020 on 2005 emission levels
as well as committing to integrating education for sustainable development into the
curricula, recognising the key role we play in educating those who will create a
sustainable low carbon economy and society.
Cardiff University has a number of leading academic research institutes which
conducts energy research in Wales to help deliver a low carbon future. More
information on the University’s leading research programme into carbon efficiency and
environmental sustainability can be found online.
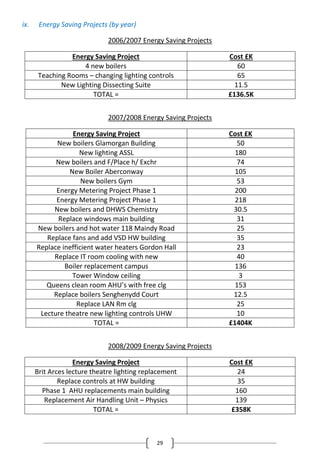
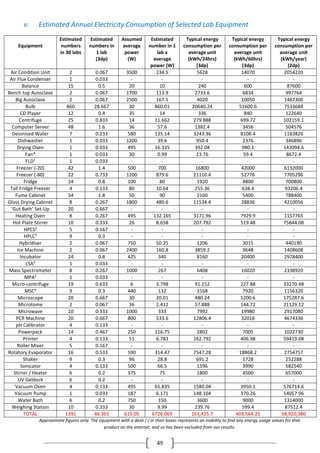
xiii. Financial Spend on Energy Saving Projects
Since the completion of the last Carbon Management Plan, many energy saving projects have
been implemented around the University and have required funding. Many energy saving
projects have been implemented alongside the replacement of old appliances with more
energy efficient technologies when refurbishing buildings and within new builds, which have
not been accounted for as these are part of the University Maintenance and Estates plan.
Energy Saving Projects have been funded from a combination of the Estates maintenance
budget and grants from HEFCW. Campus Services have also implemented many energy
saving initiatives within University owned Halls of Residences which have been implemented
via the Residences Planned Maintenance Programme. The table below shows the total
spends on energy saving projects annually.](https://image.slidesharecdn.com/894e6791-cc1d-4d05-9889-0b5fb992310e-160623103448/85/Sustainability-Project-35-320.jpg)


![69
References
Carbon Management Plan Task and Finish Group, (2013). Cardiff University Carbon
Management Plan Short term Carbon Reduction targets 2013-2016. Cardiff.
David R. Jones, (2012) "Looking through the “greenwashing glass cage” of the green league
table towards the sustainability challenge for UK universities", Journal of Organizational
Change Management, Vol. 25 Iss: 4, pp.630 – 647
Dobson, A.N.H., Quilley, S., Young, W. (2010), "Sustainability as competitive advantage in
higher education in the UK", International Journal of Environment and Sustainable
Development, Vol. 9 No.4, pp.330-48.
Freshwater biodiversity in Indo-Burma under threat. 2012. thefreshwaterblog, [blog]
November 13th, Available at: http://biofreshblog.com/2012/11/13/freshwater-biodiversity-
in-indo-burma/ [Accessed: 15 Jul 2014].
Globalcitizen.org. 2012. Introduction to the importance of environmental sustainability.
[online] Available at: http://www.globalcitizen.org/Content/Content.aspx?id=867a1778-
9011-442d-a9d6-a4970593ca23 [Accessed: 15 Jul 2014].
Green.harvard.edu. 2014. Host an Annual Freezer Cleanout. [online] Available at:
http://green.harvard.edu/tools-resources/host-annual-freezer-cleanout [Accessed: 8 Jul
2014].
Hopkinson, L. et al, 2011. Energy Consumption of University Laboratories: Detailed Results
from S-Lab Audits. [report] Lab-CURE: Chemicals, Utilities, Resources and Environment in
Laboratories, pp. 4-47.
Hopkinson, L. and James, P. 2011. Saving Money Through Sustainable Procurement of
Laboratory Equipment. [report] pp. 2-12.
Kaplan, S. (2000), "Human nature and environmentally responsible behaviour", Journal of
Social Issues, Vol. 56 pp.491-508.
Leventhal, H., Watts, J.C., Pagano, F. (1967), "Effects of fear and instructions on how to cope
with danger", Journal of Personality and Social Psychology, Vol. 6 No.3, pp.313-21.](https://image.slidesharecdn.com/894e6791-cc1d-4d05-9889-0b5fb992310e-160623103448/85/Sustainability-Project-69-320.jpg)
![70
News.stanford.edu. 2014. Freezer Retirement Program: Out with the cold, in with the new.
[online] Available at: http://news.stanford.edu/news/2010/june/freezer-retirement-
program-060210.html [Accessed: 8 Jul 2014].
Newton, T.J. (2002), "Creating the new ecological order? Elias and actor network theory",
Academy of Management Review, Vol. 27 pp.523-40.
People & Planet (2011), "Green League 2011", People and Planet, Oxford, available at:
http://peopleandplanet.org/dl/gogreen/greenleague2010 (accessed 8 February 2011).
Roszak, T. (1992), The Voice of the Earth, Simon & Schuster, New York, NY.
Sustainability.ucdavis.edu. 2014. Sustainable 2nd Century | UC Davis: Store Smart. [online]
Available at: http://sustainability.ucdavis.edu/action/conserve_energy/store_smart.html
[Accessed: 7 Jul 2014].
Un.org. 2014. United Nations Millennium Development Goals. [online] Available at:
http://www.un.org/millenniumgoals/bkgd.shtml [Accessed: 11 Jul 2014].
Wastereduction.unc.edu. 2014. Office of Waste Reduction and Recycling > Get Involved! >
Green Labs > Freezer Challenge. [online] Available at:
http://www.wastereduction.unc.edu/GetInvolved/GreenLabs/FreezerChallenge [Accessed:
7 Jul 2014].
The World Commission on Environment and Development’s (the Brundtland Commission)
report Our Common Future (Oxford: Oxford University Press, 1987).](https://image.slidesharecdn.com/894e6791-cc1d-4d05-9889-0b5fb992310e-160623103448/85/Sustainability-Project-70-320.jpg)