2014 a method for evaluation of water flooding performance in fractured res...
Summer Project Poster - 802116
1. 1. INTRODUCTION
The technique known as Hydraulic Fracturing has been used
in shale gas extraction since 1947 and involves the injection at
high pressure of water, proppants and chemicals into horizontal
wells allowing fractures to originate in the rock layers from
which the gas will flow. Granular material are known as
rounded solid and strong materials as their function is to
maintain these fissures opened by creating a thin layer of
particles.
However, the gas extracted by this technique usually has
some proppants with it committing the pumping system and the
productivity of the process.
This paper study the influence of hydrodynamic forces in the
withdraw process of granular materials and the behavior of
particles velocity during the time of operation and along the
glass cell used in the experiments. It is expected to partially
reproduce the conditions proppants are subject to in hydraulic
fracturing. Particle Image Velocimetry (PIV) technique was
used to calculate velocity fields and MATLAB was used for
data analysis.
Difference between (left) fissure containing spherical proppants and
consequently better flow of gas and (right) fissure containing random
sizes of proppants and therefore having problems regarding the flow of
gas. (Source: Caderange.canalblog.com,. (2014). Connaissez vous les proppants? -
http://caderange.canalblog.com/archives/2013/05/01/26915936.html)
2. METHODOLOGY AND RESULTS
Water and glass beads of <100µm diameter were used to fill a
glass cell as illustrated. They were then mixed to magnetite to
facilitate the PIV analysis (black grains to create contrast on
glass beads), which allowed us to found that the particle
velocity profile fits a gaussian model during withdraw.
Therefore, the curve parameters were analysed in function of
time and position on the glass cell giving interesting results as
shown on the next pictures and as said on conclusion.
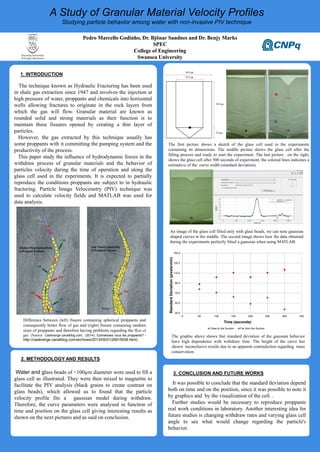
The graphic above shows that standard deviation of the gaussian behavior
have high dependence with withdraw time. The height of the curve has
shown inconclusive results due to an apparent contradiction regarding mass
conservation.
The first picture shows a sketch of the glass cell used in the experiments
containing its dimensions. The middle picture shows the glass cell after the
filling process and ready to start the experiment. The last picture , on the right,
shows the glass cell after 500 seconds of experiment, the colored lines indicates a
estimative of the curve width (standard deviation).
Pedro Marcello Godinho, Dr. Bjönar Sandnes and Dr. Benjy Marks
SPEC
College of Engineering
Swansea University
A Study of Granular Material Velocity Profiles
Studying particle behavior among water with non-invasive PIV technique
3. CONCLUSION AND FUTURE WORKS
It was possible to conclude that the standard deviation depend
both on time and on the position, since it was possible to note it
by graphics and by the visualization of the cell. .
Further studies would be necessary to reproduce proppants
real work conditions in laboratory. Another interesting idea for
future studies is changing withdraw rates and varying glass cell
angle to see what would change regarding the particle's
behavior.
30.0
50.0
70.0
90.0
110.0
130.0
150.0
0 50 100 150 200 250 300 350
StandardDeviation(pixels/min)
Time (seconds)
Close to the Suction Far from the Suction
An image of the glass cell filled only with glass beads, we can note gaussian
shaped curves in the middle. The second image shows how the data obtained
during the experiments perfectly fitted a gaussian when using MATLAB.