1. Experimental Apparatus
Erik Napoles, Ruiwen Lin, TaeEun Kim
Department of Chemical Engineering, California State University Long Beach
Objectives
• Determine the minimum fluidized velocity, VOM, by graphical method.
• Compare the theoretical VOM and experimental value.
• Determine the effect of particle size on the VOM.
Conclusions
There are obvious discrepancies between our experimental and our calculated
theoretical values.. This could be because of our bed height for each trial; we had a
height range between 5 and 7.45cm. It’s possible that we had an insufficient volume of
sand in the unit for the minimum fluidization velocity equation to work properly.
Another possible cause of our sizable error is the inherent inaccuracy of the fluidization
bed unit. It was noted during data collection that the velocity marker would constantly
move; it would either float up or down despite many attempts to stabilize it. This would
lead to our velocity data being inaccurate and is thus a very probable cause of error.
A final potential cause for error is our inability to choose a definite particle size. It
could be that despite our sieving the sand that other particles were trapped along those
of our expected size range.
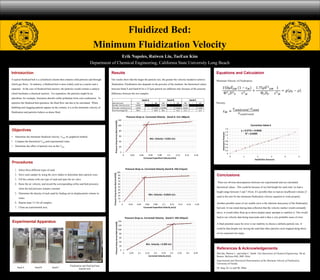
Results
Our results show that the larger the particle size, the greater the velocity needed to achieve
fluidization. Fluidization also depends on the porosity of the medium: the theoretical values
between Sand A and Sand B for a 212μm particle are different only because of the porosity
difference between the two samples.
Procedures
1. Select three different types of sand.
2. Sieve each sample by using the sieve shaker to determine their particle sizes.
3. Fill the column with one type of sand and open the air valve.
4. Raise the air velocity, and record the corresponding orifice and bed pressures
when the bed pressure remains constant.
5. Determine the density of each sand by finding out its displacement volume in
water.
6. Repeat steps 3-5 for all samples.
7. Clean up experimental area.
Equations and Calculation
Minimum Velocity of Fluidization:
150𝜇 𝑉𝑂𝑀
Ф2
𝑠 𝐷2
𝑃
1 − 𝜖 𝑀
𝜀3
𝑀
+
1.75𝜌 𝑉2
𝑂𝑀
Ф 𝑠 𝐷 𝑃
1
𝜀3
𝑀
= 𝑔 𝜌 𝑃 − 𝜌
Porosity:
𝜀 𝑀 =
𝑉 𝑠𝑎𝑛𝑑+𝑣𝑜𝑖𝑑−𝑉 𝑠𝑎𝑛𝑑
𝑉 𝑠𝑎𝑛𝑑+𝑣𝑜𝑖𝑑
References & Acknowledgements
McCabe, Warren L., and Julian C. Smith. Unit Operations of Chemical Engineering. 7th ed.
Boston: McGraw-Hill, 2005. Print.
Experimental and Theoretical Determination of the Minimum Velocity of Fluidization,
University of Florida.
Dr. Jang, Dr. Lo and Mr. Mihn
Introduction
A typical fluidized bed is a cylindrical column that contains solid particles and through
which gas flows. In industry, a fluidized bed is most widely used as a reactor and a
separator. In the case of fluidized bed reactors, the particles would contain a catalyst
which facilitates a chemical reaction. For separation, the particles might be an
adsorbent: for example, limestone absorbs sulfur pollutants from coal combustion. To
optimize the fluidized bed operation, the fluid flow rate has to be calculated. When
bubbling and slugging patterns appear on the column, it is at the minimum velocity of
fluidization and particles behave as dense fluid.
Fluidized Bed:
Minimum Fluidization Velocity
Sand A Sand B Sand C
Fluidization and fluid bed heat
transfer unit
0
20
40
60
80
100
120
0 0.02 0.04 0.06 0.08 0.1 0.12 0.14 0.16
PressureDropAcrossBed(mmH20)
Corrected Superficial Velocity (m/s)
Pressure Drop vs. Corrected Velocity (Sand A: 212-180μm)
Min. Velocity = 0.052 m/s
0
10
20
30
40
50
60
70
80
90
100
0 0.02 0.04 0.06 0.08 0.1 0.12 0.14 0.16 0.18
PressureDropAcrossBed(mmH20)
Corrected Superficial Velocity (m/s)
Pressure Drop vs. Corrected Velocity (Sand B: 250-212μm)
Min. Velocity = 0.0525 m/s
0
20
40
60
80
100
120
140
0 0.05 0.1 0.15 0.2 0.25 0.3 0.35 0.4 0.45
PressureDropAcrossBed(mmH20)
Corrected Velocity (m/s)
Pressure Drop vs. Corrected Velocity (Sand C: 595-425μm)
Min. Velocity = 0.309 m/s
Sand Size (μm) 212 ~ 180 250 ~ 212 595 ~ 425
Exp Min. Velocity (m/s) 0.0520 0.0525 0.3090
Theo Min. Velocity (m/s) 0.2576 ~ 0.1919 0.02708 ~ 0.01953 0.6522 ~ 0.4169
Error Percentage (%) 395.3 ~ 269.0 48.4 ~ 62.8 111.1 ~ 34.9
Sand B Sand CSand A
y = 0.277x + 0.0566
R² = 0.9939
0
0.2
0.4
0.6
0.8
1
1.2
1.4
1.6
0 1 2 3 4 5
VolumetricFlowrate
Sqrt(Orifice Pressure)
Correction Value k