Subsurface properties and_early_activity_of_comet_67_churyumov_gerasimenko
•
1 like•875 views

The document summarizes findings from the Microwave Instrument on the Rosetta Orbiter (MIRO) regarding the subsurface properties and early activity of comet 67P/Churyumov-Gerasimenko. Key points: - MIRO detected water vapor emissions from the comet beginning in early June 2014 and measured the total water production rate, which varied from 0.3 kg/s to 1.2 kg/s between June and August. - Water outgassing displayed periodic variations correlated with the comet's 12.4-hour rotation period and seemed to originate primarily from the comet's "neck" region. - Subsurface temperatures measured by MIRO showed seasonal and diurnal variations, indicating radiation

Recommended
Recommended
More Related Content
What's hot
What's hot (20)
Viewers also liked
Viewers also liked (9)
Similar to Subsurface properties and_early_activity_of_comet_67_churyumov_gerasimenko
Similar to Subsurface properties and_early_activity_of_comet_67_churyumov_gerasimenko (20)
More from Sérgio Sacani
More from Sérgio Sacani (20)
Recently uploaded
Recently uploaded (20)
Subsurface properties and_early_activity_of_comet_67_churyumov_gerasimenko
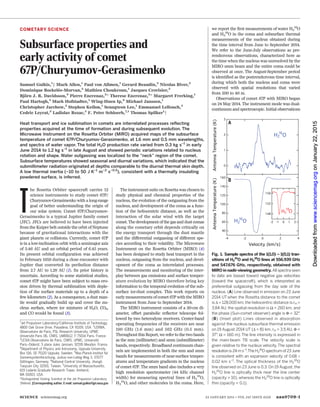
- 1. COMETARY SCIENCE Subsurface properties and early activity of comet 67P/Churyumov-Gerasimenko Samuel Gulkis,1 ‡ Mark Allen,1 Paul von Allmen,1 Gerard Beaudin,2 Nicolas Biver,3 Dominique Bockelée-Morvan,3 Mathieu Choukroun,1 Jacques Crovisier,3 Björn J. R. Davidsson,4 Pierre Encrenaz,2 * Therese Encrenaz,3 * Margaret Frerking,1 Paul Hartogh,5 Mark Hofstadter,1 Wing-Huen Ip,6 Michael Janssen,1 Christopher Jarchow,5 Stephen Keihm,1 Seungwon Lee,1 Emmanuel Lellouch,3 Cedric Leyrat,3 Ladislav Rezac,5 F. Peter Schloerb,7,1 Thomas Spilker1 † Heat transport and ice sublimation in comets are interrelated processes reflecting properties acquired at the time of formation and during subsequent evolution. The Microwave Instrument on the Rosetta Orbiter (MIRO) acquired maps of the subsurface temperature of comet 67P/Churyumov-Gerasimenko, at 1.6 mm and 0.5 mm wavelengths, and spectra of water vapor. The total H2O production rate varied from 0.3 kg s–1 in early June 2014 to 1.2 kg s–1 in late August and showed periodic variations related to nucleus rotation and shape. Water outgassing was localized to the “neck” region of the comet. Subsurface temperatures showed seasonal and diurnal variations, which indicated that the submillimeter radiation originated at depths comparable to the diurnal thermal skin depth. A low thermal inertia (~10 to 50 J K–1 m–2 s–0.5 ), consistent with a thermally insulating powdered surface, is inferred. T he Rosetta Orbiter spacecraft carries 12 science instruments to study comet 67P/ Churyumov-Gerasimenko with a long-range goal of better understanding the origin of our solar system. Comet 67P/Churyumov- Gerasimenko is a typical Jupiter family comet (JFC). JFCs are believed to have been injected from the Kuiper belt outside the orbit of Neptune because of gravitational interactions with the giant planets or collisions. Currently, comet 67P is in a low-inclination orbit with a semimajor axis of 3.46 AU and an orbital period of 6.45 years. Its present orbital configuration was achieved in February 1959 during a close encounter with Jupiter that converted its perihelion distance from 2.7 AU to 1.28 AU (1). Its prior history is uncertain. According to some statistical studies, comet 67P might have been subject to mass ero- sion driven by thermal sublimation with deple- tion of the surface materials up to a depth of a few kilometers (2). As a consequence, a dust man- tle would gradually build up and cover the nu- cleus surface, where ice mixtures of H2O, CO2, and CO would be found (3). The instrument suite on Rosetta was chosen to study physical and chemical properties of the nucleus, the evolution of the outgassing from the nucleus, and development of the coma as a func- tion of the heliocentric distance, as well as the interaction of the solar wind with the target comet. The development of the gas and dust comas along the cometary orbit depends critically on the energy transport through the dust mantle and the differential outgassing of different spe- cies according to their volatility. The Microwave Instrument on the Rosetta Orbiter (MIRO) (4) has been designed to study heat transport in the nucleus, outgassing from the nucleus, and devel- opment of the coma as interrelated processes. The measurements and monitoring of the inter- play between gas emissions and surface temper- ature evolution by MIRO therefore bring key information to the temporal evolution of the sub- surface ice-dust complex. This work reports on early measurements of comet 67P with the MIRO instrument from June to September 2014. The MIRO instrument consists of a 30-cm di- ameter, offset parabolic reflector telescope fol- lowed by two heterodyne receivers. Center-band operating frequencies of the receivers are near 190 GHz (1.6 mm) and 562 GHz (0.5 mm). Throughout this Report, we refer to the two bands as the mm (millimeter) and smm (submillimeter) bands, respectively. Broadband continuum chan- nels are implemented in both the mm and smm bands for measurements of near-surface temper- atures and temperature gradients in the nucleus of comet 67P. The smm band also includes a very high resolution spectrometer (44 kHz channel width) for measuring spectral lines of H2 16 O, H2 18 O, and other molecules in the coma. Here, we report the first measurements of water H2 16 O and H2 18 O in the coma and subsurface thermal measurements of the nucleus obtained during the time interval from June to September 2014. We refer to the June-July observations as pre- rendezvous observations, characterized here as the time when the nucleus was unresolved by the MIRO smm beam and the entire coma could be observed at once. The August-September period is identified as the postrendezvous time interval, during which both the nucleus and coma were observed with spatial resolutions that varied from 500 to 40 m. Observations of comet 67P with MIRO began on 24 May 2014. The instrument mode was dual- continuum and spectroscopic. Initial observations SCIENCE sciencemag.org 23 JANUARY 2015 • VOL 347 ISSUE 6220 aaa0709-1 1 Jet Propulsion Laboratory/California Institute of Technology, 4800 Oak Grove Drive, Pasadena, CA 91109, USA. 2 LERMA, Observatoire de Paris, PSL Research University, UPMC Université Paris 06, CNRS, UMR8112, F-75014 Paris, France. 3 LESIA-Observatoire de Paris, CNRS, UPMC, Université Paris–Diderot, 5 place Jules Janssen, 92195 Meudon, France. 4 Department of Physics and Astronomy, Uppsala University, Box 516, SE-75120 Uppsala, Sweden. 5 Max-Planck-Institut für Sonnensystemforschung, Justus-von-Liebig-Weg 3, 37077 Göttingen, Germany. 6 National Central University, Jhongli, Taoyuan City 32001, Taiwan. 7 University of Massachusetts, 619 Lederle Graduate Research Tower, Amherst, MA 01003, USA. *Distinguished Visiting Scientist at the Jet Propulsion Laboratory †Retired. ‡Corresponding author. E-mail: samuel.gulkis@jpl.nasa.gov A B Fig. 1. Sample spectra of the 1(1,0) – 1(0,1) tran- sitions of H2 16 O and H2 18 O lines at 556.939 GHz and 547.676 GHz, respectively, obtained with MIRO in nadir-viewing geometry. All spectra seen to date are biased toward negative gas velocities (toward the spacecraft), which is interpreted as preferential outgassing from the day side of the nucleus. (A) Line observed in emission on 23 June 2014 UT when the Rosetta distance to the comet is D = 128,000 km, the heliocentric distance is rH = 3.84 AU, the spatial resolution is W = 260 km, and the phase (Sun-comet observer) angle is F = 32°. (B) (Inset plot) Lines observed in absorption against the nucleus subsurface thermal emission on 19 August 2014 UT (D = 81 km, rH = 3.5 AU, F = 37°, W = 160 m). The line intensity is expressed in the main-beam TB scale. The velocity scale is given relative to the nucleus velocity.The spectral resolution is 24 m s–1 .The H2 16 O spectrum of 23 June is consistent with an expansion velocity of 0.68 T 0.02 km s–1 . The optical thickness of the H2 16 O line observed on 23 June is 0.3. On 19 August, the H2 16 O line is optically thick near the line center (opacity > 10), whereas the H2 18 O line is optically thin (opacity < 0.1). onJanuary22,2015www.sciencemag.orgDownloadedfromonJanuary22,2015www.sciencemag.orgDownloadedfromonJanuary22,2015www.sciencemag.orgDownloadedfromonJanuary22,2015www.sciencemag.orgDownloadedfromonJanuary22,2015www.sciencemag.orgDownloadedfrom
- 2. were carried out with the instrument pointed in the nadir direction of the comet and off of the comet to provide background reference. In the June-July 2014 time interval, the Rosetta spacecraft approached the comet from 550,000 km to 973 km. The phase angle of the observations during this period ranged from 35° to 1°, and the heliocentric distance changed from 3.95 to 3.62 AU. The MIRO smm single-pixel, one-dimensional (1D) field of view ranged from 2400 to 4.2 km, larger than the nucleus radius of 3.8 km. It was possible to measure and monitor the total water outgassing rate of comet 67P without spatial mapping dur- ing this time interval. Water vapor was first detected with MIRO on 6 June 2014, when the comet was at 3.92 AU from the Sun. A weak emission line from the 1(1,0) – 1(0,1) rotational transition of H2 16 O at the frequency of 556.936 GHz was detected, which then rapidly increased as the distance of Rosetta to the comet decreased (Fig. 1A). A large blue shift (frequency increase) of the spectral line in the comet rest velocity frame (about –0.4 km s–1 in the June period) was observed, indicative of water outgassing, essentially toward the hemisphere facing Rosetta and the Sun. This suggests large temperature contrasts between daytime and night- time, with temperatures on the night side too low for rapid sublimation of water ice. The water production rate displayed periodic variations on short time scales, typically by 50% in magnitude with two maxima and minima per period (Fig. 2), which are correlated with the 12.4-hour rotation of the nucleus (5). This variation is related to the complex shape of the nucleus, for which the total area exposed to the Sun varies during the rotation (5). Both the line Doppler shift and time variations suggest that the nucleus regions exposed to solar illumination were the main source of water va- por in the June-July period. However, surface inhomogeneity in ice content and material proper- ties may also play a significant role. Indeed, local jet activity was observed by the OSIRIS camera (5), specifically in the so-called “neck” region of 67P, where the spectral and reflectance proper- ties indicate the presence of water ice (5, 6). Sim- ple models considering either a homogeneous distribution of water ice on the surface or one concentrated in the neck region (Fig. 2) can explain the observed time variation in a first ap- proximation (7). As mentioned earlier, in the June-July time period, the nucleus was unresolved and it was possible to sample the inner coma in a single- pixel field of view. The spectra observed during this time period show blue-shifted water lines (Fig. 1) in emission, which are indicative of water outgassing mainly into the hemisphere facing the sun. Therefore, for purposes of calculating the mean total water production rate over one nucleus rotation using this data set, we used the approximation of hemispheric outgassing. We in- ferred from radiative transfer calculations (8, 9) that the mean total water production rate over one nucleus rotation was 1 × 1025 molecules/s (0.3 kg s–1 ) in early June and reached 2 × 1025 molecules/s (0.6 kg s–1 ) at the end of July 2014. For more localized production patterns, higher values are derived as a result of higher opacities. We estimate that the above values might under- estimate the actual production rate by a factor of two, at most. Based on the rotational variations in Fig. 2, we estimate the outgassing variability to be on the order of T20%. We expect to be able to refine this estimate, as we are able to better define the parameters that enter in the radiative transfer calculations, i.e., the temperature and velocity profiles in the coma and the global ex- tent of the outgassing. Rosetta was at a distance of 100 km from the comet on August 6 and continued to approach rapidly. The nucleus was well resolved at that time (and throughout August and September), with a spatial resolution of <200 m in the smm channel. When viewing the resolved nucleus through the coma, the continuum radiation (from the nucleus) was observed to be in absorption at the H2 16 O and H2 18 O spectral line frequencies present in the coma. Absorption of the nucleus thermal emission in the coma provides clear evi- dence that the excitation temperatures of the ab- sorbing water molecules are lower than the nucleus brightness temperature (TB) (9). Starting in early August, the spectral line due to H2 18 O provided a more sensitive measure of the water production rate than the H2 16 O line, which became optically thick (Fig. 1B). Therefore, we focus here on the H2 18 O observations to derive quantitative infor- mation on water production for this time period. The frequency of the peak intensity of the water lines is diagnostic of the gas expansion velocity, whereas the width contains information on the radial profiles of the gas velocity and temperature. The water column density along the MIRO line of sight exhibited considerable variability, as it varied by a factor of 5 or more over a time scale of 10 hours during the August 7.4 to 9.5 UTC period (Fig. 3). Considering both nadir and limb observations acquired from August 6 to September 1, we estimate the mean water pro- duction for this period (heliocentric distance ranged from 3.6 AU to 3.46 AU) to be about 4 × 1025 molecules/s. In this time frame, the MIRO footprint unevenly covered nucleus latitudes from 0° to 80° N and longitudes from 0° to 360° (Fig. 3 and figs. S1 and S2). However, maximum column densities are generally observed above regions of cometocentric coordinates at latitudes of 65° to 70° and longitudes of 0° to 100°, i.e., close to the North pole and to the neck, specif- ically at the place where the nucleus presents its deepest concavity (the neck is the region connect- ing the small head and large body of the nucleus in reference to the ducklike shape of 67P). This is in line with water outgassing mostly from the neck region and responsible for the prominent dust jet seen in OSIRIS images. Water produc- tion from icy grains has been observed in a num- ber of comets (10), and therefore, sublimating icy grains from this dust jet could also be significant contributors to the observed water production. To our surprise, the highest water column den- sities are often observed above shadowed neck regions where the nucleus thermal continuum— and, consequently, the surface and subsurface aaa0709-2 23 JANUARY 2015 • VOL 347 ISSUE 6220 sciencemag.org SCIENCE WaterProductionRate(moleculess-1 ) Fig. 2. Variations of the total water production rate as the nucleus rotates. The rates shown above are based on MIRO H2 16 O observations between 13 and 15 July 2014. Based on coarse maps, the pointing direction of the MIRO field of view was 300 arc sec southwest from the nucleus center at the time of the observations. In one nucleus rotation period (12.4 hours) (5), the water production rate exhibits two minima and two maxima.The rotation period of 67P (12.4 hours) is shown with a red bar. Early models to explain the variations are found in (7). CATCHING A COMET
- 3. temperatures—is low (Fig. 3 and fig. S2). It is possible that observed gases are originating from nearby insolated regions. Inversely, low column densities are measured above some illuminated regions (on the body and on the head), again supporting an activity driven by more than solar insolation and confirming the inhomogeneity in ice distribution observed by other Rosetta in- struments (5, 6). SCIENCE sciencemag.org 23 JANUARY 2015 • VOL 347 ISSUE 6220 aaa0709-3 Fig. 3. Water column density and expansion ve- locity measured by MIRO from 7.4 to 9.5 August 2014 UTC by using nadir H2 18 O spectra. Signifi- cant spatial variability is seen, with maxima cor- related with lines of sight near the neck region of the nucleus. (A) Column density (blue dots with error bars), nucleus thermal continuum temperatures (red curve), and cosine of the incidence angle in the center of MIRO beam (dotted black curve). Large drops in the smm continuum (red) temperature are observed when the MIRO line of sight crosses the limb. (B) Mean water expansion velocity given by the velocity at maximum absorption. (C) (Bottom) Illumination maps of the nucleus at the specified times The SHAP2 digital shape model provided by the OSIRIS team was used.The submillimeter MIRO beam position is shown by the red dot on the illu- mination maps.The x,y plane is perpendicular to the MIRO line of sight and contains the comet- Sun line. Fig. 4. Illumination map of the digital shape model SHAP2 with contour plot of the MIRO submillimeter antenna temperature. MIRO sees subsurface brightness features correlated with sur- face slopes, with regions facing the Sun generally brighter (warmer) than those tilted away from the Sun. This is an indication of rapid response to solar illumination and, hence, a low thermal inertia. Ex- cellent overlap of the MIRO and shape model limbs is obtained on the Sun-lit (right) side of the nu- cleus.The left side of the nucleus is in polar night at this time, and the shape model—based on visible imaging—cannot determine its true shape here.The extension of the MIRO data beyond the limb on the night side indicates the true size of the nucleus in this region. The shape model is presented as an illumination map with the intensity given by the cosine of the solar illumination angle projected onto a plane perpendicular to the line joining the space- craft to the barycenter of the comet. 1.5 120 SMM TA 2014 Aug 13 11:36:40 UTC-LST=11.2 100 80 60 40 20 5 1.0 0.5 0.0 –0.5 –1.0 –2 –1 0 X (km) Y(km) 1 2
- 4. Line profiles provide information on the kin- ematics of the gas flow. Note that the line-peak velocity (–0.6 to –0.75 km s–1 ) is observed to be higher along lines of sight where higher column densities (Fig. 3) are recorded, whereas the line width decreases. Therefore, projection effects of the gas flow are minimized for these lines of sight, and the line-peak velocity should be close to the expansion velocity. These findings also demonstrate that the observed column-density enhancements are related to larger sublimation fluxes from the surface and not to local density enhancements caused by shocks between flows that would decelerate the gas. Continuum observations from the MIRO 0.5- and 1.6-mm bands were geo-referenced to the SHAP2 digital shape model provided by the OSIRIS team. The map of the antenna temper- ature (Fig. 4) was derived by scanning the MIRO beam across the nucleus and then combining the scans into a map using the “on-the-fly” technique developed for mapping with single-dish radio telescopes (11). The antenna temperature con- tours correlate well with illumination patterns on the nucleus surface, which are, in turn, de- termined by topography and orientation with respect to the Sun. Subsurface temperatures, which determine the MIRO smm and mm thermal fluxes, may have three components. (i) The diurnal component— variation with local solar time—is confined to a shallow layer defined by the thermal 1/e pene- tration depth—on the order of 1 to 2 cm for 67P’s 12.4-hour rotation period and plausible thermal properties of a particulate regolith. (ii) An annual signal, dependent on obliquity, orbital period, and perihelion location, with latitude-dependent amplitude and a 1/e attenuation depth of the order 1 m. The seasonal variations in tempera- tures determine the MIRO emissions from pene- tration depths below the diurnal layer. (iii) The “static” or “subseasonal” component is the ap- proximately isothermal layer beneath the sea- sonally varying layer, and its temperature depends on the latitude-dependent orbit variation of the solar flux. Plotting the MIRO mm and smm brightness temperatures as a function of the local solar time and latitude (Fig. 5) reveals three key features of the nucleus thermal environment. (i) Both the smm and mm channels reveal sensitivity to the diur- nal heating cycle, peaking in early to midafter- noon, although with amplitudes diminished by a factor of approximately 2 to 4 from the smm to mm channel. (ii) The observed 40- to 50K smm day-night peak-to-peak variations represent 35% or more of the predicted surface temperature variations for a completely insulating surface (zero thermal inertia) at the September Sun dis- tance. For realistic nonzero thermal inertia values, the ratio of the smm TB/surface temperature peak-to-peak values will be higher. This result implies that the smm 1/e penetration depth lies at or above the 1/e thermal attenuation depth for diurnal variations. (iii) Seasonal effects are appar- ent in the reduction of the diurnally averaged TB values from the 20°N to 30°N latitude bin to the 20°S to 30°S latitude bin. We conclude that, on a global scale, the MIRO smm emissions originate primarily at depths comparable to the diurnal layer thickness, whereas the mm emissions orig- inate at depths roughly three times the thermal attenuation depth, consistent with electrical ab- sorption properties, which scale inversely with wavelength. The latitude dependence of the mea- sured brightness temperatures is consistent with expectations from seasonal variations of the solar flux given 67P’s orbital parameters. Temperature depth profiles were computed by solving the 1D heat equation for a range of values of the thermal inertia, and the resulting antenna temperatures in the mm and smm bands were calculated from evaluating the transfer of the ther- mal radiation emitted in the subsurface region. Comparing these theoretical antenna tempera- tures with MIRO observations leads to an esti- mated thermal inertia in the range of ~10 to 50 J K–1 m–2 s–0.5 (12). With this range of values, large (up to ~50 K) differences between the MIRO measured dayside subsurface temperatures and the temperature at the surface can be inferred, highlighting the key insulating role played by the dusty surface: It largely restricts the amount of heat transferred to the interior, including ices within. This certain- ly contributes greatly to the longevity of 67P and, probably, of comets in general. The importance of measuring the temperatures below the surface of a comet—and particularly below its diurnal layer—is illustrated by these data. MIRO’s spectroscopic and continuum observa- tions provide interrelated data on heat transport, sublimation of ices, and outgassing by providing data on the nucleus subsurface temperature, lo- cation, time, and fluxes of water being emitted from the nucleus surface. Less than 1% of the 67P nucleus surface is needed to explain the water gas production rates discussed earlier if water ice were located on the surface (13). A substantial portion of the measured outgassing originates from the neck of the nucleus. aaa0709-4 23 JANUARY 2015 • VOL 347 ISSUE 6220 sciencemag.org SCIENCE Fig. 5. Brightness temperatures as a function of local solar time, from MIRO continuum measurements of September 2014, are shown for effective latitude bins of 20° to 30° N (black data points) and 20° to 30° S (red data points). The solid curves are diurnal sinusoidal fits to the data. Both effective latitudes and the local solar time are computed from the shape model–derived surface orienta- tion at the MIRO beam center. Only points for which the MIRO beams lie entirely within the nucleus are included. The data are restricted to the 100° to 200° longitude band in order to elimi- nate data in the neck region, where extreme shadowing conditions obscure the interpre- tation of the diurnal heating curve. (A) Submillimeter data. (B) Millimeter data. A B CATCHING A COMET
- 5. REFERENCES AND NOTES 1. A. Carusi, L. Kresak, E. Perozzi, G. B. Valsecchi, Long-Term Evolution of Short-Period Comets (Adam Hilger, Ltd., Accord, MA, 1985). 2. O. Groussin, G. Hahn, P. L. Lamy, R. Gonczi, G. B. Valsecchi, The long-term evolution and initial size of comets 46P/ Wirtanen and 67P/Churyumov–Gerasimenko. Mon. Not. R. Astron. Soc. 376, 1399–1406 (2007). doi: 10.1111/ j.1365-2966.2007.11553.x 3. H. L. F. Houpis, D. A. Mendis, W.-H. Ip, The chemical differentiation of the cometary nucleus: The process and its consequences. Astrophys. J. 295, 654–667 (1985). doi: 10.1086/163409 4. S. Gulkis et al., MIRO: Microwave instrument for the Rosetta orbiter. Space Sci. Rev. 128, 561–597 (2007). doi: 10.1007/ s11214-006-9032-y 5. H. Sierks et al., On the nucleus structure and activity of comet 67P/Churyumov-Gerasimenko. Science 347, aaa1044 (2015). 6. F. Capaccioni et al., The organic-rich surface of comet 67P/ Churyumov-Gerasimenko as seen by VIRTIS/Rosetta. Science 347, aaa0628 (2015). 7. See supplementary materials on Science Online, Models used for the water production observed on 13 to 15 July 2014. 8. V. Zakharov, D. Bockelée-Morvan, N. Biver, J. Crovisier, A. Lecacheux, Radiative transfer simulation of water rotational excitation in comets: Comparison of the Monte Carlo and escape probability methods. Astron. Astrophys. 473, 303–310 (2007). doi: 10.1051/0004-6361:20066715 9. S. Lee, P. von Allmen, L. Kamp, S. Gulkis, B. Davidsson, Non-LTE radiative transfer for submillimeter water lines in Comet 67P/Churyumov-Gerasimenko. Icarus 215, 721–731 (2011). doi: 10.1016/j.icarus.2011.07.007 10. K. J. Meech et al., EPOXI: Comet 103P/Hartley 2 observations from a worldwide campaign. Astrophys. J. 734, L1–L9 (2011). doi: 10.1088/2041-8205/734/1/L1 11. J. G. Mangum, D. T. Emerson, E. W. Greisen, The On The Fly imaging technique. Astron. Astrophys. 474, 679–687 (2007). doi: 10.1051/0004-6361:20077811 12. See supplementary materials on Science Online, Method for determining the thermal inertia. 13. See supplementary materials on Science Online, Ice coverage and content on 67P. ACKNOWLEDGMENTS The authors gratefully acknowledge the assistance and support of the entire MIRO project teams at the Jet Propulsion Laboratory, the Max-Planck-Institut für Sonnensystemforschung, LESIA-Observatoire de Paris, and LERMA-Observatoire de Paris–Meudon. We thank Y. Anderson, T. Koch, R. Nowicki, and L. Pan for their efforts in scheduling, operations, and support of the MIRO instrument. The authors recognize here the enormous contributions that our friend and colleague, Lucas Kamp, made to the MIRO science and engineering efforts before his recent death. The authors acknowledge support from their institutions and funding sources. A part of the research was carried out at the Jet Propulsion Laboratory, California Institute of Technology, under a contract with the National Aeronautics and Space Administration. A part of the research was carried out at the Max-Planck-Institut für Sonnensystemforschung with financial support from Deutsches Zentrum für Luft- und Raumfahrt and Max-Planck-Gesellschaft. Parts of the research were carried out by LESIA and LERMA, Observatoire de Paris, with financial support from Centre National d'Études Spatiales (CNES) and CNRS/Institut National des Sciences de l'Univers (INSU); at the National Central University with funding from the Taiwanese National Science Counsel grant 101-2111-M-008-016; at the University of Massachusetts, Amherst, USA; and at Uppsala University with financial support from the Swedish National Space Board. We acknowledge personnel at ESA's European Space Operations Center (ESOC) in Darmstadt, Germany, and at ESA and NASA/JPL tracking stations for their professional work in communication with and directing the Rosetta spacecraft, thereby making this mission possible. We acknowledge the excellent support provided by the Rosetta teams at the ESOC in Germany and the European Space Astronomy Center (ESAC) in Spain. Special mention is made of C. Vallat, whose superb efforts have made many difficult MIRO observing sequences possible; B. Grieger, whose calculations and visualizations have enabled and optimized our science return; and N. Altobelli and M. Küppers, whose early liaison support and later oversight responsibilities have greatly benefited the mission as a whole. The authors thank Holger Sierks and the OSIRIS team for permission to use the SHAP2 shape model for analysis purposes and for permission to publish several images here. All MIRO data are released through the PSA archive of ESA and the PDS archive of NASA. The data reported here are scheduled for delivery to the archive on 19 May 2015 and are available on request until then. SUPPLEMENTARY MATERIALS www.sciencemag.org/content/347/6220/aaa0709/suppl/DC1 Supplementary Text Figs. S1 to S4 References (14–17) 12 October 2014; accepted 27 December 2014 10.1126/science.aaa0709 SCIENCE sciencemag.org 23 JANUARY 2015 • VOL 347 ISSUE 6220 aaa0709-5
- 6. DOI: 10.1126/science.aaa0709 , (2015);347Science et al.Samuel Gulkis 67P/Churyumov-Gerasimenko Subsurface properties and early activity of comet This copy is for your personal, non-commercial use only. clicking here.colleagues, clients, or customers by , you can order high-quality copies for yourIf you wish to distribute this article to others here.following the guidelines can be obtained byPermission to republish or repurpose articles or portions of articles ):January 22, 2015www.sciencemag.org (this information is current as of The following resources related to this article are available online at http://www.sciencemag.org/content/347/6220/aaa0709.full.html version of this article at: including high-resolution figures, can be found in the onlineUpdated information and services, http://www.sciencemag.org/content/suppl/2015/01/21/347.6220.aaa0709.DC1.html can be found at:Supporting Online Material http://www.sciencemag.org/content/347/6220/aaa0709.full.html#related found at: can berelated to this articleA list of selected additional articles on the Science Web sites http://www.sciencemag.org/content/347/6220/aaa0709.full.html#ref-list-1 , 1 of which can be accessed free:cites 11 articlesThis article http://www.sciencemag.org/content/347/6220/aaa0709.full.html#related-urls 1 articles hosted by HighWire Press; see:cited byThis article has been http://www.sciencemag.org/cgi/collection/planet_sci Planetary Science http://www.sciencemag.org/cgi/collection/astronomy Astronomy subject collections:This article appears in the following registered trademark of AAAS. is aScience2015 by the American Association for the Advancement of Science; all rights reserved. The title CopyrightAmerican Association for the Advancement of Science, 1200 New York Avenue NW, Washington, DC 20005. (print ISSN 0036-8075; online ISSN 1095-9203) is published weekly, except the last week in December, by theScience onJanuary22,2015www.sciencemag.orgDownloadedfrom