All maze system with video tracking software is useful to study how drugs affects cellular function in the nervous
system and the way by which they influence the behaviour. This review focusses on Elevated plus maze, Y maze, T
maze, Zero maze, Water maze, Multiple unit open field enclosure, Radial arm maze, Tail suspension unit, Light and
dark unit, Novel object recognision test unit, Conditioned Place Preference unit and Barnes maze, which are used in
the evaluation of neuropharmacological and behavioural studies.
Behavioral phenotyping of mouse models of neurodegeneration Dewan Sumsuzzman
Behavioral phenotyping provides a quantitative marker for human disease symptoms, and a preclinical tool to assess new treatments. Several neurodegenerative animal models have been generated & characterized, during the characterization, behavioral science plays a crucial rule by identifying specific symptom in these animal models of human disorders.
ABSTRACT— Evidence is that the Lunar cycle entrain crustacean biological rhythms in briefly reviewed. Egg laying and hatching undergo semi-lunar and monthly rhythms that appear to depend on endogenous clocks. The lunar cycle can be understood in terms of adaptation and life post larvae n = 150 hatched during March 2002 and rared artificially. Their moulting frequency was monitored from day 112 post hatch to day 204 (CL = 20mm + 1.55 SD.) Daily moults (n=25) recorded individually during July, August and September showed an average duration for the first and second inter moult internal of 34 to 36 days respectively. Daily moulting frequency distribution showed and trend characterized by peak values around new moon and full moon in the absence of any tidal condition. The pattern for commonly rared female crab is more natural water temperature affecting the rhythm. However it is model or many average value of over 24 hours sampling period support the presence of semilunar cycle. The cycle is main-tained under laboratory could sublittroral population that are not rhythm may represent the powerful clock that is retained for synchronizing events throughout the life history of crustaceans. It results in reduced preparation risks for hatchery in dark new moon night & favour dispersed during spring tides due to tidal carrent. This may enhance mutual protection against habits simultenously juveniles
This file includes the general introduction to Alzheimer's, histopathology and Pharmacological treatment of Alzheimer's, preclinical screening models used in Alzheimer's. I hope this file may useful to life science students
This Power Point was designed to accompany a Web Quest titled The Geologic History of New York State. It is designed as an introduction to Geologic Time and has an accompanying worksheet that can be downloaded from the Web Quest.
Student InstructionsIn this lab, you will determine how an inv.docxcpatriciarpatricia
Student Instructions
In this lab, you will determine how an invasive species—the zebra and quagga mussel—affects other species in the freshwater lake. Use the animation to help you come up with an answer to the following:
Why do you see increases and decreases in the invasive species population?
What are the implications associated with these alterations to the ecosystem as a whole?
The Effects of Zebra and Quagga Mussels Introduced into a Freshwater Lake
As you have learned, population dynamics are caused by the biotic potential of the population and the effects of environmental resistance. When there is minimal environmental resistance impacting a population, it will exhibit a population explosion. One reason for minimal resistance could be factors that no longer regulate a population (e.g., predator decline or resource increases). Another reason for a population explosion is the introduction of an invasive species.
Invasive species
are species foreign to an ecosystem and are not immediately regulated by the environmental restraints of the particular ecosystem that they invade. This in turn allows their populations to grow seemingly uncontrolled and to displace other indigenous populations. Examples of such an invasive species into North America are dreissenid mussels, commonly known as zebra and quagga mussels. Their introduction into the Great Lakes has caused economic hardship and a reorganization of the ecosystem. This has led, in part, to pollution-causing effects that can be linked to an alga known as
Cladophora
.
Ecosystems are webs of intricately balanced interactions, what happens when a new species is introduced that uses a disproportionate share of the ecosystem’s resources?
Using the M.U.S.E. link, review the background information and animation to complete your report.
Use the
Lab 5 worksheet
for assignment instructions and data collection.
Hi Everyone,
For your lab report this week, you will investigate the impact and spread of invasive species.
One of these described in your MUSE lab activity is the Zebra Mussel.
Just as you have done for the previous assignments, you will first review the background information, then collect the data. Your study will involve measurements showing how the mussels have spread and how they have impacted native species in an aquatic environment.
You will find that the number of mussels increases for 13 years and then begins to decrease. You are asked to explain this in your report.
Why do you see increases and decreases in the invasive species population?
What are the implications associated with these alterations to the ecosystem as a whole?
Use the notes in the animation to review the food chain in this ecosystem.
It will be very important to be able to describe which species are native and which are invasive. And to describe how even a native species, such as cladophora (algae) can result in ecological damage.
Next, review Chapter 4 of your eBook and refresh your memory on h.
All networks tend to become more and more complicated. They can be wired, with lots of routers, or wireless, with lots of mobile nodes… The problem remains the same: in order to get the best from the network, there is a need to find the shortest path. The more complicated the network is, the more difficult it is to manage the routes and indicate which one is the best.
The Nature gives us a solution to find the shortest path. The ants, in their necessity to find food and brings it back to the nest, manage not only to explore a vast area, but also to indicate to their peers the location of the food while bringing it back to the nest. Thus, they know where their nest is, and also their destination, without having a global view of the ground. Most of the time, they will find the shortest path and adapt to ground changes, hence proving their great efficiency toward this difficult task.
The purpose of this project is to provide a clear understanting of the Ants-based algorithm, by giving a formal and comprehensive systematization of the subject. The simulation developed in Java will be a support of a deeper analysis of the factors of the algorithm, its potentialities and its limitations. Then the state-of-the-arts utilisation of this algorithm and its implementations in routing algorithms, mostly for mobile ad hoc networks, will be explained. Results of recent studies will be given and resume the current employments of this great algorithm inspired by the Nature.
More Related Content
Similar to Stress Effects Crayfish Poster (resize)
This file includes the general introduction to Alzheimer's, histopathology and Pharmacological treatment of Alzheimer's, preclinical screening models used in Alzheimer's. I hope this file may useful to life science students
This Power Point was designed to accompany a Web Quest titled The Geologic History of New York State. It is designed as an introduction to Geologic Time and has an accompanying worksheet that can be downloaded from the Web Quest.
Student InstructionsIn this lab, you will determine how an inv.docxcpatriciarpatricia
Student Instructions
In this lab, you will determine how an invasive species—the zebra and quagga mussel—affects other species in the freshwater lake. Use the animation to help you come up with an answer to the following:
Why do you see increases and decreases in the invasive species population?
What are the implications associated with these alterations to the ecosystem as a whole?
The Effects of Zebra and Quagga Mussels Introduced into a Freshwater Lake
As you have learned, population dynamics are caused by the biotic potential of the population and the effects of environmental resistance. When there is minimal environmental resistance impacting a population, it will exhibit a population explosion. One reason for minimal resistance could be factors that no longer regulate a population (e.g., predator decline or resource increases). Another reason for a population explosion is the introduction of an invasive species.
Invasive species
are species foreign to an ecosystem and are not immediately regulated by the environmental restraints of the particular ecosystem that they invade. This in turn allows their populations to grow seemingly uncontrolled and to displace other indigenous populations. Examples of such an invasive species into North America are dreissenid mussels, commonly known as zebra and quagga mussels. Their introduction into the Great Lakes has caused economic hardship and a reorganization of the ecosystem. This has led, in part, to pollution-causing effects that can be linked to an alga known as
Cladophora
.
Ecosystems are webs of intricately balanced interactions, what happens when a new species is introduced that uses a disproportionate share of the ecosystem’s resources?
Using the M.U.S.E. link, review the background information and animation to complete your report.
Use the
Lab 5 worksheet
for assignment instructions and data collection.
Hi Everyone,
For your lab report this week, you will investigate the impact and spread of invasive species.
One of these described in your MUSE lab activity is the Zebra Mussel.
Just as you have done for the previous assignments, you will first review the background information, then collect the data. Your study will involve measurements showing how the mussels have spread and how they have impacted native species in an aquatic environment.
You will find that the number of mussels increases for 13 years and then begins to decrease. You are asked to explain this in your report.
Why do you see increases and decreases in the invasive species population?
What are the implications associated with these alterations to the ecosystem as a whole?
Use the notes in the animation to review the food chain in this ecosystem.
It will be very important to be able to describe which species are native and which are invasive. And to describe how even a native species, such as cladophora (algae) can result in ecological damage.
Next, review Chapter 4 of your eBook and refresh your memory on h.
All networks tend to become more and more complicated. They can be wired, with lots of routers, or wireless, with lots of mobile nodes… The problem remains the same: in order to get the best from the network, there is a need to find the shortest path. The more complicated the network is, the more difficult it is to manage the routes and indicate which one is the best.
The Nature gives us a solution to find the shortest path. The ants, in their necessity to find food and brings it back to the nest, manage not only to explore a vast area, but also to indicate to their peers the location of the food while bringing it back to the nest. Thus, they know where their nest is, and also their destination, without having a global view of the ground. Most of the time, they will find the shortest path and adapt to ground changes, hence proving their great efficiency toward this difficult task.
The purpose of this project is to provide a clear understanting of the Ants-based algorithm, by giving a formal and comprehensive systematization of the subject. The simulation developed in Java will be a support of a deeper analysis of the factors of the algorithm, its potentialities and its limitations. Then the state-of-the-arts utilisation of this algorithm and its implementations in routing algorithms, mostly for mobile ad hoc networks, will be explained. Results of recent studies will be given and resume the current employments of this great algorithm inspired by the Nature.
Similar to Stress Effects Crayfish Poster (resize) (20)
1. START
Stress Effects On The A-maze-ing Crayfish
Sally Le and Thanh Thuy Le
Clayton State University, Department of Natural Sciences
INTRODUCTION
METHODS
CONCLUSIONS
1. Five crayfish were selected from communal tanks to use throughout the
experiment.
2. Individual crayfish is placed in the dark maze map for 15 minutes to explore. Red
lighting is used to observe and record.
3. An aversive zone is designed in which the aversive zone is kept dark while the
remaining areas are illuminated. Unstressed crayfish are given 15 minutes to
explore the new maze map to serve as a control.
4. Unstressed crayfish are tested again on the same maze map and are given 15
minutes to explore; however, if the crayfish cross into the aversive zone, they will
be electrically shocked to induce aversion.
5. These crayfish will undergo the same procedures in step 4 so that each individual
will be conditioned to avoid that area due to fear and anxiety.
6. These conditioned crayfish are then tested again in the same aversive maze map.
However, the crayfish are shocked in a separate chamber before they are given 15
minutes to explore. Crayfish under stress would most likely avoid the light areas
and remain in the dark regions. Both stressed and unstressed crayfish have a
higher preference for the dark regions1. With this, their memory will be tested.
7. Each trial is recorded and observed for path tracing and number of turns (left vs.
right) based on the crayfish preferences. An outline of each crayfish’s route
traveled will be digitally designed similar to the D/L+ maze in the article1.
Based on the locomotion pattern observed from the crayfish, stressful conditions
contribute to a decrease in locomotion. Meanwhile, observations in the ratios of
light/dark indicate signs of memory retention. Although time in the light did not
restore back to control levels, the ratios for 2 out of 3 crayfish maintain preference for
the light after the induced aversion in the dark. Furthermore, in recordings of the
same two out of three crayfish, they are noted to pause at the “shock” zone as well as
one retreating from the zone before eventually entering it. However, there cannot be
any definitive conclusions made about how stress affected the crayfish memories in
this experiment simply due to the low amount of subjects surviving to the final stage.
In further studies, it would be best to use a large number of subjects to ensure the
data pool is large enough to represent the behaviors of most crayfish.
1. Fossat, B.C., et al. (2014). Anxiety-like Behavior in Crayfish is Controlled by Serotonin. 1293-1297.
2. Mirk, S., Wermcrantz, B. (2007). Caffeine Inhibits Serotonin's Enhancement of EJP Amplitude in
Crayfish Deep Extensor Muscle. 21-22.
3. Musolf, B.E., Spitzer, N., Antonsen, B.L., Edwards, D.H. (2006) Serotonergic Modulation of
Crayfish Hindgut. Biol. Bull. 217, 50-64.
4. Tierney, A. J., Andrews, K. (2012). Spatial Behavior in Male and Female Crayfish (Orconectes
rusticus): Learning Strategies and Memory Duration. 23-33.
REFERENCES
RESULTS
Drawing ideas from the similarities between how crayfish and humans handle
stress and anxiety, we decided to test the learning capabilities of crayfish under
stressed and unstressed conditions. The induced circumstances are similar to that of
a college student predisposed to stress to recall information during exams, the
stressed crayfish are observed whether they could retain memories of aversive zones.
Through conducting this experiment, the results can possibly relate how stress can
affect memory.
Based on the effects of stressor and environmental lights effects on crayfish
anxiety as well as the correlation between anxiety levels on depressing exploring
behavior, the stressed crayfish will remember the induced aversive zone and will be
less inclined to enter it even if it is favorably darkened.
Fig. 5 – Dark (Control)
RESULTS
ACKNOWLEDGEMENTS
Thank you to Dr. Musolf, Dr. Braun, Justin Cropsey, and the crayfish for all their help
in making this experiment possible.
START
START
Observing the control trials such as the one
shown in figure 5, an aversive zone was designed. The
darkened region, shown in dark grey, is the area that
each crayfish tend to cross the most. The figure to the
left display the path trace of one unstressed crayfish,
▲, use as a control to observe locomotion in the
light/dark map.
Fig. 6 – Light/Dark (Control)
The figure to the left display path trace of one
crayfish, ▲, through the dark maze which serves as a
control for observing locomotion. Observations are
used to determine which area each crayfish spends the
most time in or repeatedly return to in order to
designate an aversive zone at a high traffic region.
Fig. 1 – Dark
START
After inducing aversion to the crayfish using the
maze map shown in figure 3, the crayfish was shocked
in a separate chamber and was allowed to explore in
the same maze map. The figure to the left display the
path trace for one stressed crayfish, ▲. Focal subject
was observed to travel less frequently and the speed
of locomotion was reduced. In addition, focal subject
tend to retreat when entering the aversive area.
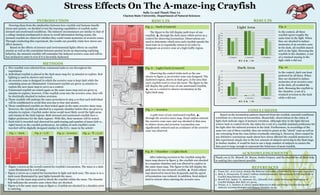
Fig. 8 – Chamber Light/DarkSTART
In the control, all three
crayfish spent roughly the
same time in the light. When
they are shocked to induce
memories of an aversive zone
in the dark, all crayfish stayed
90% in the light. Stressing the
crayfish in the chamber, 2 out
of 3 retained staying in the
light while did not.
START START
Fig. 3 – Aversive Fig. 4 – L/DFig. 2 – L/D
0
0.1
0.2
0.3
0.4
0.5
0.6
0.7
0.8
0.9
1
L Control L Aversive L Chamber
LightTImeRatio
Light Area
● ▲ ●●
0
0.1
0.2
0.3
0.4
0.5
0.6
0.7
0.8
L Control L Aversive L Chamber
DarkTImeRatio
Dark Area
● ▲ ●●
Fig. 9
Fig. 10
• Figure 1 serves as the overall control for crayfish’s locomotion. The maze is a dark
room illuminated by a red lamp.
• Figure 2 serves as a control for locomotion in light and dark zone. The maze is in a
dark room illuminated by spot lights beneath the maze.
• Figure 3 is the maze map used to shock the crayfish within the maze. The thunder
bolt indicates the aversive zone where they are shocked.
• Figure 4 is the same maze map as figure 2. Crayfish are shocked in a chamber prior
to entering.
In the control, dark was least
preferred by all three. When
they are shocked to induce
memories of an aversive zone
in the dark, all avoided the
dark. Stressing the crayfish in
the chamber, 2 out of 3
retained aversion to the dark
while did not.
START
A path trace of one unstressed crayfish, ▲,
through the aversive maze map. Focal subject entered
the aversive zone once and was shocked in that area
to induce stress and aversion. Locomotion was
significantly reduced and an avoidance of the aversive
zone was observed.
Fig. 7 – Aversive
2. 0%
20%
40%
60%
80%
100%
120%
Control Aversive Chamber
Average In Dark Versus Light
Time in Dark Area/Total time Time in Light Area/total time
Fig. 9
In the light/dark control, unstressed crayfish spent more time exploring the
light areas. This is expected due to the fact that the illuminated portion is larger
compared to the darkened region. When focal subjects were shocked in the aversive
zone, they retreated and remained in the light portion over 90% of the time.
However, under stress, the crayfish explored both light and dark areas almost
equally.