Stock pitch NVIDIA
•
1 like•1,962 views

Can NVIDIA repeat it's 2016 performance? Will it become member of the FANGS club?

Recommended
Recommended
More Related Content
What's hot
What's hot (20)
Similar to Stock pitch NVIDIA
Similar to Stock pitch NVIDIA (20)
More from Siddharth Chakravarty
Recently uploaded
Recently uploaded (20)
Stock pitch NVIDIA
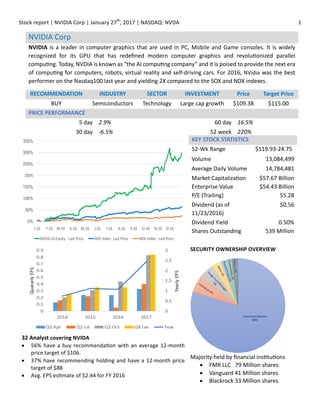
- 1. Stock report | NVIDIA Corp | January 27th , 2017 | NASDAQ: NVDA 1 32 Analyst covering NVIDA • 56% have a buy recommendaEon with an average 12-month price target of $106. • 37% have recommending holding and have a 12-month price target of $88 • Avg. EPS esEmate of $2.44 for FY 2016 SECURITY OWNERSHIP OVERVIEW Majority held by financial insEtuEons • FMR LLC 79 Million shares • Vanguard 41 Million shares • Blackrock 33 Million shares KEY STOCK STATISTICS 52-Wk Range $119.93-24.75 Volume 13,084,499 Average Daily Volume 14,784,481 Market CapitalizaEon $57.67 Billion Enterprise Value $54.43 Billion P/E (Trailing) 55.28 Dividend (as of 11/23/2016) $0.56 Dividend Yield 0.50% Shares Outstanding 539 Million NVIDIA Corp RECOMMENDATION INDUSTRY SECTOR INVESTMENT Price Target Price BUY Semiconductors Technology Large cap growth $109.38 $115.00 PRICE PERFORMANCE 5 day 2.9% 60 day 16.5% 30 day -6.5% 52 week 220% NVIDIA is a leader in computer graphics that are used in PC, Mobile and Game consoles. It is widely recognized for its GPU that has redefined modern computer graphics and revoluEonized parallel compuEng. Today, NVDIA is known as “the AI compuEng company” and it is poised to provide the next era of compuEng for computers, robots, virtual reality and self-driving cars. For 2016, NVidia was the best performer on the Nasdaq100 last year and yielding 2X compared to the SOX and NDX indexes. 0% 50% 100% 150% 200% 250% 300% 350% J-16 F-16 M-16 A-16 M-16 J-16 J-16 A-16 S-16 O-16 N-16 D-16 NVDA US Equity - Last Price SOX Index - Last Price NDX Index - Last Price Investment Advisor 80% Chart Title
- 2. Stock report | NVIDIA Corp | January 27th , 2017 | NASDAQ: NVDA 2 PRODUCT LINE AND REVENUE BREAKDOWN NVIDIA provides visual compuEng soluEons for the Gaming, Professional VisualizaEon, Datacenter and AutomoEve markets through its GPU and Tegra processors. Its verEcal integraEon provides a one stop soluEon that integrates hardware, system sokware, programmable algorithms, systems and services to create unique value for the markets it serves. The GPU business units Ge Force product line was the key driving force for NVIDIA’s 2016 growth. This was mainly due to explosive growth in discrete GPU market that diluted the impact of conEnued downward spiral of the PC market. The Terga business unit faced challenges, with strong compeEEon from Intel especially in the mobile space, but the loss was parEally offset by increase in sales of Terga products to the automoEve infotainment market. FY 2016: Revenue ($MN) by product FY 2016: Revenue share by market/end user FY 2016: Revenue ($MN) by geography GPU Business. GPU business revenue increased by 9% in fiscal year 2016 compared to fiscal year 2015. GPU accounted for 85% of the total revenue. driven by sale to the gaming industry. Revenue from sales to customers outside of the United States and other Americas accounted for 79% of total revenue for fiscal year 2016. Tegra Processor Business. Tegra Processor business revenue decreased by 3% in fiscal year 2016 compared to fiscal year 2015. This decrease was driven by a decline in sales of Tegra products for OEM smartphones and tablets. However, Tegra products serving automoEve systems grew by almost 75%, offseong the losses. All Other. License revenue comes from the patent cross licensing arrangement entered with Intel in January 2011. Revenue was flat at $264 million for fiscal years 2016, 2015, and 2014. The final payment under this arrangement was received in January 2016, and will be recognized as revenue into the first quarter of fiscal year 2018. MARKETS PRODUCT LINES BUSINESS SEGMENTS NVIDIA VISUAL COMPUTING SOLUTIONS GPU GE Force PC Gaming Quadro Creative application Tesla Deep learning GPU Servers GRID Cloud Terga Terga OEM DRIVE Automotive SHIELD Mobile
- 3. Stock report | NVIDIA Corp | January 27th , 2017 | NASDAQ: NVDA 3 COMPETITORS AND MARKET SHARE AMD and Intel are NVIDIA’ key compeEtors in the GPU, Mobile and Datacenter market space. For the 2015 and 2016, NVDIA remained the leader in discrete GPU market, but AMD has slowly started to capture some of the market share in 2016. For the fiscal year 2017F, the YOY growth for gaming business, professional visualizaEon, datacenter, auto and OEM businesses are expected to be 41%, 9%, 132%, 54%, and -9% respecEvely. The strong demand for GPU products reflects a combinaEon of conEnued strength in PC gaming and increased sales of Maxwell-based GPU products. NVIDIA has proacEvely diversified it’s offering, and gained tracEon in new and emerging markets – cloud compuEng, autonomous driving, virtual reality and AI. The cloud compuEng is NVidia’s fastest growing offshoot. Cloud service providers – Facebook, Amazon, and Microsok have added GPU acceleraEon to their services in a bid to bring professional-grade graphics processing and super-compuEng performance to computers that run on the cloud. Today Honda and BMW use NVIDIA's Tegra GPUs for their Honda Connect and iDrive infotainment systems. Tesla's industry-leading touchscreen infotainment system is also powered by NVIDIA's processors, as is the company's 12.3-inch instrument cluster display. In fact, NVIDIA's GPUs can be found in about 10 million different cars on the road right now. In 2017 CES it announced NVIDIA DRIVE™ -a sensor fusion plauorm for autonomous driving vehicles which Audi is planning on implemenEng it on its next generaEon self-driving cars by 2020. The growth in the professional visualizaEon is complemented by NVDIA’s GPU cloud compuEng plauorm that allows users to carry out enables collaboraEve and interacEve 3D experience on laptops, tablets or even smartphones. The conEnued downward spiral of the OEM will most likely conEnue, but the losses will be offset by the strong growth in the remaining businesses. The combined revenue for automoEve and datacenter is ~ 12% of total, but in the long term, these new markets will allow the company to diversify its product offering and add value to the company. Short-term, however it faces challenges from both Intel and AMD who are aggressively developing both discrete and integrated GPU technologies in the gaming and OEM markets. Yearly revenue 2015-2016 & 2017F-2019F YOY revenue 2015-2016 0 500 1000 1500 2000 2500 3000 3500 4000 4500 5000 2015 2016 2017 2018 2019 Revenue by market (in millons) Gaming Professional Visualization Datacenter Auto OEM & IP 37% -6% 7% 75% 41% 9% 132% 54% -9% Gaming Professional Visualization Datacenter Auto OEM & IP YOY growth-2016-2017 0% 20% 40% 60% 80% 100% Q2 2016Q1 2016Q2 2015 MARKET SHARE AMD NVIDIA Other
- 4. Stock report | NVIDIA Corp | January 27th , 2017 | NASDAQ: NVDA 4 FINANCIAL ANALYSIS (IN MILLIONS, EXCEPT PER SHARE DATA) JAN 2014 JAN 2015 JAN 2016 JAN 2017F JAN 2018F JAN 2019F REVENUE 4,130 4,682 5,010 6,778 7,953 9,441 Gaming 2,058.0 2,818.0 3,968 4,365 4,758 Professional visualizaTon 795.0 750.0 821 903 994 Datacenter 317.0 339.0 786 1,179 1,769 Auto 183.0 320.0 492 739 1,108 OEM & IP 1,329.0 783.0 710 767 813 Cost of revenue 1,862 2,083 2,199 2,975 3,491 4,144 gross profit 2,268 2,599 2,811 3,803 4,462 5,297 OperaYng expenses: Research and development 1,336 1,360 1,331 1,344 1,358 1,371 Sales, general and administraEve 436 480 602 814 956 1,134 Restructuring and other charges - - 131 - - - Total operaEng expenses 1,772 1,840 2,064 2,159 2,313 2,506 Income from operaEons 496 759 747 1,644 2,149 2,791 Interest income 17 28 39 40 42 44 Interest expense (10) (46) (47) (62) (62) (54) other income, net 7 14 4 Income before income tax expense 510 755 743 1,622 2,129 2,782 Income tax expense 70 124 129 276 362 473 Net income $440 $631 $614 $1,346 $1,767 $2,309 Net income per share: Basic $0.75 $1.14 $1.13 $2.50 $3.28 $4.28 Diluted $0.74 $1.12 $1.08 $2.06 $2.71 $3.54 Weighted average shares used in per share ComputaEon: Basic 588 552 543 539 539 539 Diluted 595 563 569 653 653 653 Cash dividends declared paid per common share $0.31 $0.34 $0.40 $0.56 $0.58 $0.60
- 5. Stock report | NVIDIA Corp | January 27th , 2017 | NASDAQ: NVDA 5 SWOT STRENGTHS WEAKNESS • Strong growth in mulEple new market segments • AutomoEve and Datacenter market product yield higher margins • Blockbuster game Etles conEnue to drive graphics-rich gaming • Cloud service providers are increasingly looking to GPUs to power the most complex parts of their cloud compuEng and deep learning technology -- and NVIDIA could benefit in the long term • Leader in AI car compuEng • OEM and WorkstaEon markets conEnued slow down • Lack of presence in mobility market- business overtaken by Intel and Qualcomm • Manufacturing yield and product recall • Significant amount of revenue from a limited number of customers • DiversificaEon in product and markets o 80% of revenue from single product line o 50% revenue from gaming markets • Cyclical nature of discrete GPU market OPPORTUNITIES THREATS • NVDIA DRIVE has a garnered strong interest from the automobile community for autonomous driving vehicles • Growth drivers — gaming, VR, AI, and self- driving cars • Gaming-as- sharing-medium, and VR will fuel NVIDIA’s growth in the new VR gaming market • New products such as SHEILD in TV and gaming markets • PotenEal applicaEon of AI in – manufacturing (FANUC, Japan) and healthcare (Cancer Moonshot) • Self-driving cars for the automoEve industry – potenEally by 2020 with Audi. • AMD market creep into the Discrete GPU market • Possible collaboraEon between AMD and Intel to accelerate the Intel’s development of discrete GPU • Non-renewal of IP licensing with Intel • Earlier adopEon of integrated GPU offered by Intel • Cloud based subscripEon for gaming could soken the demand for high end standalone gaming video cards. • 79% of revenue from overseas market mainly from China and Taiwan- changes in trade policy with China could hamper future revenue