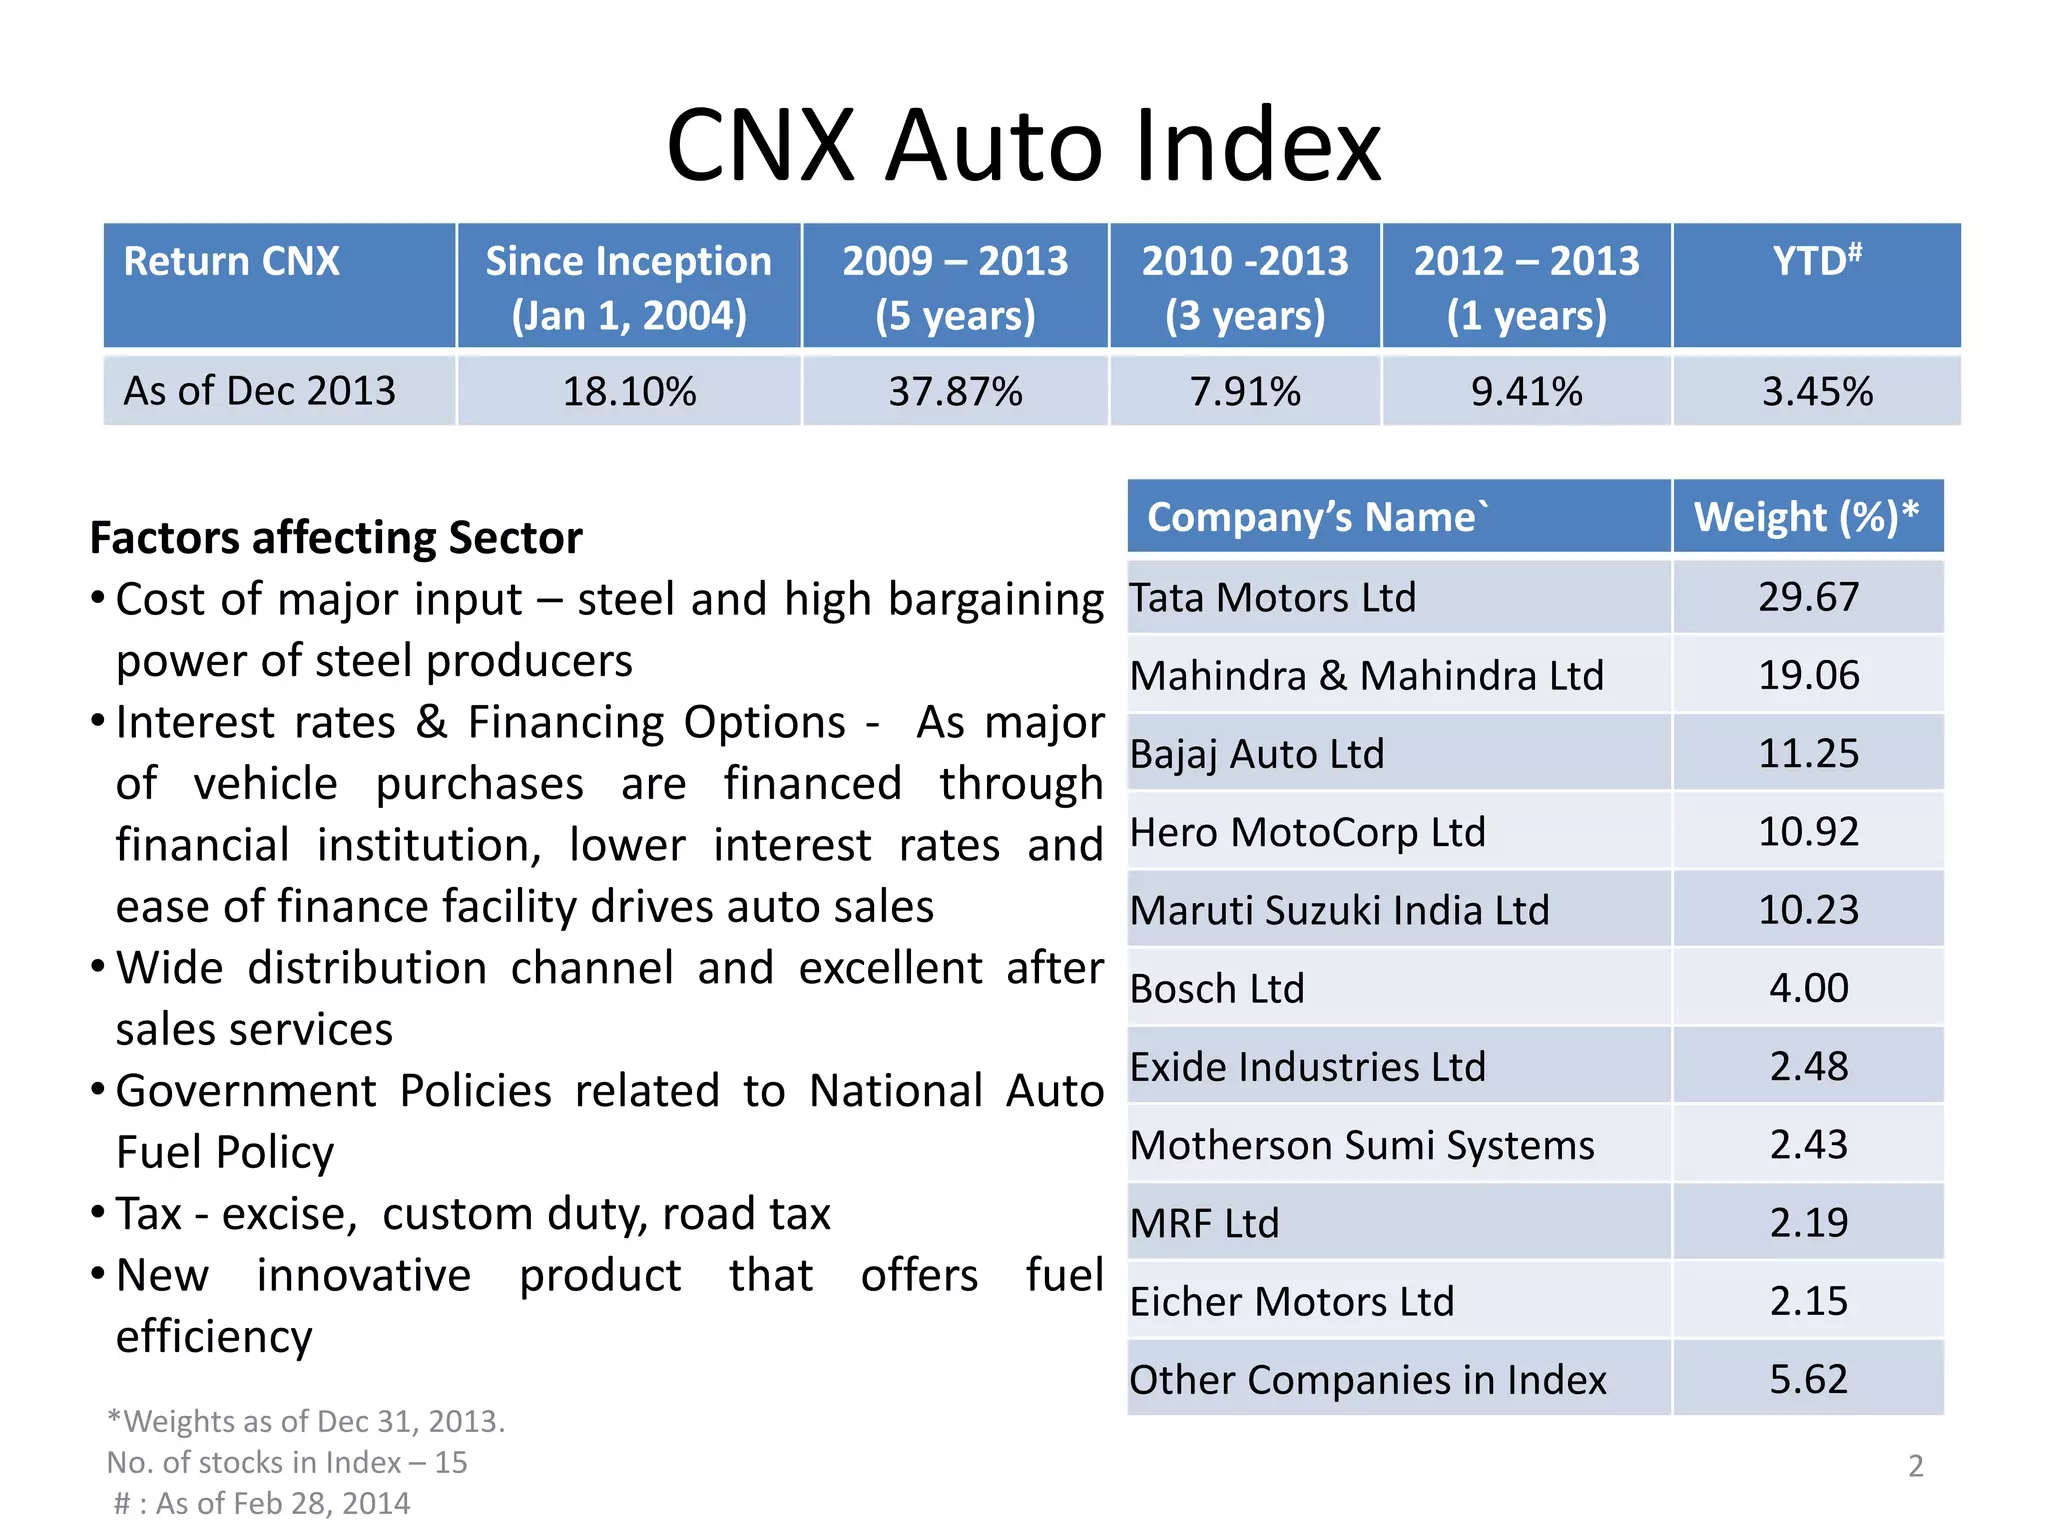
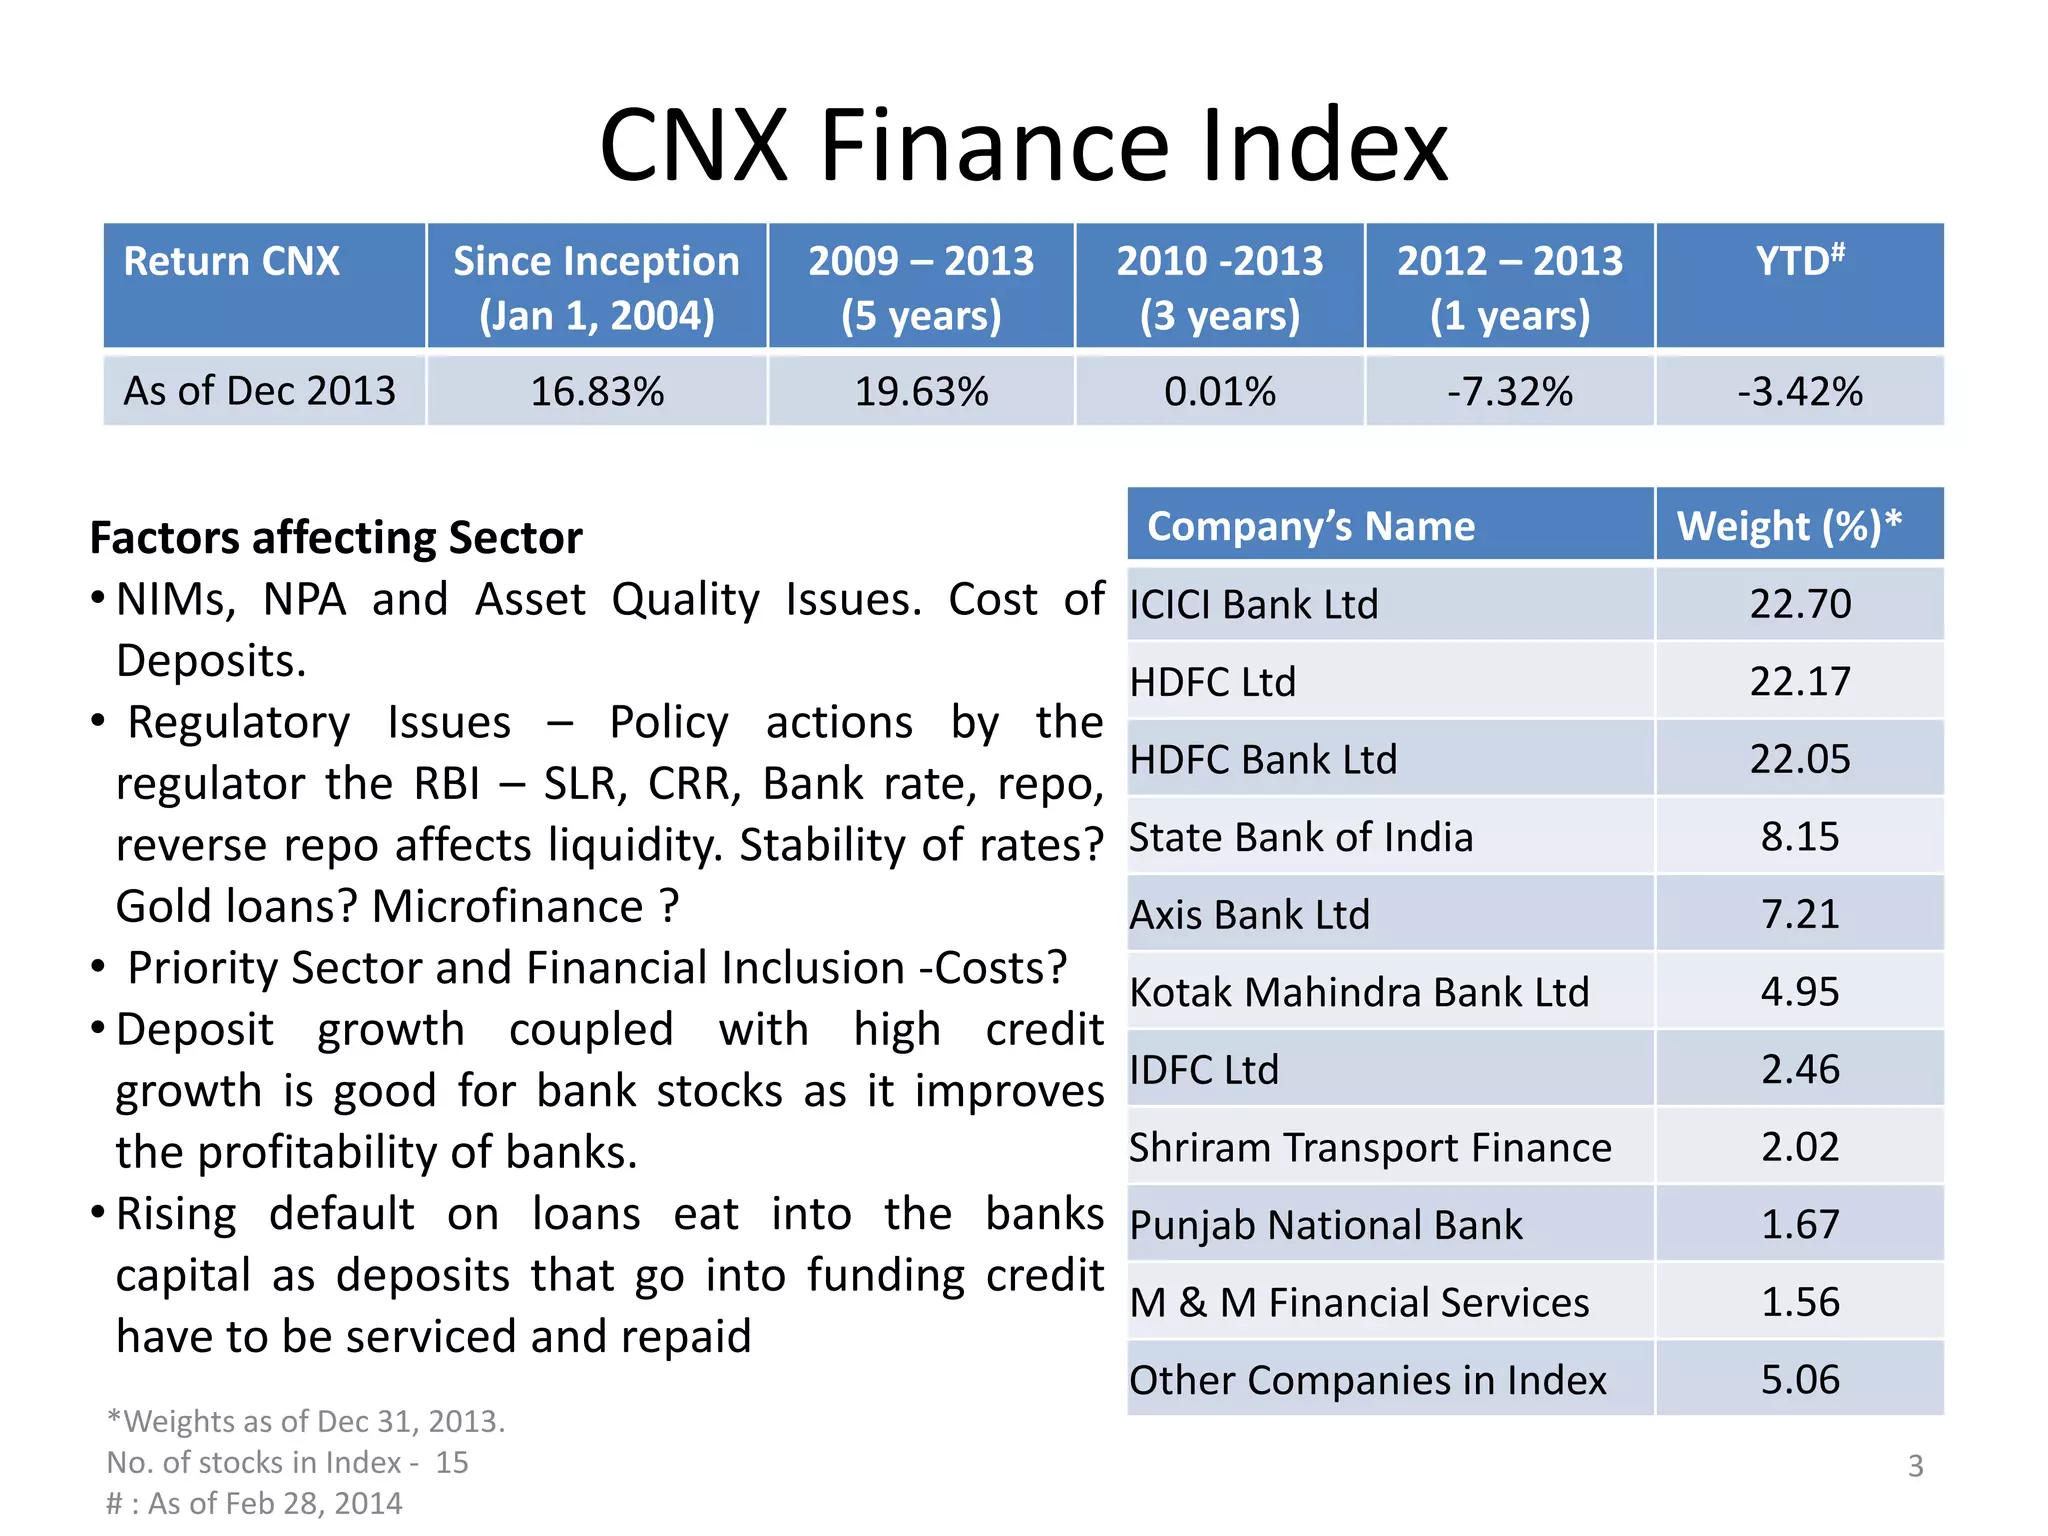
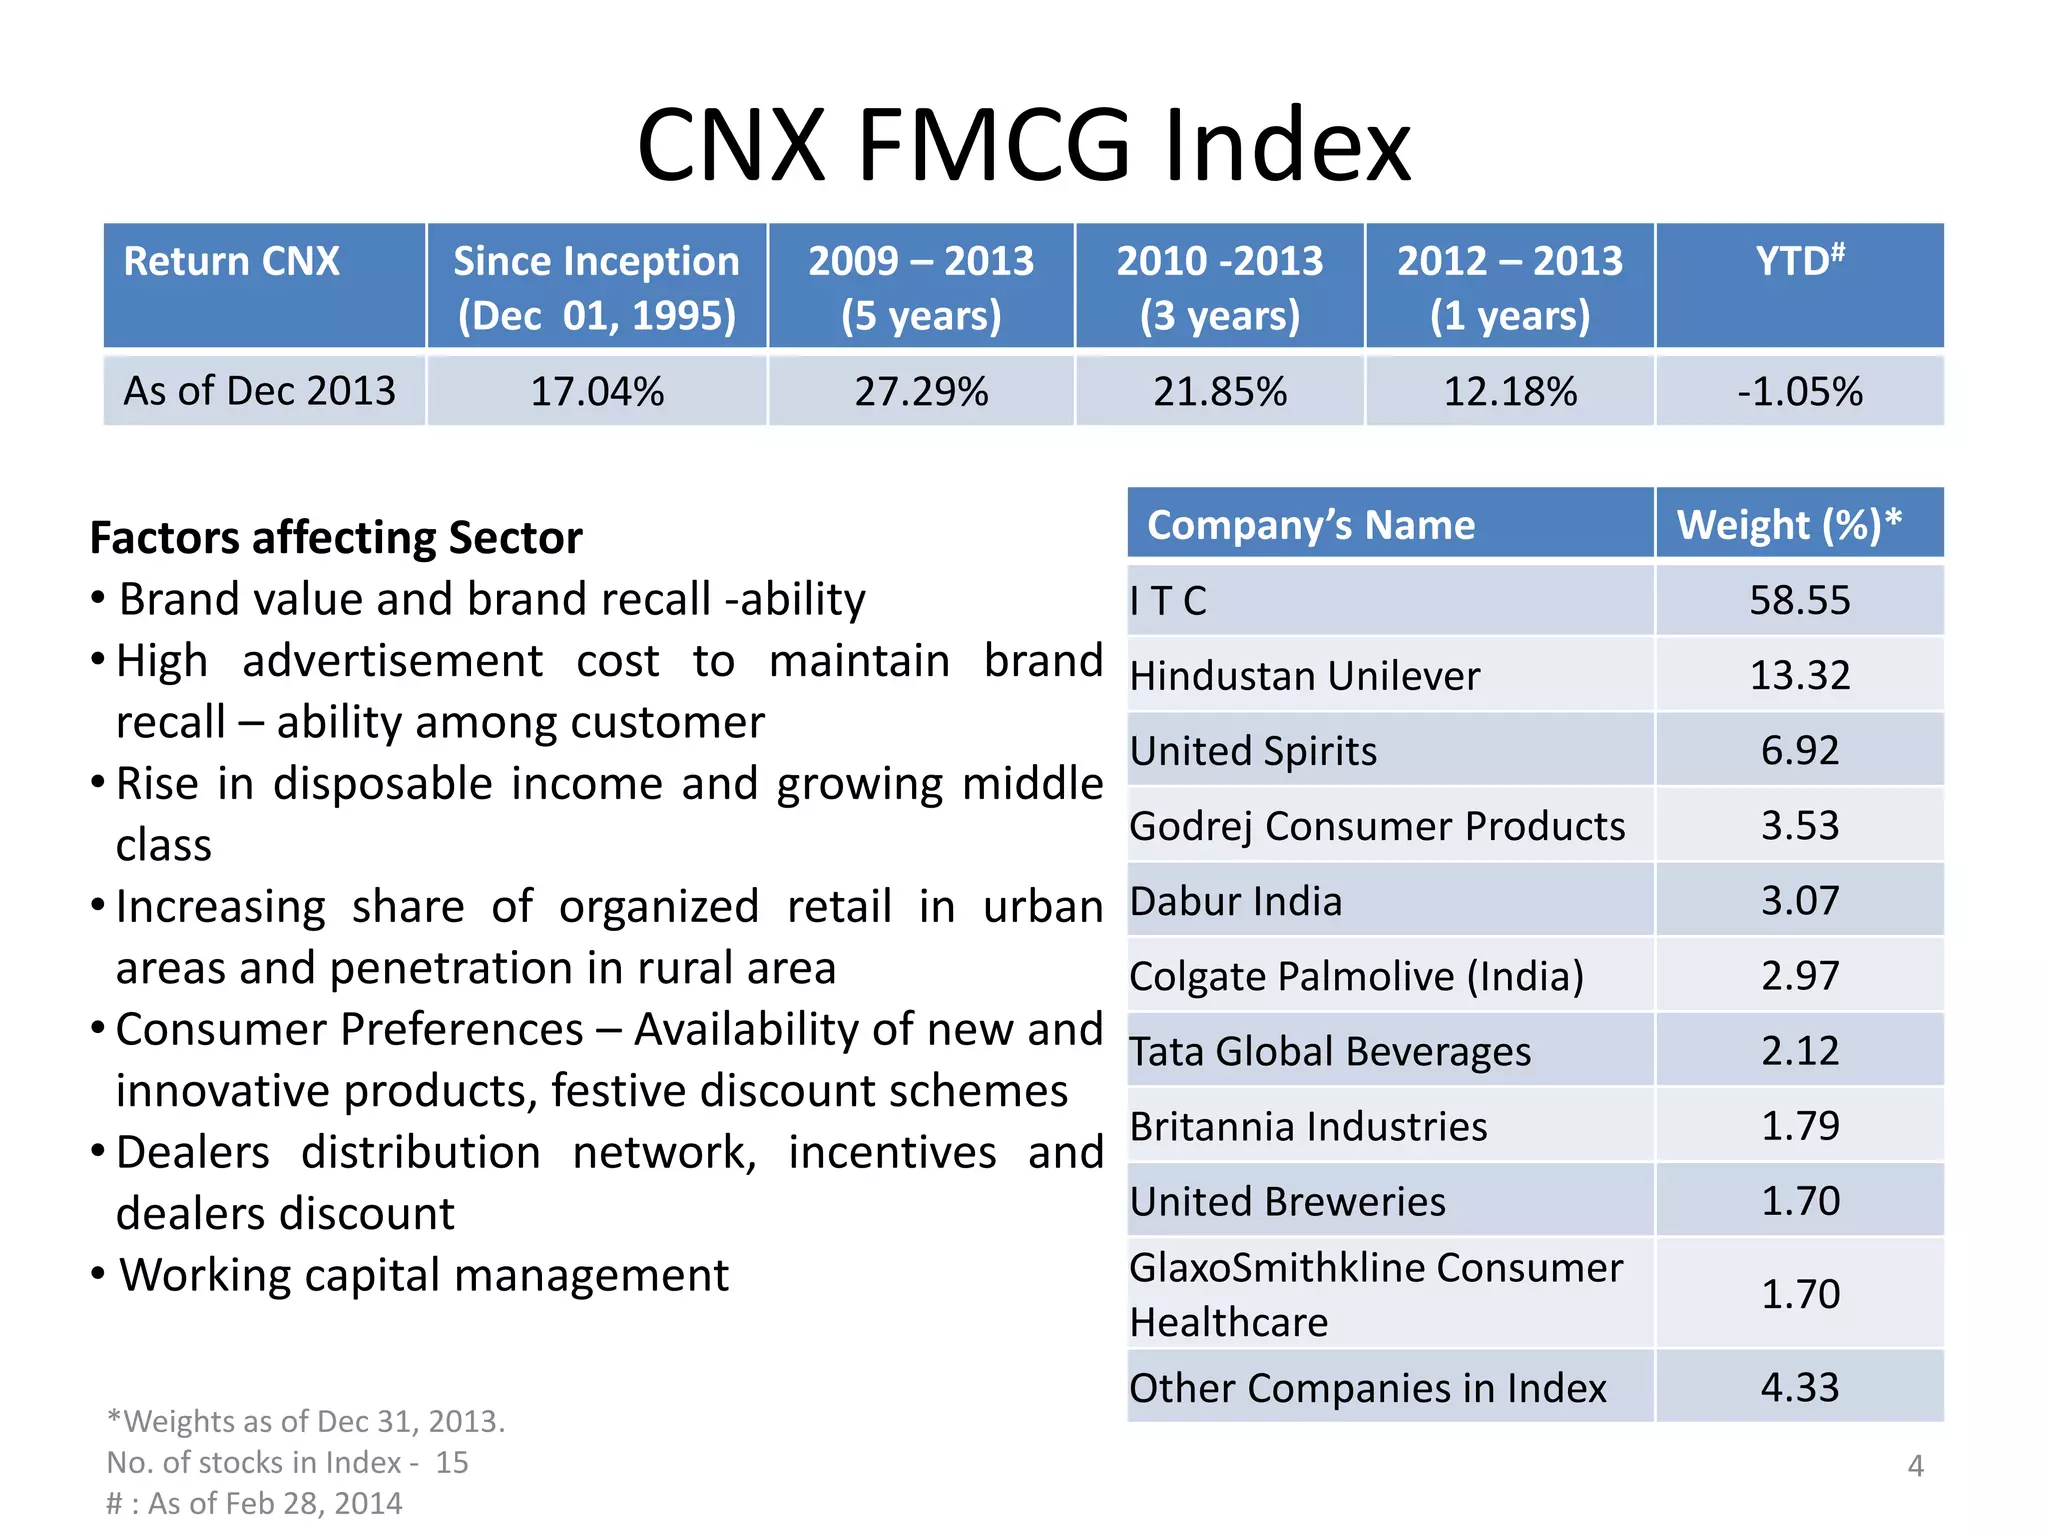
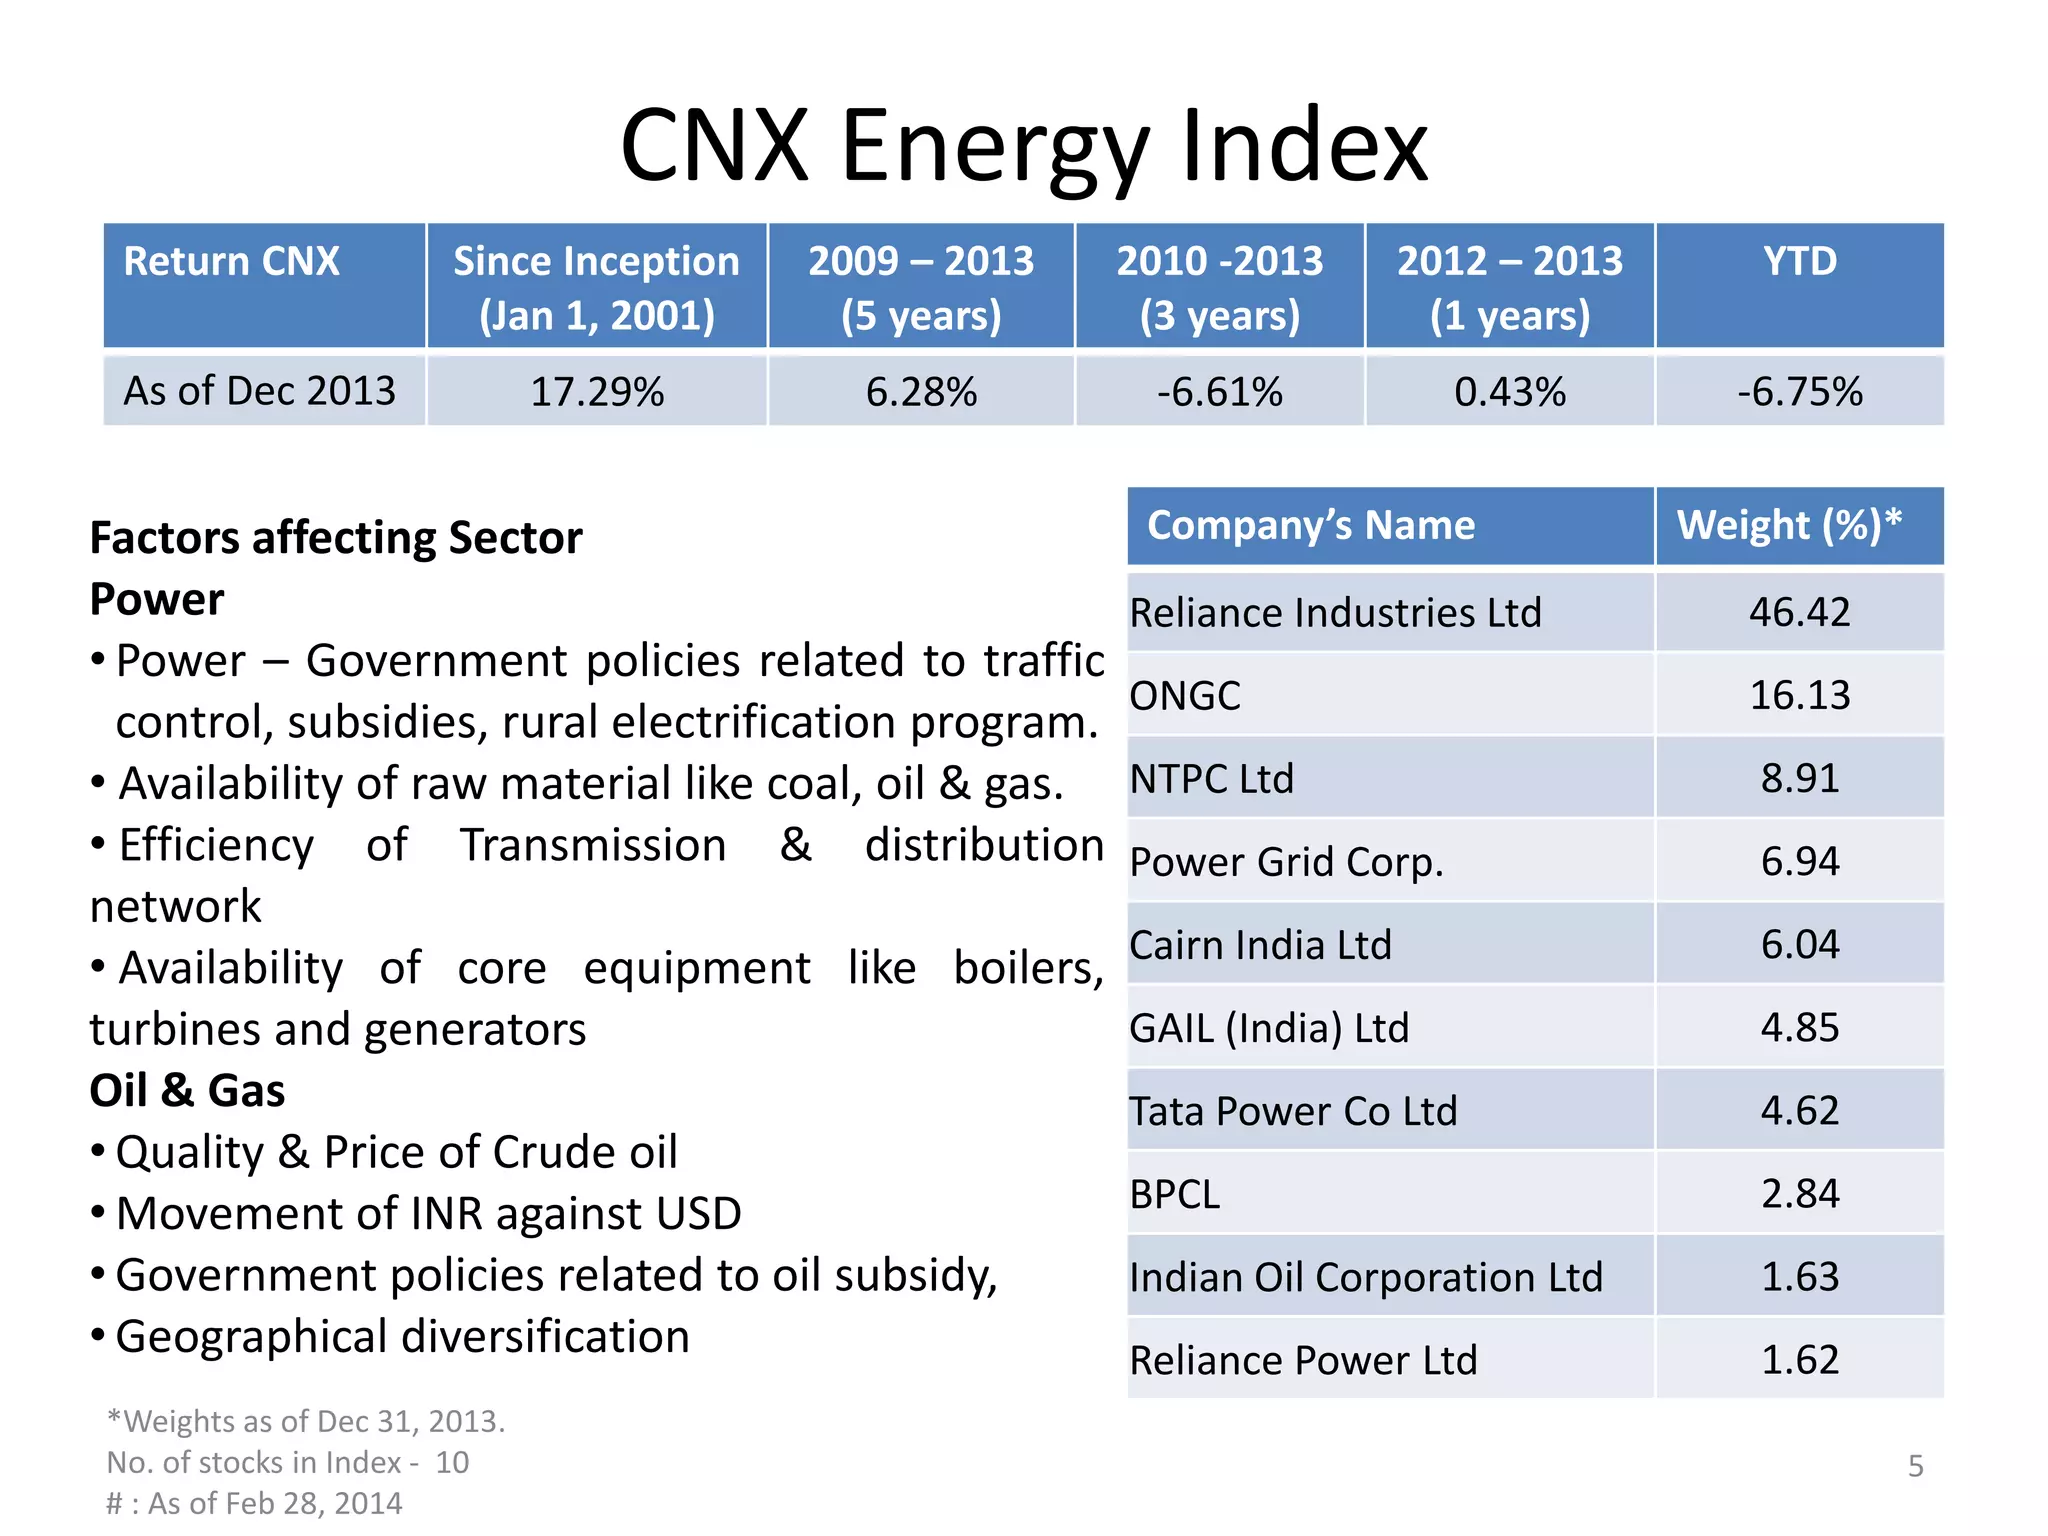
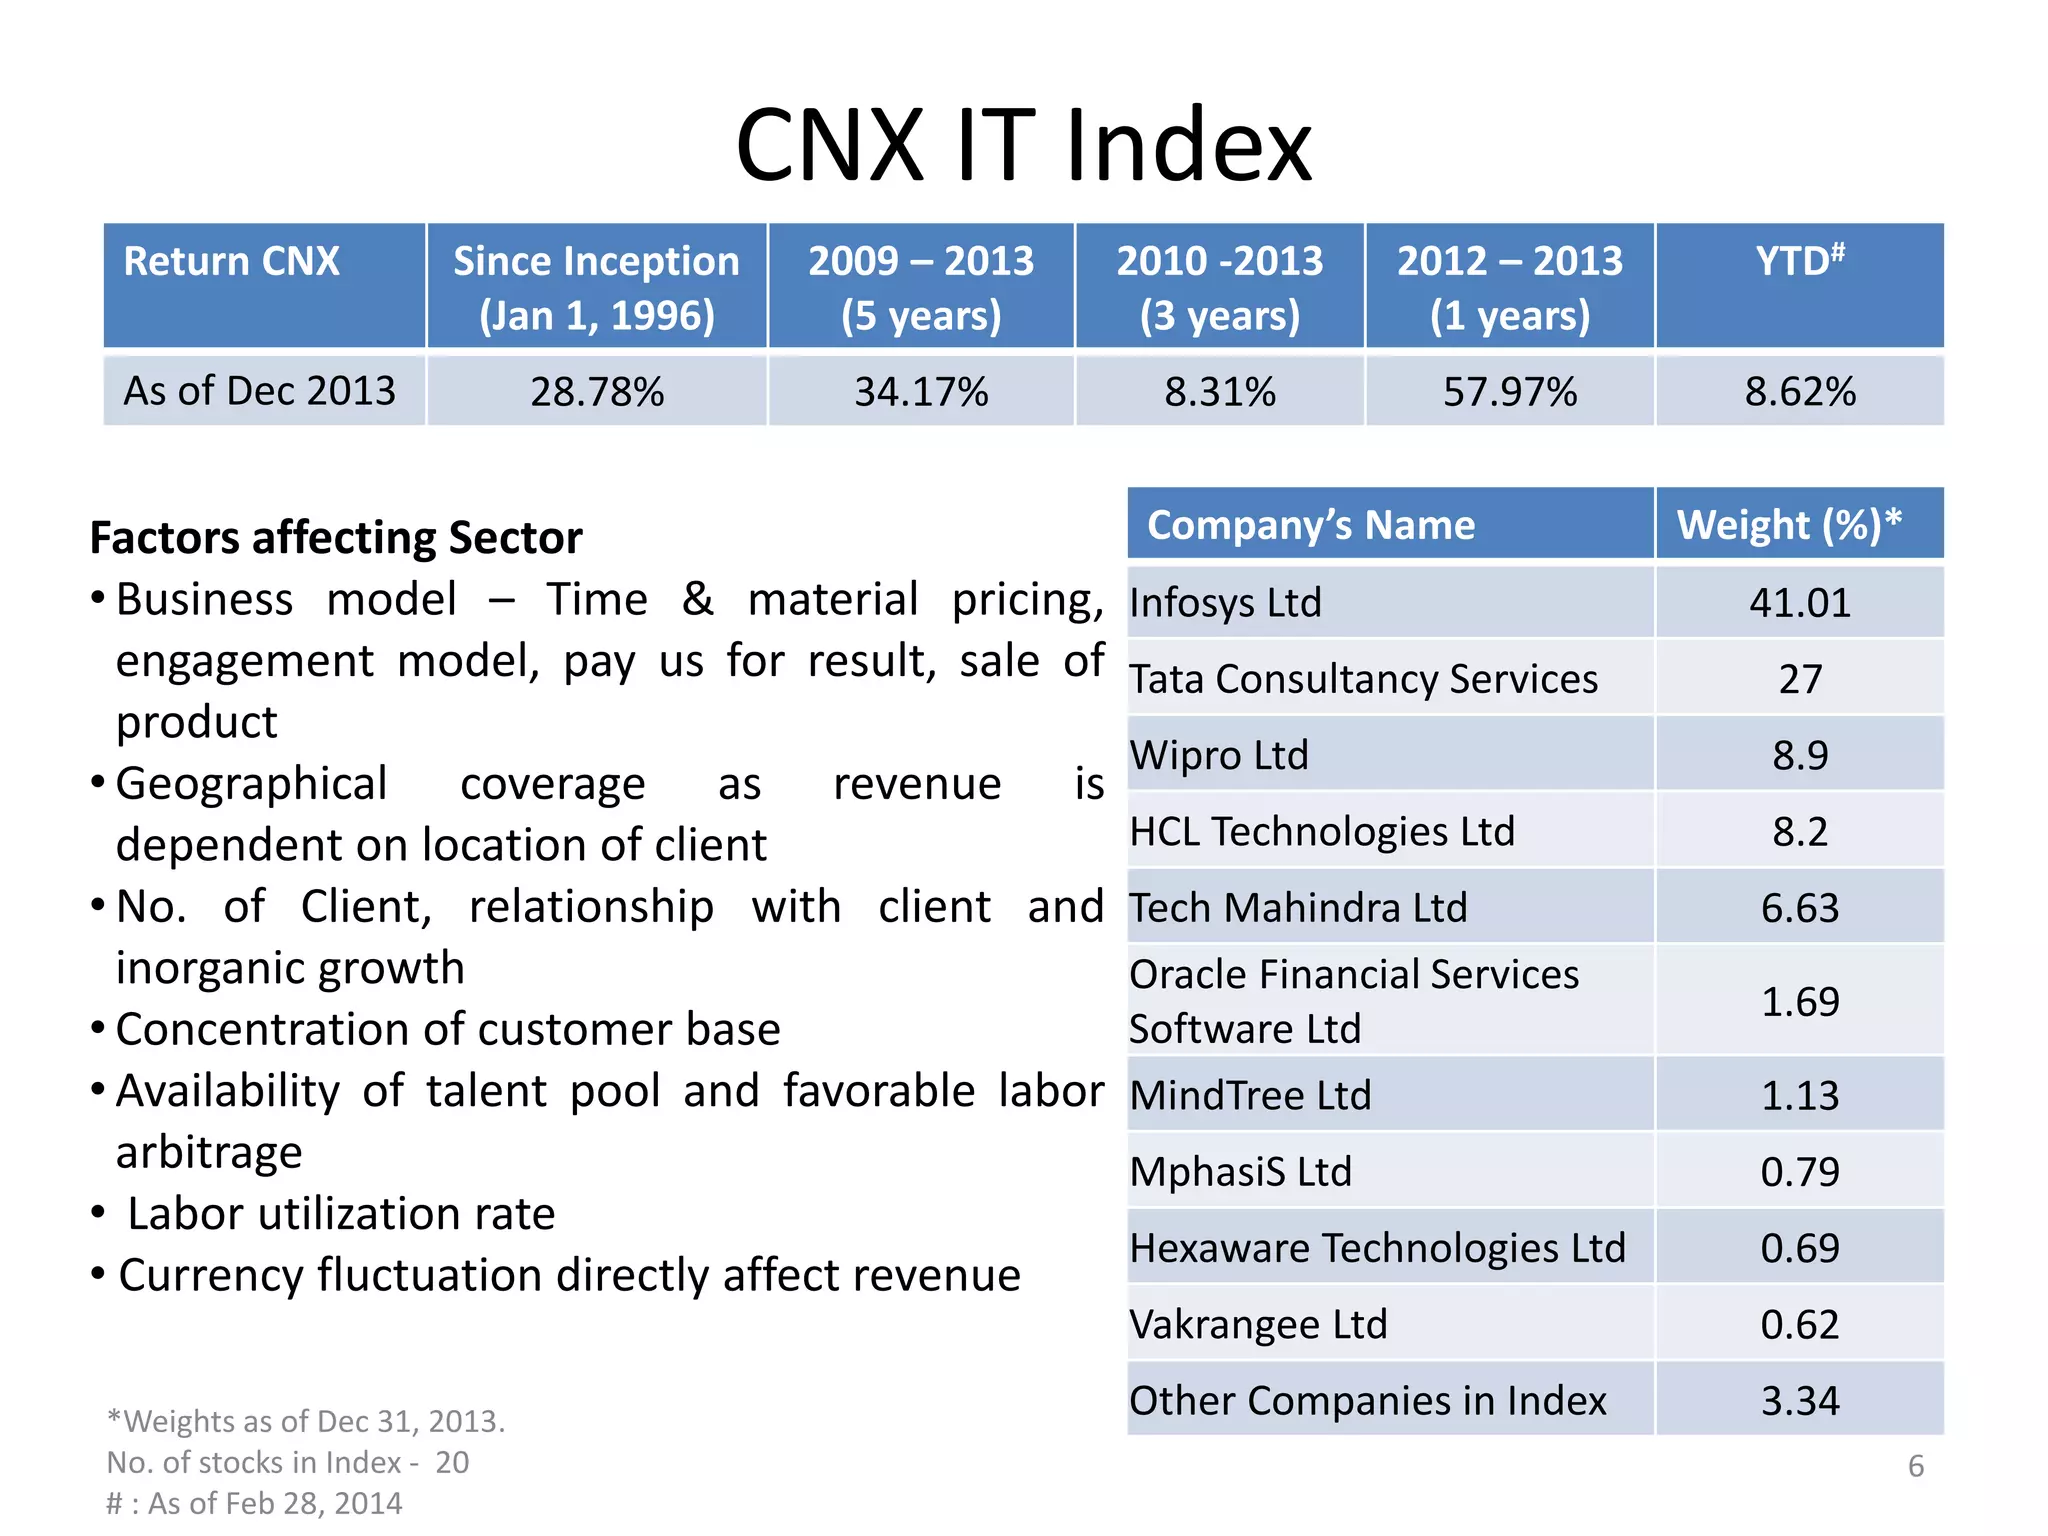
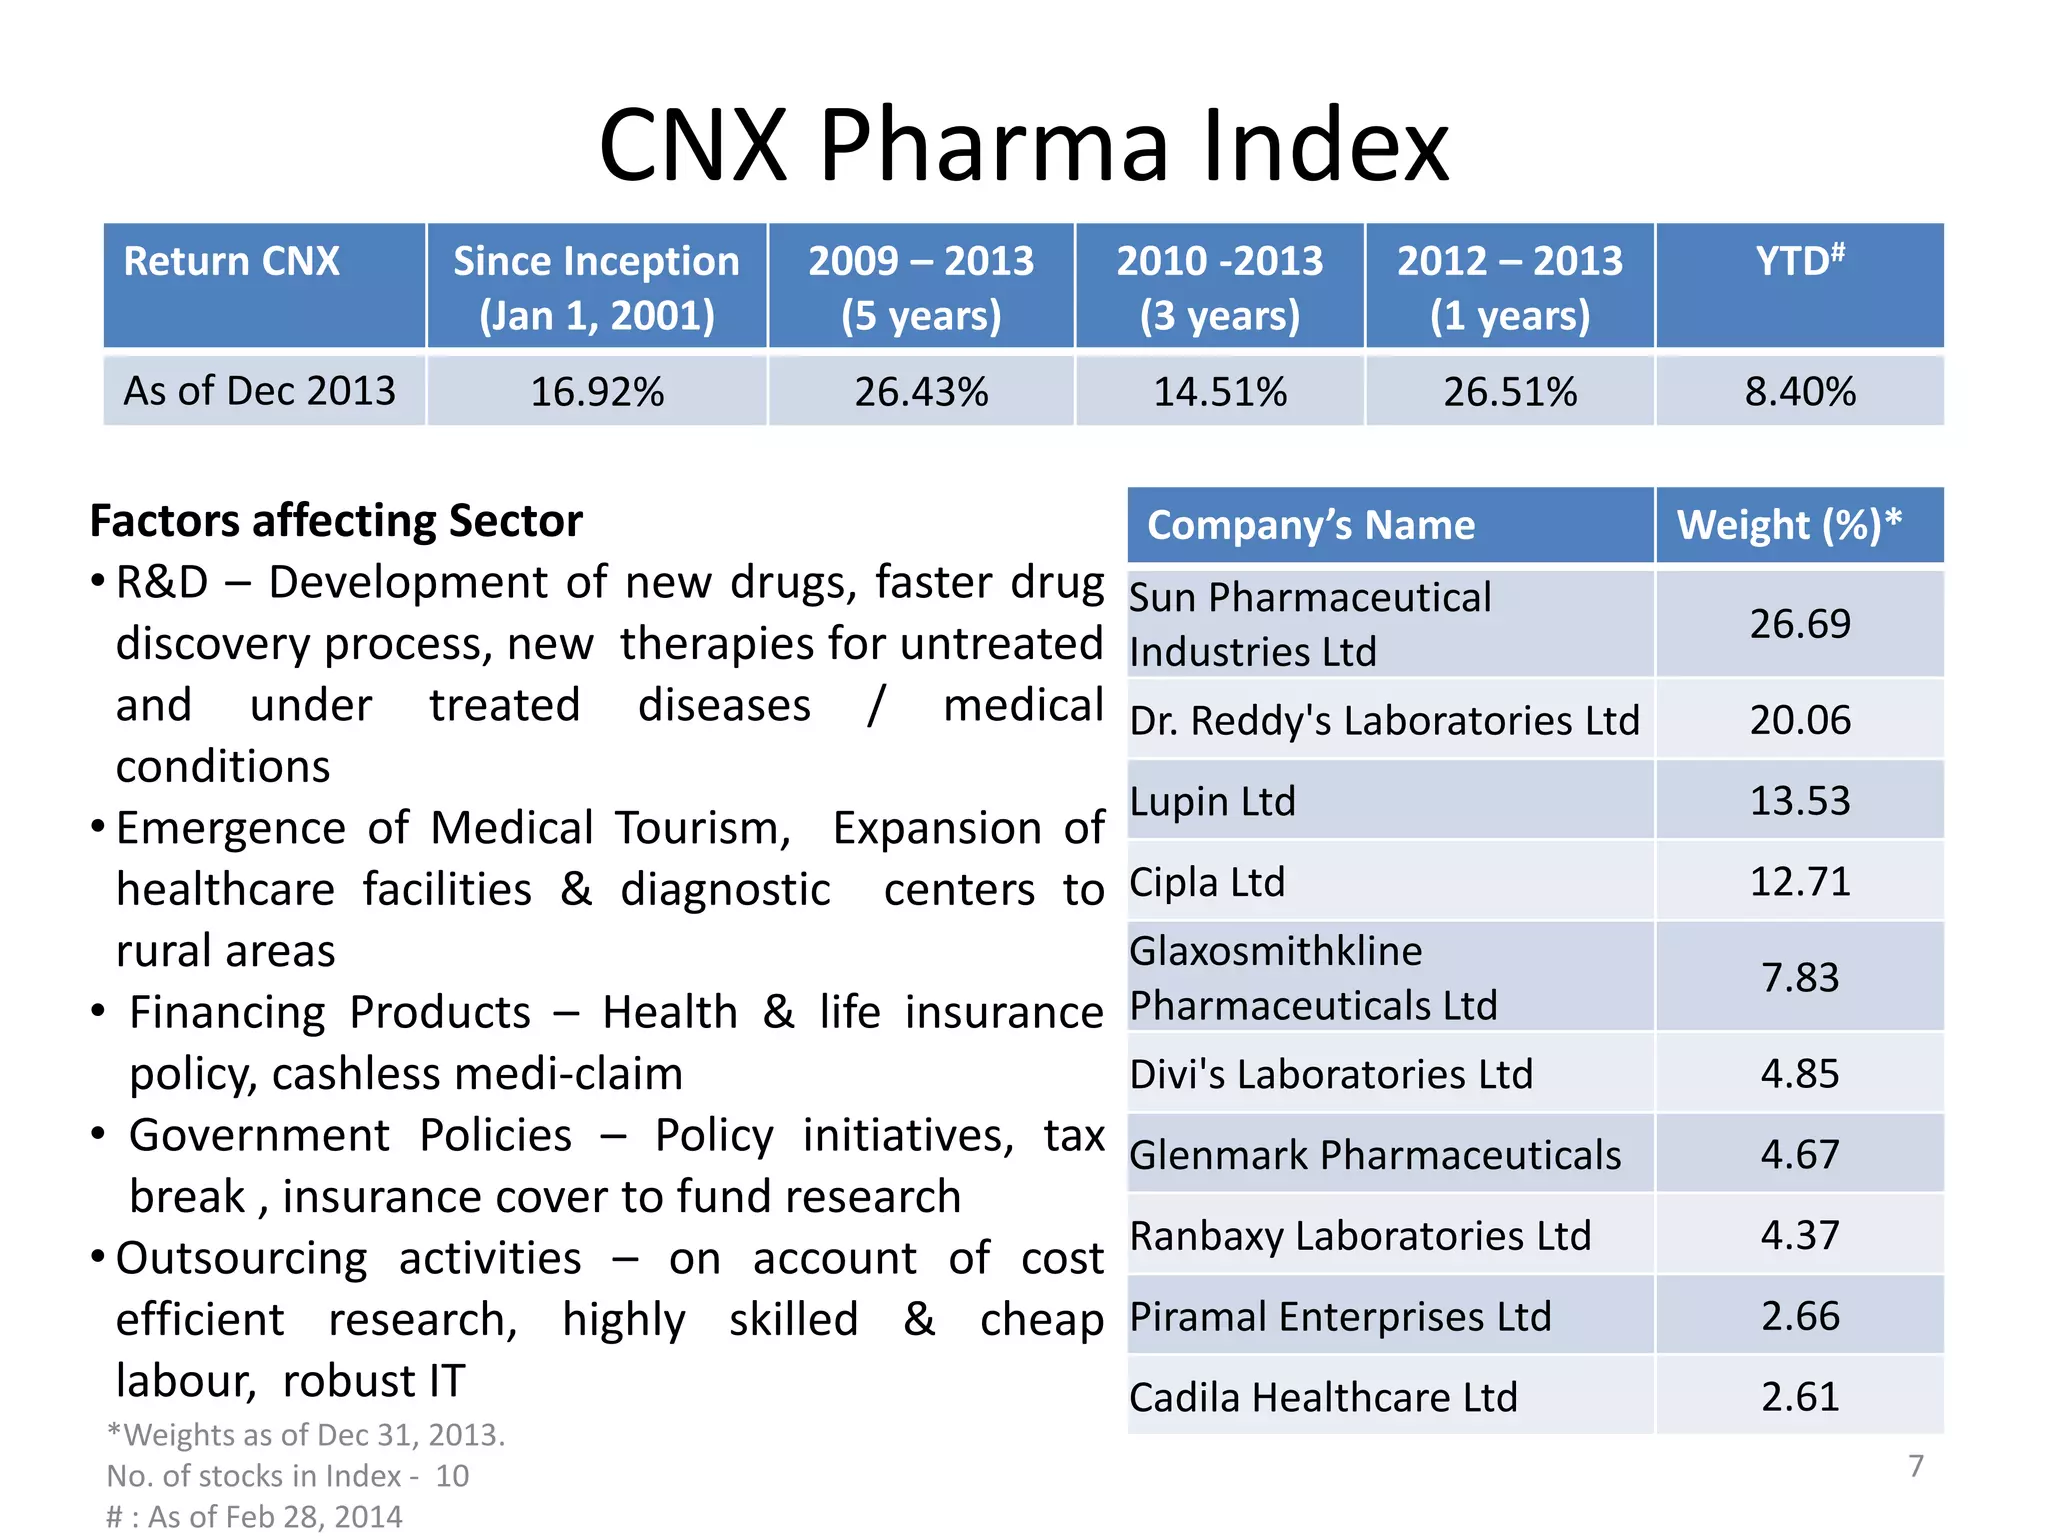
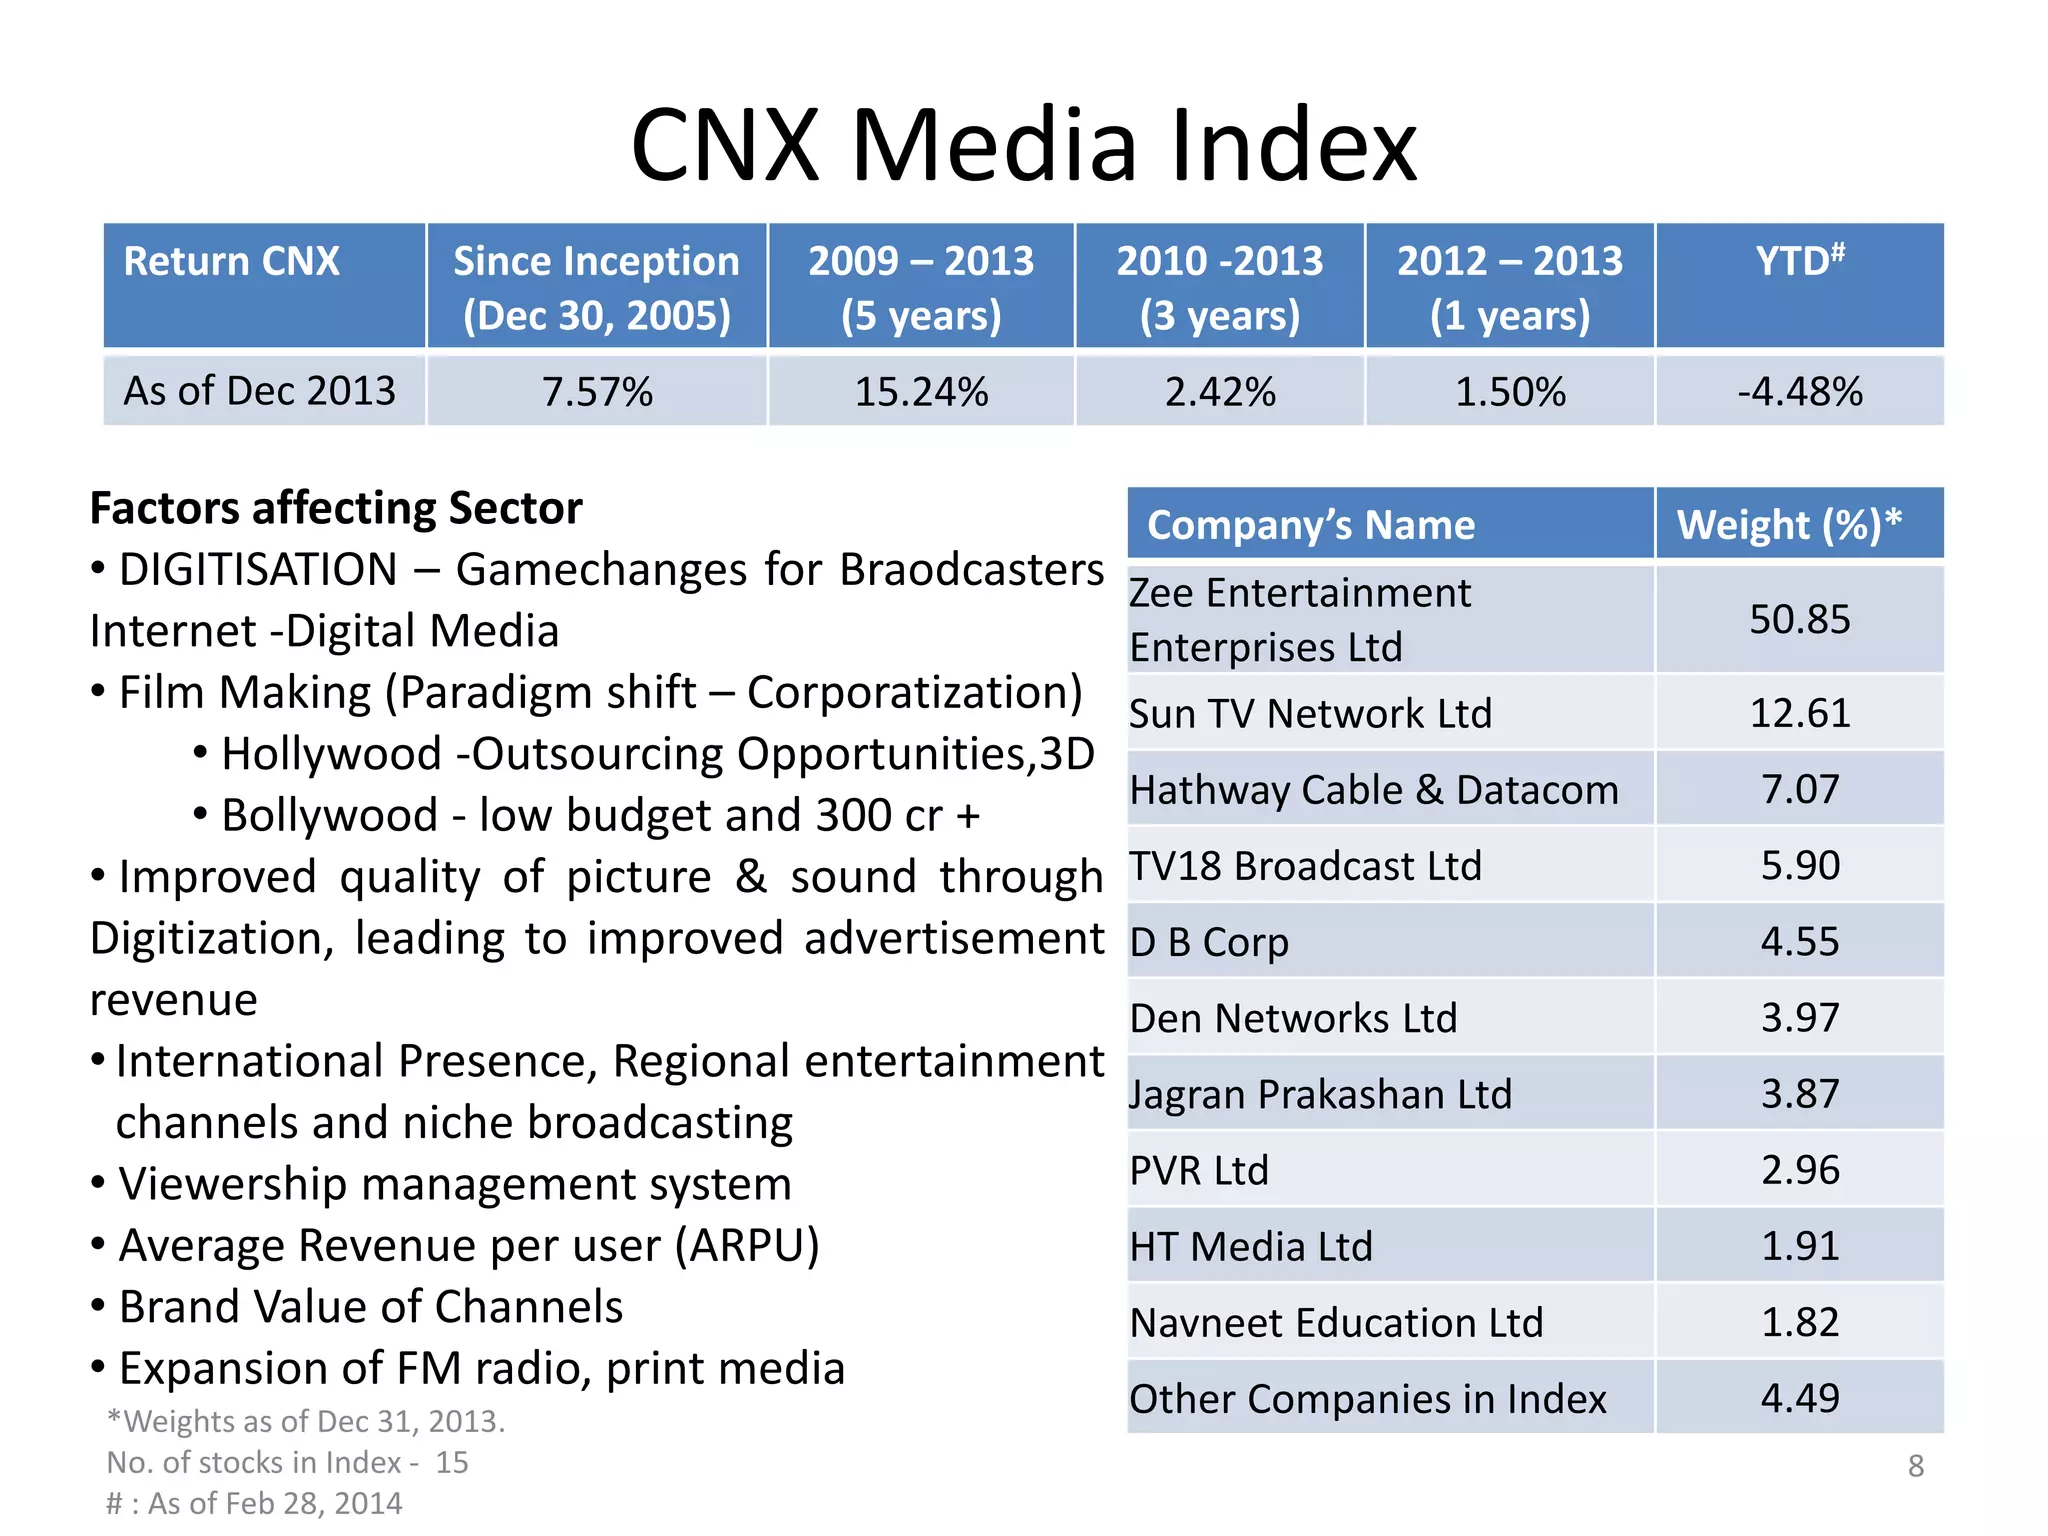
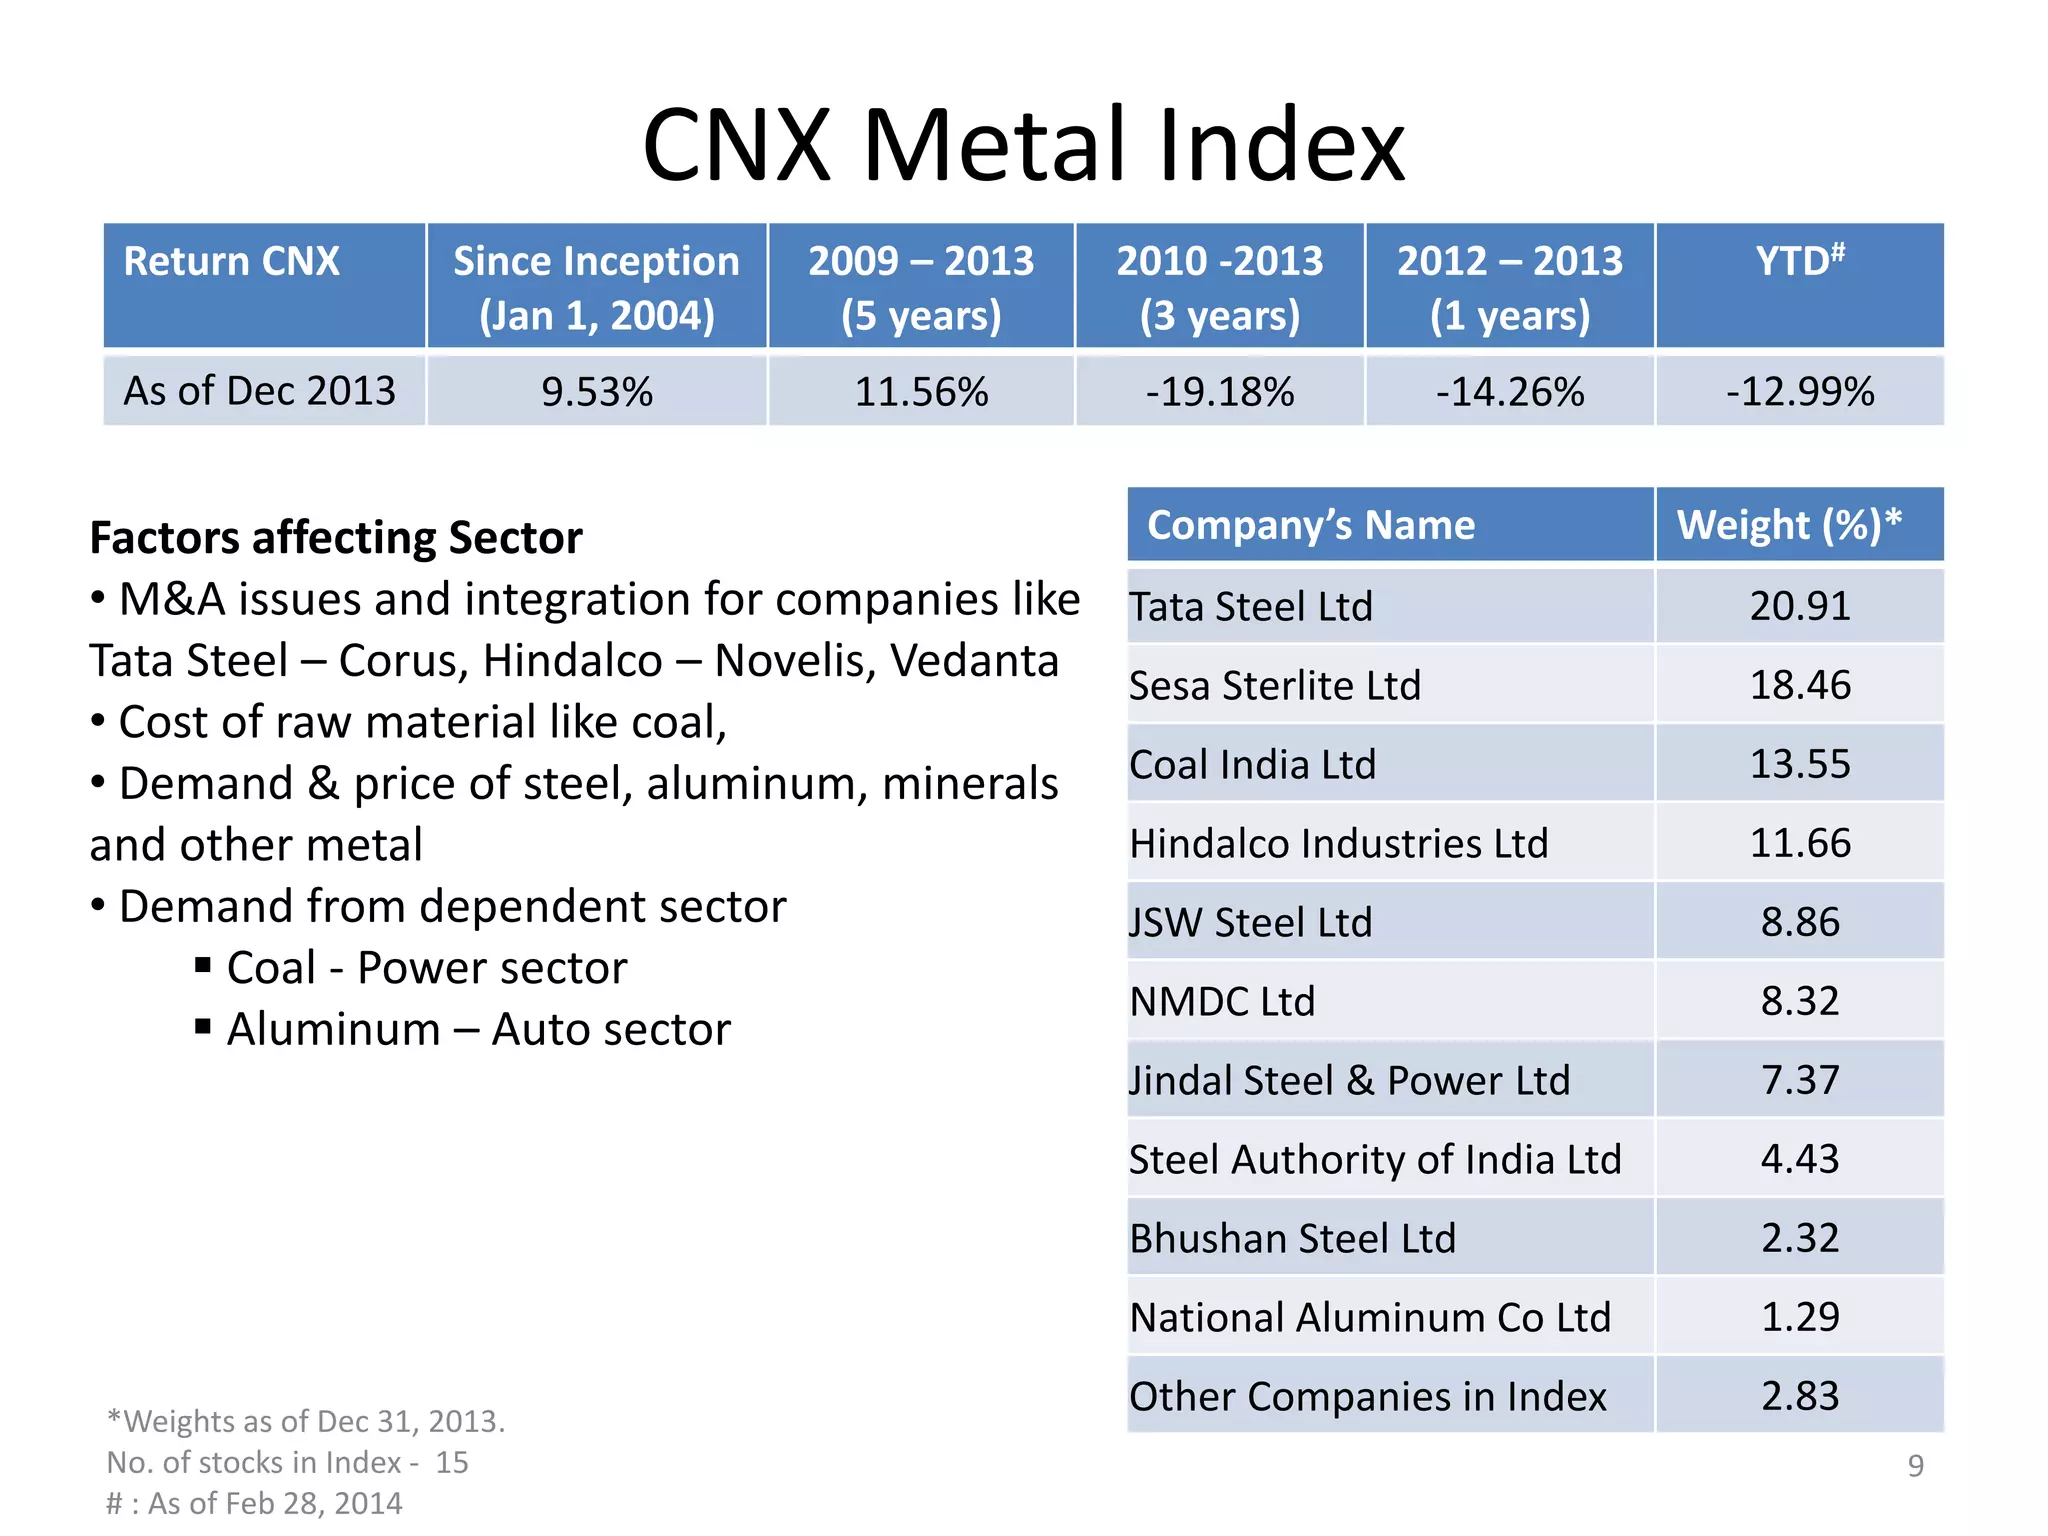
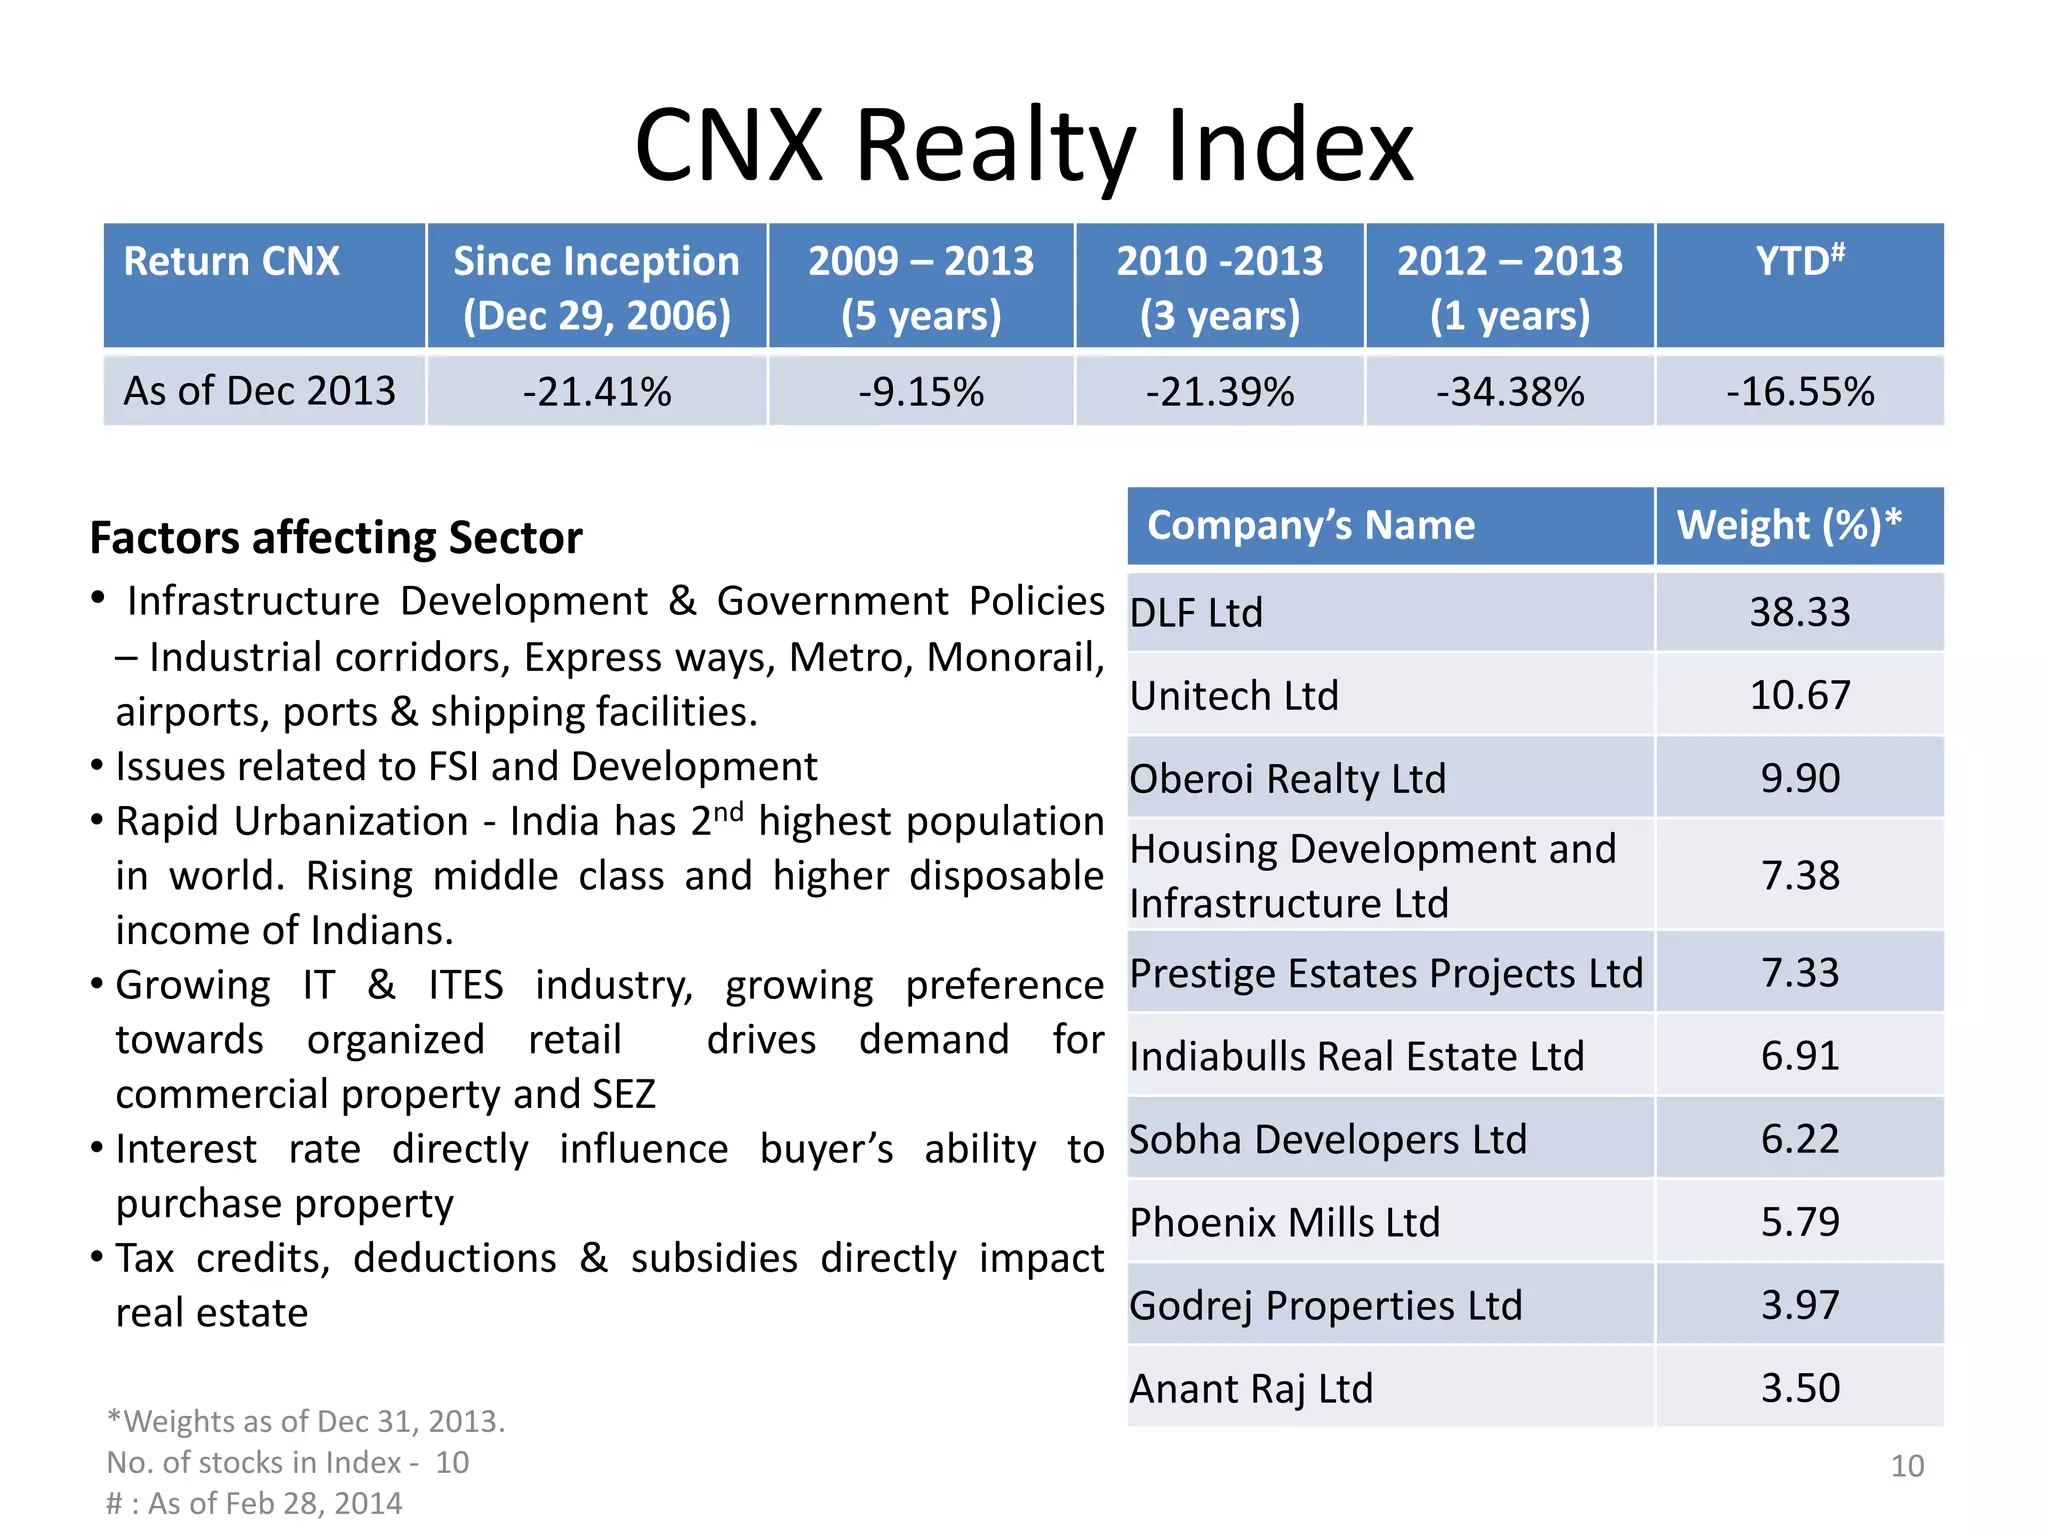
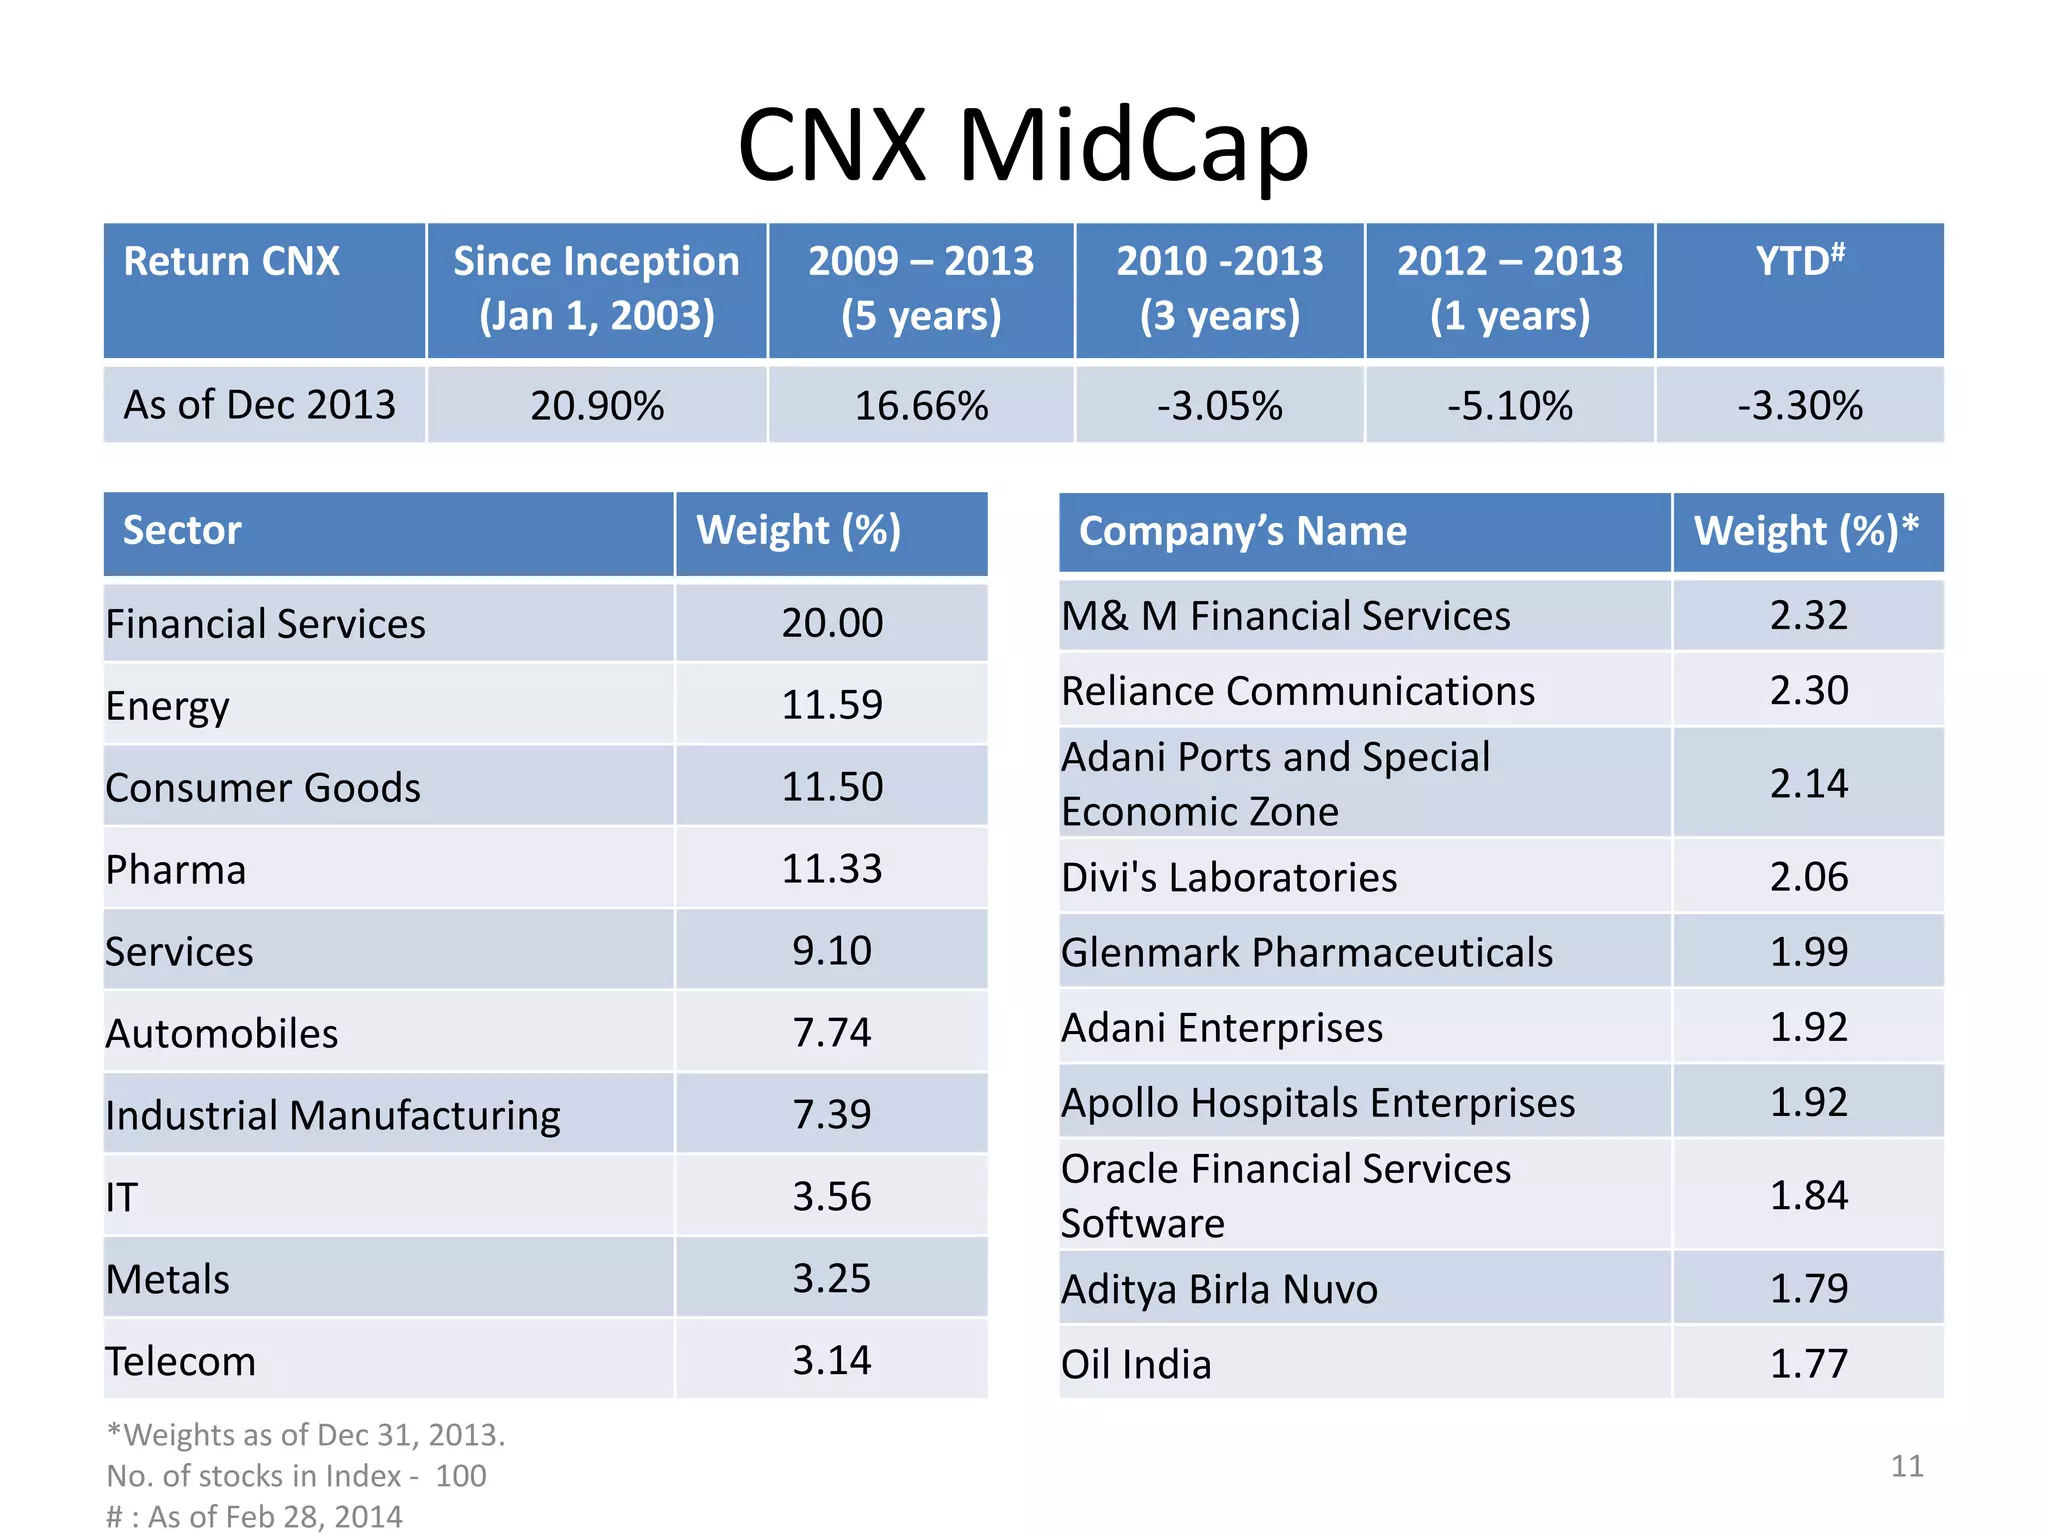
SECTORIAL ANALYSIS
Indian Stock Market Returns
Summary
http://finance-nams.blogspot.com/
CNX Auto Index
Return CNX Since Inception
(Jan 1, 2004)
2009 – 2013
(5 years)
2010 -2013
(3 years)
2012 – 2013
(1 years)
YTD#
As of Dec 2013 18.10% 37.87% 7.91% 9.41% 3.45%
Factors affecting Sector
• Cost of major input – steel and high bargaining
power of steel producers
• Interest rates & Financing Options - As major
of vehicle purchases are financed through
financial institution, lower interest rates and
ease of finance facility drives auto sales
• Wide distribution channel and excellent after
sales services
• Government Policies related to National Auto
Fuel Policy
• Tax - excise, custom duty, road tax
• New innovative product that offers fuel
efficiency
Company’s Name` Weight (%)*
Tata Motors Ltd 29.67
Mahindra & Mahindra Ltd 19.06
Bajaj Auto Ltd 11.25
Hero MotoCorp Ltd 10.92
Maruti Suzuki India Ltd 10.23
Bosch Ltd 4.00
Exide Industries Ltd 2.48
Motherson Sumi Systems 2.43
MRF Ltd 2.19
Eicher Motors Ltd 2.15
Other Companies in Index 5.62
*Weights as of Dec 31, 2013.
No. of stocks in Index – 15
# : As of Feb 28, 2014
2
CNX Finance Index
Return CNX Since Inception
(Jan 1, 2004)
2009 – 2013
(5 years)
2010 -2013
(3 years)
2012 – 2013
(1 years)
YTD#
As of Dec 2013 16.83% 19.63% 0.01% -7.32% -3.42%
Company’s Name Weight (%)*
ICICI Bank Ltd 22.70
HDFC Ltd 22.17
HDFC Bank Ltd 22.05
State Bank of India 8.15
Axis Bank Ltd 7.21
Kotak Mahindra Bank Ltd 4.95
IDFC Ltd 2.46
Shriram Transport Finance 2.02
Punjab National Bank 1.67
M & M Financial Services 1.56
Other Companies in Index 5.06
*Weights as of Dec 31, 2013.
No. of stocks in Index - 15
# : As of Feb 28, 2014
Factors affecting Sector
• NIMs, NPA and Asset Quality Issues. Cost of
Deposits.
• Regulatory Issues – Policy actions by the
regulator the RBI – SLR, CRR, Bank rate, repo,
reverse repo affects liquidity. Stability of rates?
Gold loans? Microfinance ?
• Priority Sector and Financial Inclusion -Costs?
• Deposit growth coupled with high credit
growth is good for bank stocks as it improves
the profitability of banks.
• Rising default on loans eat into the banks
capital as deposits that go into funding credit
have to be serviced and repaid
3
CNX FMCG Index
Return CNX Since Inception
(Dec 01, 1995)
2009 – 2013
(5 years)
2010 -2013
(3 years)
2012 – 2013
(1 years)
YTD#
As of Dec 2013 17.04% 27.29% 21.85% 12.18% -1.05%
Factors affecting Sector
• Brand value and brand recall -ability
• High advertisement cost to maintain brand
recall – ability among customer
• Rise in disposable income and growing middle
class
• Increasing share of organized retail in urban
areas and penetration in rural area
• Consumer Preferences – Availability of new and
innovative products, festive discount schemes
• Dealers distribution network, incentives and
dealers discount
• Working capital management
Company’s Name Weight (%)*
I T C 58.55
Hindustan Unilever 13.32
United Spirits 6.92
Godrej Consumer Products 3.53
Dabur India 3.07
Colgate Palmolive (India) 2.97
Tata Global Beverages 2.12
Britannia Industries 1.79
United Breweries 1.70
GlaxoSmithkline Consumer
Healthcare
1.70
Other Companies in Index 4.33
*Weights as of Dec 31, 2013.
No. of stocks in Index - 15
# : As of Feb 28, 2014
4
CNX Energy Index
Return CNX Since Inception
(Jan 1, 2001)
2009 – 2013
(5 years)
2010 -2013
(3 years)
2012 – 2013
(1 years)
YTD
As of Dec 2013 17.29% 6.28% -6.61% 0.43% -6.75%
Factors affecting Sector
Power
• Power – Government policies related to traffic
control, subsidies, rural electrification program.
• Availability of raw material like coal, oil & gas.
• Efficiency of Transmission & distribution
network
• Availability of core equipment like boilers,
turbines and generators
Oil & Gas
• Quality & Price of Crude oil
• Movement of INR against USD
• Government policies related to oil subsidy,
• Geographical diversification
Company’s Name Weight (%)*
Reliance Industries Ltd 46.42
ONGC 16.13
NTPC Ltd 8.91
Power Grid Corp. 6.94
Cairn India Ltd 6.04
GAIL (India) Ltd 4.85
Tata Power Co Ltd 4.62
BPCL 2.84
Indian Oil Corporation Ltd 1.63
Reliance Power Ltd 1.62
*Weights as of Dec 31, 2013.
No. of stocks in Index - 10
# : As of Feb 28, 2014
5
CNX IT Index
Return CNX Since Inception
(Jan 1, 1996)
2009 – 2013
(5 years)
2010 -2013
(3 years)
2012 – 2013
(1 years)
YTD#
As of Dec 2013 28.78% 34.17% 8.31% 57.97% 8.62%
Factors affecting Sector
• Business model – Time & material pricing,
engagement model, pay us for result, sale of
product
• Geographical coverage as revenue is
dependent on location of client
• No. of Client, relationship with client and
inorganic growth
• Concentration of customer base
• Availability of talent pool and favorable labor
arbitrage
• Labor utilization rate
• Currency fluctuation directly affect revenue
Company’s Name Weight (%)*
Infosys Ltd 41.01
Tata Consultancy Services 27
Wipro Ltd 8.9
HCL Technologies Ltd 8.2
Tech Mahindra Ltd 6.63
Oracle Financial Services
Software Ltd
1.69
MindTree Ltd 1.13
MphasiS Ltd 0.79
Hexaware Technologies Ltd 0.69
Vakrangee Ltd 0.62
Other Companies in Index 3.34*Weights as of Dec 31, 2013.
No. of stocks in Index - 20
# : As of Feb 28, 2014
6
CNX Pharma Index
Return CNX Since Inception
(Jan 1, 2001)
2009 – 2013
(5 years)
2010 -2013
(3 years)
2012 – 2013
(1 years)
YTD#
As of Dec 2013 16.92% 26.43% 14.51% 26.51% 8.40%
Factors affecting Sector
• R&D – Development of new drugs, faster drug
discovery process, new therapies for untreated
and under treated diseases / medical
conditions
• Emergence of Medical Tourism, Expansion of
healthcare facilities & diagnostic centers to
rural areas
• Financing Products – Health & life insurance
policy, cashless medi-claim
• Government Policies – Policy initiatives, tax
break , insurance cover to fund research
• Outsourcing activities – on account of cost
efficient research, highly skilled & cheap
labour, robust IT
Company’s Name Weight (%)*
Sun Pharmaceutical
Industries Ltd
26.69
Dr. Reddy's Laboratories Ltd 20.06
Lupin Ltd 13.53
Cipla Ltd 12.71
Glaxosmithkline
Pharmaceuticals Ltd
7.83
Divi's Laboratories Ltd 4.85
Glenmark Pharmaceuticals 4.67
Ranbaxy Laboratories Ltd 4.37
Piramal Enterprises Ltd 2.66
Cadila Healthcare Ltd 2.61
*Weights as of Dec 31, 2013.
No. of stocks in Index - 10
# : As of Feb 28, 2014
7
CNX Media Index
Return CNX Since Inception
(Dec 30, 2005)
2009 – 2013
(5 years)
2010 -2013
(3 years)
2012 – 2013
(1 years)
YTD#
As of Dec 2013 7.57% 15.24% 2.42% 1.50% -4.48%
Factors affecting Sector
• DIGITISATION – Gamechanges for Braodcasters
Internet -Digital Media
• Film Making (Paradigm shift – Corporatization)
• Hollywood -Outsourcing Opportunities,3D
• Bollywood - low budget and 300 cr +
• Improved quality of picture & sound through
Digitization, leading to improved advertisement
revenue
• International Presence, Regional entertainment
channels and niche broadcasting
• Viewership management system
• Average Revenue per user (ARPU)
• Brand Value of Channels
• Expansion of FM radio, print media
Company’s Name Weight (%)*
Zee Entertainment
Enterprises Ltd
50.85
Sun TV Network Ltd 12.61
Hathway Cable & Datacom 7.07
TV18 Broadcast Ltd 5.90
D B Corp 4.55
Den Networks Ltd 3.97
Jagran Prakashan Ltd 3.87
PVR Ltd 2.96
HT Media Ltd 1.91
Navneet Education Ltd 1.82
Other Companies in Index 4.49*Weights as of Dec 31, 2013.
No. of stocks in Index - 15
# : As of Feb 28, 2014
8
CNX Metal Index
Return CNX Since Inception
(Jan 1, 2004)
2009 – 2013
(5 years)
2010 -2013
(3 years)
2012 – 2013
(1 years)
YTD#
As of Dec 2013 9.53% 11.56% -19.18% -14.26% -12.99%
Factors affecting Sector
• M&A issues and integration for companies like
Tata Steel – Corus, Hindalco – Novelis, Vedanta
• Cost of raw material like coal,
• Demand & price of steel, aluminum, minerals
and other metal
• Demand from dependent sector
 Coal - Power sector
 Aluminum – Auto sector
Company’s Name Weight (%)*
Tata Steel Ltd 20.91
Sesa Sterlite Ltd 18.46
Coal India Ltd 13.55
Hindalco Industries Ltd 11.66
JSW Steel Ltd 8.86
NMDC Ltd 8.32
Jindal Steel & Power Ltd 7.37
Steel Authority of India Ltd 4.43
Bhushan Steel Ltd 2.32
National Aluminum Co Ltd 1.29
Other Companies in Index 2.83*Weights as of Dec 31, 2013.
No. of stocks in Index - 15
# : As of Feb 28, 2014
9
CNX Realty Index
Return CNX Since Inception
(Dec 29, 2006)
2009 – 2013
(5 years)
2010 -2013
(3 years)
2012 – 2013
(1 years)
YTD#
As of Dec 2013 -21.41% -9.15% -21.39% -34.38% -16.55%
Factors affecting Sector
• Infrastructure Development & Government Policies
– Industrial corridors, Express ways, Metro, Monorail,
airports, ports & shipping facilities.
• Issues related to FSI and Development
• Rapid Urbanization - India has 2nd highest population
in world. Rising middle class and higher disposable
income of Indians.
• Growing IT & ITES industry, growing preference
towards organized retail drives demand for
commercial property and SEZ
• Interest rate directly influence buyer’s ability to
purchase property
• Tax credits, deductions & subsidies directly impact
real estate
Company’s Name Weight (%)*
DLF Ltd 38.33
Unitech Ltd 10.67
Oberoi Realty Ltd 9.90
Housing Development and
Infrastructure Ltd
7.38
Prestige Estates Projects Ltd 7.33
Indiabulls Real Estate Ltd 6.91
Sobha Developers Ltd 6.22
Phoenix Mills Ltd 5.79
Godrej Properties Ltd 3.97
Anant Raj Ltd 3.50
*Weights as of Dec 31, 2013.
No. of stocks in Index - 10
# : As of Feb 28, 2014
10
CNX MidCap
Return CNX Since Inception
(Jan 1, 2003)
2009 – 2013
(5 years)
2010 -2013
(3 years)
2012 – 2013
(1 years)
YTD#
As of Dec 2013 20.90% 16.66% -3.05% -5.10% -3.30%
Company’s Name Weight (%)*
M& M Financial Services 2.32
Reliance Communications 2.30
Adani Ports and Special
Economic Zone
2.14
Divi's Laboratories 2.06
Glenmark Pharmaceuticals 1.99
Adani Enterprises 1.92
Apollo Hospitals Enterprises 1.92
Oracle Financial Services
Software
1.84
Aditya Birla Nuvo 1.79
Oil India 1.77
Sector Weight (%)
Financial Services 20.00
Energy 11.59
Consumer Goods 11.50
Pharma 11.33
Services 9.10
Automobiles 7.74
Industrial Manufacturing 7.39
IT 3.56
Metals 3.25
Telecom 3.14
*Weights as of Dec 31, 2013.
No. of stocks in Index - 100
# : As of Feb 28, 2014
11
Thank You

Stock market returns summary

  • 1.
    SECTORIAL ANALYSIS Indian StockMarket Returns Summary http://finance-nams.blogspot.com/
  • 2.
    CNX Auto Index ReturnCNX Since Inception (Jan 1, 2004) 2009 – 2013 (5 years) 2010 -2013 (3 years) 2012 – 2013 (1 years) YTD# As of Dec 2013 18.10% 37.87% 7.91% 9.41% 3.45% Factors affecting Sector • Cost of major input – steel and high bargaining power of steel producers • Interest rates & Financing Options - As major of vehicle purchases are financed through financial institution, lower interest rates and ease of finance facility drives auto sales • Wide distribution channel and excellent after sales services • Government Policies related to National Auto Fuel Policy • Tax - excise, custom duty, road tax • New innovative product that offers fuel efficiency Company’s Name` Weight (%)* Tata Motors Ltd 29.67 Mahindra & Mahindra Ltd 19.06 Bajaj Auto Ltd 11.25 Hero MotoCorp Ltd 10.92 Maruti Suzuki India Ltd 10.23 Bosch Ltd 4.00 Exide Industries Ltd 2.48 Motherson Sumi Systems 2.43 MRF Ltd 2.19 Eicher Motors Ltd 2.15 Other Companies in Index 5.62 *Weights as of Dec 31, 2013. No. of stocks in Index – 15 # : As of Feb 28, 2014 2
  • 3.
    CNX Finance Index ReturnCNX Since Inception (Jan 1, 2004) 2009 – 2013 (5 years) 2010 -2013 (3 years) 2012 – 2013 (1 years) YTD# As of Dec 2013 16.83% 19.63% 0.01% -7.32% -3.42% Company’s Name Weight (%)* ICICI Bank Ltd 22.70 HDFC Ltd 22.17 HDFC Bank Ltd 22.05 State Bank of India 8.15 Axis Bank Ltd 7.21 Kotak Mahindra Bank Ltd 4.95 IDFC Ltd 2.46 Shriram Transport Finance 2.02 Punjab National Bank 1.67 M & M Financial Services 1.56 Other Companies in Index 5.06 *Weights as of Dec 31, 2013. No. of stocks in Index - 15 # : As of Feb 28, 2014 Factors affecting Sector • NIMs, NPA and Asset Quality Issues. Cost of Deposits. • Regulatory Issues – Policy actions by the regulator the RBI – SLR, CRR, Bank rate, repo, reverse repo affects liquidity. Stability of rates? Gold loans? Microfinance ? • Priority Sector and Financial Inclusion -Costs? • Deposit growth coupled with high credit growth is good for bank stocks as it improves the profitability of banks. • Rising default on loans eat into the banks capital as deposits that go into funding credit have to be serviced and repaid 3
  • 4.
    CNX FMCG Index ReturnCNX Since Inception (Dec 01, 1995) 2009 – 2013 (5 years) 2010 -2013 (3 years) 2012 – 2013 (1 years) YTD# As of Dec 2013 17.04% 27.29% 21.85% 12.18% -1.05% Factors affecting Sector • Brand value and brand recall -ability • High advertisement cost to maintain brand recall – ability among customer • Rise in disposable income and growing middle class • Increasing share of organized retail in urban areas and penetration in rural area • Consumer Preferences – Availability of new and innovative products, festive discount schemes • Dealers distribution network, incentives and dealers discount • Working capital management Company’s Name Weight (%)* I T C 58.55 Hindustan Unilever 13.32 United Spirits 6.92 Godrej Consumer Products 3.53 Dabur India 3.07 Colgate Palmolive (India) 2.97 Tata Global Beverages 2.12 Britannia Industries 1.79 United Breweries 1.70 GlaxoSmithkline Consumer Healthcare 1.70 Other Companies in Index 4.33 *Weights as of Dec 31, 2013. No. of stocks in Index - 15 # : As of Feb 28, 2014 4
  • 5.
    CNX Energy Index ReturnCNX Since Inception (Jan 1, 2001) 2009 – 2013 (5 years) 2010 -2013 (3 years) 2012 – 2013 (1 years) YTD As of Dec 2013 17.29% 6.28% -6.61% 0.43% -6.75% Factors affecting Sector Power • Power – Government policies related to traffic control, subsidies, rural electrification program. • Availability of raw material like coal, oil & gas. • Efficiency of Transmission & distribution network • Availability of core equipment like boilers, turbines and generators Oil & Gas • Quality & Price of Crude oil • Movement of INR against USD • Government policies related to oil subsidy, • Geographical diversification Company’s Name Weight (%)* Reliance Industries Ltd 46.42 ONGC 16.13 NTPC Ltd 8.91 Power Grid Corp. 6.94 Cairn India Ltd 6.04 GAIL (India) Ltd 4.85 Tata Power Co Ltd 4.62 BPCL 2.84 Indian Oil Corporation Ltd 1.63 Reliance Power Ltd 1.62 *Weights as of Dec 31, 2013. No. of stocks in Index - 10 # : As of Feb 28, 2014 5
  • 6.
    CNX IT Index ReturnCNX Since Inception (Jan 1, 1996) 2009 – 2013 (5 years) 2010 -2013 (3 years) 2012 – 2013 (1 years) YTD# As of Dec 2013 28.78% 34.17% 8.31% 57.97% 8.62% Factors affecting Sector • Business model – Time & material pricing, engagement model, pay us for result, sale of product • Geographical coverage as revenue is dependent on location of client • No. of Client, relationship with client and inorganic growth • Concentration of customer base • Availability of talent pool and favorable labor arbitrage • Labor utilization rate • Currency fluctuation directly affect revenue Company’s Name Weight (%)* Infosys Ltd 41.01 Tata Consultancy Services 27 Wipro Ltd 8.9 HCL Technologies Ltd 8.2 Tech Mahindra Ltd 6.63 Oracle Financial Services Software Ltd 1.69 MindTree Ltd 1.13 MphasiS Ltd 0.79 Hexaware Technologies Ltd 0.69 Vakrangee Ltd 0.62 Other Companies in Index 3.34*Weights as of Dec 31, 2013. No. of stocks in Index - 20 # : As of Feb 28, 2014 6
  • 7.
    CNX Pharma Index ReturnCNX Since Inception (Jan 1, 2001) 2009 – 2013 (5 years) 2010 -2013 (3 years) 2012 – 2013 (1 years) YTD# As of Dec 2013 16.92% 26.43% 14.51% 26.51% 8.40% Factors affecting Sector • R&D – Development of new drugs, faster drug discovery process, new therapies for untreated and under treated diseases / medical conditions • Emergence of Medical Tourism, Expansion of healthcare facilities & diagnostic centers to rural areas • Financing Products – Health & life insurance policy, cashless medi-claim • Government Policies – Policy initiatives, tax break , insurance cover to fund research • Outsourcing activities – on account of cost efficient research, highly skilled & cheap labour, robust IT Company’s Name Weight (%)* Sun Pharmaceutical Industries Ltd 26.69 Dr. Reddy's Laboratories Ltd 20.06 Lupin Ltd 13.53 Cipla Ltd 12.71 Glaxosmithkline Pharmaceuticals Ltd 7.83 Divi's Laboratories Ltd 4.85 Glenmark Pharmaceuticals 4.67 Ranbaxy Laboratories Ltd 4.37 Piramal Enterprises Ltd 2.66 Cadila Healthcare Ltd 2.61 *Weights as of Dec 31, 2013. No. of stocks in Index - 10 # : As of Feb 28, 2014 7
  • 8.
    CNX Media Index ReturnCNX Since Inception (Dec 30, 2005) 2009 – 2013 (5 years) 2010 -2013 (3 years) 2012 – 2013 (1 years) YTD# As of Dec 2013 7.57% 15.24% 2.42% 1.50% -4.48% Factors affecting Sector • DIGITISATION – Gamechanges for Braodcasters Internet -Digital Media • Film Making (Paradigm shift – Corporatization) • Hollywood -Outsourcing Opportunities,3D • Bollywood - low budget and 300 cr + • Improved quality of picture & sound through Digitization, leading to improved advertisement revenue • International Presence, Regional entertainment channels and niche broadcasting • Viewership management system • Average Revenue per user (ARPU) • Brand Value of Channels • Expansion of FM radio, print media Company’s Name Weight (%)* Zee Entertainment Enterprises Ltd 50.85 Sun TV Network Ltd 12.61 Hathway Cable & Datacom 7.07 TV18 Broadcast Ltd 5.90 D B Corp 4.55 Den Networks Ltd 3.97 Jagran Prakashan Ltd 3.87 PVR Ltd 2.96 HT Media Ltd 1.91 Navneet Education Ltd 1.82 Other Companies in Index 4.49*Weights as of Dec 31, 2013. No. of stocks in Index - 15 # : As of Feb 28, 2014 8
  • 9.
    CNX Metal Index ReturnCNX Since Inception (Jan 1, 2004) 2009 – 2013 (5 years) 2010 -2013 (3 years) 2012 – 2013 (1 years) YTD# As of Dec 2013 9.53% 11.56% -19.18% -14.26% -12.99% Factors affecting Sector • M&A issues and integration for companies like Tata Steel – Corus, Hindalco – Novelis, Vedanta • Cost of raw material like coal, • Demand & price of steel, aluminum, minerals and other metal • Demand from dependent sector  Coal - Power sector  Aluminum – Auto sector Company’s Name Weight (%)* Tata Steel Ltd 20.91 Sesa Sterlite Ltd 18.46 Coal India Ltd 13.55 Hindalco Industries Ltd 11.66 JSW Steel Ltd 8.86 NMDC Ltd 8.32 Jindal Steel & Power Ltd 7.37 Steel Authority of India Ltd 4.43 Bhushan Steel Ltd 2.32 National Aluminum Co Ltd 1.29 Other Companies in Index 2.83*Weights as of Dec 31, 2013. No. of stocks in Index - 15 # : As of Feb 28, 2014 9
  • 10.
    CNX Realty Index ReturnCNX Since Inception (Dec 29, 2006) 2009 – 2013 (5 years) 2010 -2013 (3 years) 2012 – 2013 (1 years) YTD# As of Dec 2013 -21.41% -9.15% -21.39% -34.38% -16.55% Factors affecting Sector • Infrastructure Development & Government Policies – Industrial corridors, Express ways, Metro, Monorail, airports, ports & shipping facilities. • Issues related to FSI and Development • Rapid Urbanization - India has 2nd highest population in world. Rising middle class and higher disposable income of Indians. • Growing IT & ITES industry, growing preference towards organized retail drives demand for commercial property and SEZ • Interest rate directly influence buyer’s ability to purchase property • Tax credits, deductions & subsidies directly impact real estate Company’s Name Weight (%)* DLF Ltd 38.33 Unitech Ltd 10.67 Oberoi Realty Ltd 9.90 Housing Development and Infrastructure Ltd 7.38 Prestige Estates Projects Ltd 7.33 Indiabulls Real Estate Ltd 6.91 Sobha Developers Ltd 6.22 Phoenix Mills Ltd 5.79 Godrej Properties Ltd 3.97 Anant Raj Ltd 3.50 *Weights as of Dec 31, 2013. No. of stocks in Index - 10 # : As of Feb 28, 2014 10
  • 11.
    CNX MidCap Return CNXSince Inception (Jan 1, 2003) 2009 – 2013 (5 years) 2010 -2013 (3 years) 2012 – 2013 (1 years) YTD# As of Dec 2013 20.90% 16.66% -3.05% -5.10% -3.30% Company’s Name Weight (%)* M& M Financial Services 2.32 Reliance Communications 2.30 Adani Ports and Special Economic Zone 2.14 Divi's Laboratories 2.06 Glenmark Pharmaceuticals 1.99 Adani Enterprises 1.92 Apollo Hospitals Enterprises 1.92 Oracle Financial Services Software 1.84 Aditya Birla Nuvo 1.79 Oil India 1.77 Sector Weight (%) Financial Services 20.00 Energy 11.59 Consumer Goods 11.50 Pharma 11.33 Services 9.10 Automobiles 7.74 Industrial Manufacturing 7.39 IT 3.56 Metals 3.25 Telecom 3.14 *Weights as of Dec 31, 2013. No. of stocks in Index - 100 # : As of Feb 28, 2014 11
  • 12.