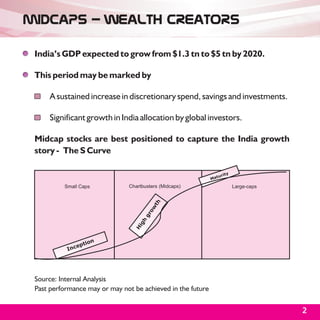
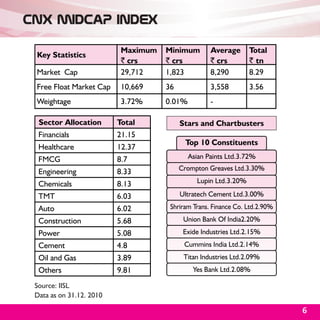
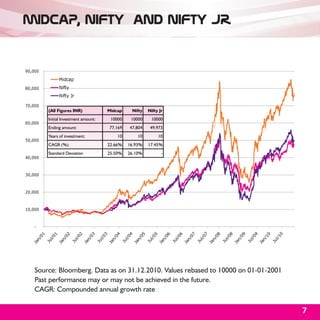
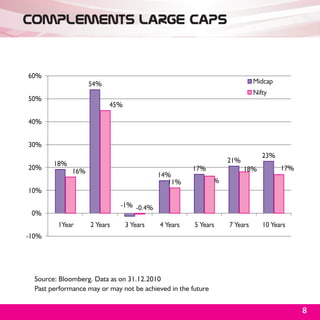
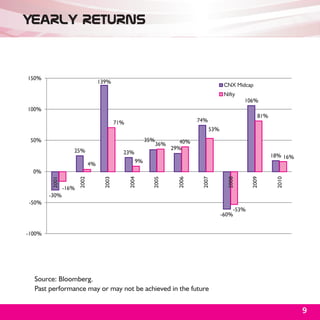
Motilal Oswal Mutual Fund presents m100 (An Open Ended Index Exchange Traded Fund) that tracks the CNX Midcap Index. The NFO opens on 12th January 2011 and closes on 24th January 2011. The document discusses that midcap stocks are well positioned to capture India's growth given India's GDP is expected to grow substantially by 2020. It provides statistics on the CNX Midcap Index such as sector allocation and top 10 constituents. Performance figures show midcap outperforming large caps over long periods while complementing large cap portfolios.
This document discusses common investment challenges such as randomness of returns, picking winning stocks, timing the market, picking active managers, and the costs of indexing. It then outlines an investment approach focused on strategic partnerships with institutional managers, academically sound portfolio construction, keeping costs low, and HonorVise portfolios. Key points include reviewing evidence that stock returns are random, individual stock picking is difficult, market timing rarely works, and costs are lower with index funds. The approach focuses on dimensions of expected returns including size, value, and market factors.
AGF Management Limited is a Canadian investment management company established in 1957 with $31.1 billion in total assets under management as of August 31, 2004. The company has four main business segments: investment management, AGF Trust, fund administration, and Unisen. AGF aims to reinforce investment management excellence, build a client-centric organization focused on multi-channel distribution, pursue strategic acquisitions, and undertake disciplined review of support entities. Recent financial results show revenue up 13.4% and net income up 55.5% year-to-date in 2004.
BRICS PMS Performance Update - 31 January 2011vivekmavani
This document provides a performance update and market outlook from a portfolio manager at Portfolio Management Services. It summarizes the performance of their BRICS Growth equity product for the month of January 2011. While Indian indices like the Sensex and Nifty corrected by around 10-11% in January, the BRICS Growth portfolio declined by 9.47% for the month. The portfolio manager discusses actions taken in the portfolio to limit downside, like exiting banking stocks, and their outlook going forward, emphasizing stock picking and quality companies.
Angel Ron: European Banks Conference. CrisisBanco Popular
Popular has been able to deleverage faster than peers by gathering deposits rather than shrinking its loan book. This has allowed Popular to maintain its leadership in recurrent profit while adjusting rapidly to changes in funding costs due to the short duration of its lending book. Even in a complex environment, Popular has managed to remain the most efficient bank in Spain. The acquisition of Pastor will improve Popular's efficiency further through annual synergies. Popular has reduced its wholesale dependence by €19 billion over 4 years while maintaining a robust second line of liquidity.
Daily newsletter stoplosstrade 2 nd jan 2013jkhbjcapital
The daily market insight document discusses the Indian stock market performance and provides analysis and recommendations. It notes that Indian stocks remained firm in January due to expected interest rate cuts, though high fiscal and trade deficits may limit gains. It recommends going long on the Nifty if it sustains above 6005 with targets of 6200. Analysis of options data suggests the market sees support at 5800 and resistance at 6200. It recommends buying PNB with confidence and watching for a breakout in NMDC.
The document provides an economic and market outlook for February 2012. It notes that while recent increases in risk asset prices globally may be due to a turnaround in sentiment rather than fundamentals, several domestic avenues like long term debt, mid cap equities and infrastructure companies could provide returns with a genuine long term investment horizon. India's GDP growth slowed in the second quarter of FY12, but industrial output grew 5.9% in November. Inflation declined to 7.47% in December raising hopes that interest rates may start to fall. The equity market rallied in January led by banking, metals and capital goods sectors.
Intact Financial Corporation presented its investor presentation for June 2010. The presentation highlighted Intact's position as the dominant property and casualty insurer in Canada with over $4 billion in annual premiums written. Intact has a significant scale advantage over its competitors and has consistently outperformed the industry on key metrics like combined ratio and return on equity. The presentation also summarized Intact's strong financial results for the first quarter of 2010, including net operating income per share growth of 62.1% and an annualized return on equity of 16.1%.
A Portfolio Strategy - which yield\'s the “ Max. Operating Performance per Unit of Enterprise Value with min. expense ratio , lower Beta vs Benchmarks & Competitive liquidity quotient " :: { 9 Templates * 996 Portfolio\'s * 15000 Simulations * 6 Time Zones vs 4 Benchmarks }
This document provides an investor presentation for Intact Financial Corporation (IFC) from September 2010. IFC is Canada's largest provider of property and casualty insurance, with over $4 billion in annual premiums written. The presentation outlines IFC's strong financial position, industry-leading underwriting performance, and growth strategies. Key points include IFC's consistent outperformance of the Canadian P&C industry benchmarks on measures like combined ratio and return on equity. The presentation also discusses IFC's excess capital position, debt capacity, and acquisition strategy to capitalize on consolidation opportunities in the market. Multiple avenues for organic growth are outlined, including leveraging IFC's multi-channel distribution network and expanding product offerings.
Intact Financial Corporation (IFC) held an investor presentation in August 2010. IFC is Canada's largest provider of property and casualty insurance with over $4 billion in annual premiums. The presentation highlighted IFC's consistent outperformance of the industry through disciplined pricing, underwriting, and capital management. IFC outlined opportunities for future growth through firming market conditions, consolidation in the Canadian P&C market, and expanding its existing distribution platforms and markets.
Intact Financial Corporation presented an investor presentation in March 2010. The presentation highlighted Intact as the dominant property and casualty insurer in Canada, with over $4 billion in direct premiums written. Intact has substantial size and scale advantages over its competitors due to its market share leadership positions in key provinces and a track record of successful acquisitions. The presentation also noted Intact's consistent outperformance of the P&C insurance industry over 10 years in areas like premium growth, combined ratio, and return on equity. Intact aims to continue its strong organic growth through its large broker network and by targeting the growing 50+ demographic market.
Indo Thai Securities Ltd is issuing an IPO of 4 million shares at a price band of Rs. 70-84 per share to list on the NSE and BSE. The IPO opens from September 30 to October 5, 2011. At the cap price of Rs. 84, the IPO would raise Rs. 33.6 crore and value the company at Rs. 84 crore. The IPO is expensive compared to peers at a PE of 70.09x based on FY11 earnings. The summary recommends investors skip the issue due to intense competition, limited growth prospects, and the global economic slowdown.
- Waddell & Reed Financial Inc. is a publicly traded investment management company with $1.5 billion in market capitalization and 84.7 million shares outstanding.
- They provide investment management services through distinct distribution channels serving retail, wholesale, and institutional clients. They have a dedicated network of over 2,000 financial advisors and a comprehensive family of mutual funds.
- As of Q1 2009, they have $47.6 billion in total assets under management, with 83% in equity funds and 13% in fixed income funds.
(1) The EquiMax Tool analyzes market conditions to determine when to enter and exit equity markets through mutual funds. (2) It categorizes market conditions into six types based on factors like valuations and earnings growth, with Type 1 being most favorable and Type 6 being least favorable. (3) EquiMax aims to improve returns by investing in Types 1-3 and holding cash in Types 4-6, reviewing allocations periodically.
Options Not Fully Pricing in Hurricane RisksRYAN RENICKER
Actionable trade ideas for stock market investors and traders seeking alpha by overlaying their portfolios with options, other derivatives, ETFs, and disciplined and applied Game Theory for hedge fund managers and other active fund managers worldwide. Ryan Renicker, CFA
This document provides an overview of Atlantic Asset Management's fixed income fund range and views. It summarizes three funds - the Atlantic Stable Income Fund, Atlantic Enhanced Income Fund, and Atlantic Real Income Fund. For each fund, it outlines the investment universe, objectives, management fees, and regulation compliance. It also discusses the funds' performance and provides asset allocation breakdowns. The document concludes with the author's views on key global themes and market scenarios for 2012, and the expected returns under each scenario.
The document compares the Morningstar and Value Line databases and their ranking systems. Value Line uses a 1-5 ranking system where 1 is best, while Morningstar uses a star system where 5 stars is best. The document ranks stocks in Value Line portfolios by their Morningstar star ratings, and vice versa, finding the Value Line timeliness ranking may be a better short-term indicator of growth potential than Morningstar stars.
[JMFL] Multi Commodity Exchange - Poised for comebackAmey Sathe, CFA
The document discusses MCX, a commodity exchange in India. It initiates coverage on MCX with a buy rating and target price of Rs. 1,050. Despite a crisis, MCX retained its dominant 80% market share, highlighting its strong franchise. The regulator strengthened oversight which increases confidence in the sector. MCX is well positioned for growth due to its leading position, stronger regulation, and new largest shareholder Kotak Bank. Regulatory changes could open opportunities for options trading and participation by financial institutions. The report forecasts 20% annual EPS growth over FY15-17 driven by a 25% annual volume CAGR, and values MCX at 30x FY17 EPS.
1) Volatility drives returns. The high volatility of 2008 led to large negative returns, but 2009 saw substantial positive returns as volatility decreased.
2) In the first quarter of 2010, most asset classes saw solid gains, with US equity markets continuing strong performance. Over the past year, maintaining a diversified portfolio helped investors benefit from return premiums across different asset classes.
3) Looking back 3 years, only 4 of 15 asset classes had positive returns, with emerging markets and fixed income performing best. However, past performance does not predict future returns, and focusing only on past winners can be misleading.
Presentation by Meyer Shields, Managing Director Stifel, Nicolaus & Company, Inc. to the 66th Annual Fowler Seminar on Oct 12 2012 titled Equity Analyst’s View on Insurance
Next generation Waterside Convention 10-2012 AmundiMarnix van Eerde
This document discusses improving equity exposure through asymmetrical strategies. It notes that average stock market returns have declined since 2000 while volatility has increased, presenting challenges. It then outlines Amundi's approaches for navigating volatile markets, moving from minimum risk to total risk strategies including minimum variance, risk parity, and directional asymmetric funds. These strategies aim to reduce downside risk while enhancing risk-adjusted returns through asymmetrical participation in market movements. Performance simulations show these approaches outperforming a traditional market-cap weighted benchmark since their inceptions.
This document provides an investor presentation for Genworth Financial from October 2007. It includes 3 key points:
1) An overview of Genworth's US mortgage insurance portfolio, including limited exposure to high-risk segments like subprime loans and a focus on prime loans.
2) Performance metrics for Genworth's US mortgage insurance business showing strong growth in insurance in force and revenue as well as better than industry average default rates.
3) Commentary on factors supporting continued growth for Genworth's mortgage insurance business in the US including solid household formation, a shift to fixed-rate products, and declining use of simultaneous seconds.
- Mphasis Limited is an Indian IT & BPO services provider and subsidiary of Hewlett Packard (HP), with HP owning 61% stake.
- The document provides an analysis of Mphasis' business segments, financial performance, valuation and recommendations.
- Based on a projected FY12 P/E multiple of 15, the fair value for Mphasis is estimated to be Rs. 723 per share. The document recommends a 'HOLD' rating on the stock.
Against the tide Waterside Convention 10-2012 Kempen Capital ManagementMarnix van Eerde
This document discusses strategies for hedge funds to generate returns. It summarizes that:
1) Hedge funds can generate returns through alpha (excess returns) or alternative betas (systematic exposures different from traditional markets).
2) Less liquid hedge fund strategies historically offered higher returns but the move away from them post-2008 has been painful.
3) Frontier markets may offer attractive growth potential at lower prices than more developed markets. Stock pickers can add value in these markets.
4) Structured credit markets now offer compelling risk-reward after difficulties in 2011. Specialists can add value through security selection and hedging strategies within these markets.
Malaysia is looking to grow its derivatives market and become more integrated in the global financial system. The derivatives market in Malaysia is centered around Bursa Malaysia Derivatives, which is a subsidiary of the Bursa Malaysia stock exchange. Activity and foreign participation in the Malaysian derivatives market has been increasing in recent years, supported by initiatives like partnerships with international exchanges and the introduction of new derivatives products. Bursa Malaysia Derivatives is working to further develop the market through initiatives aimed at attracting more investors and market participants.
Cathay Pacific Catering Services is considering strategic options to grow its market share in the Asia-Pacific airline catering industry. The document discusses CPCS investigating potential joint ventures and acquisitions with other catering companies. It analyzes competitors like LSG Sky Chefs and Gategroup, and identifies potential partnership and acquisition targets including Singapore Airline Terminal Services, Q Catering, and TFK Corporation. The financial feasibility of acquisitions worth between HK$2.4-11.4 billion is also examined.
BRICS PMS Performance Update - 31 March 2011vivekmavani
This document provides a performance update and market outlook from a portfolio management company. It summarizes the performance of their BRICS Growth equity product for the period ending March 31, 2011. Some key points:
- BRICS Growth achieved returns of 5.41% in March and 23.07% over the past year, outperforming major Indian indices.
- The portfolio performed well during periods of volatility by maintaining adequate liquidity and limiting downside losses.
- Mid-cap stocks remain attractive but lagged the rally in March. The portfolio maintains conviction in mid-caps.
- Going forward, stock picking will be important as broader markets are expected to catch up with large caps. The focus remains
BRICS PMS Performance Update - 28 February 2011vivekmavani
This document provides a performance update and outlook for the BRICS Growth portfolio as of February 28, 2011. It summarizes that the portfolio outperformed major indices in the recent correction, limiting losses to -2.78% month-to-date compared to over -3% for the Nifty and Sensex. The portfolio maintained a conservative approach through higher cash levels and selective stock picking, focusing on sectors like technology, autos, and capital goods. Going forward, the portfolio will continue this strategy of investing in quality companies and limiting downside risk.
Brics PMS Performance Update - 31 December 2010vivekmavani
This document provides a performance update for the BRICS Growth portfolio as of December 31, 2010. It summarizes the portfolio's absolute returns and compares its performance to various indices over different time periods, showing outperformance. It discusses the portfolio's strategy of focusing on stock picking, maintaining a conservative approach, and deploying cash during periods of volatility. The portfolio increased its exposure to large caps while maintaining conviction in select mid and small caps. It continues to outperform peers and maintain low volatility relative to indices.
SKS Microfinance is the largest microfinance company in India, with a market share of approximately 10%. It offers microloans primarily to low-income women in rural India using the Grameen Bank model of joint liability groups. This model and SKS's focus on operational efficiency has allowed it to achieve industry-leading asset quality and low interest rates of around 25%. The IPO note recommends subscribing to the IPO given SKS's market leadership position and the large unmet demand for microfinance in India.
The Korea Fund saw a 9.86% rally in the third quarter of 2012, driven by actions from the ECB and Fed to support the Eurozone and US economies. The fund underperformed its benchmark by 245 basis points due to stock picks in consumer discretionary, industrials, and quality/value styles outperforming growth and large caps. Materials and healthcare stock picks contributed most to performance while consumer discretionary and industrials detracted. The Korean won appreciated against the dollar and may continue strengthening.
Intact Financial Corporation presented its investor presentation for June 2010. The presentation highlighted Intact's position as the dominant property and casualty insurer in Canada with over $4 billion in annual premiums written. Intact has a significant scale advantage over its competitors and has consistently outperformed the industry on key metrics like combined ratio and return on equity. The presentation also summarized Intact's strong financial results for the first quarter of 2010, including net operating income per share growth of 62.1% and an annualized return on equity of 16.1%.
This document provides an overview of capital markets and portfolio construction from Ferro Financial. It discusses the objectives of understanding capital markets, portfolio construction, diversification, and Ferro's investment philosophy. It defines the stock and bond markets, describing their sizes and complexities. It emphasizes the importance of diversifying among asset classes and within sectors to reduce risk and enhance returns. Modern portfolio theory aims to maximize returns for a given risk level by carefully selecting asset proportions. Successful long-term investing requires a disciplined strategy of diversification and maintaining a long-term view.
The Korea Fund underperformed the MSCI Korea benchmark in the second quarter of 2012, with the MSCI Korea dropping sharply by 8.6% in USD terms. Foreign investors sold a net $5 trillion worth of Korean equities, though the Korean won depreciated only moderately against the USD. During the quarter, the Fund outperformed its benchmark by 42 basis points due to strong stock picks in consumer discretionary, while IT and materials detracted. Quality stocks outperformed in the volatile market conditions, with low debt, low volatility stocks performing well.
Annual update presented to members of the Investment Office by the officers of the club. I created this presentation in collaboration with my fellow officer and other club members.
Hemas Group is a diversified conglomerate operating in Sri Lanka with businesses in FMCG, healthcare, transportation, leisure and power generation. The document provides an overview of the group highlighting its various business segments, key financial statistics and growth strategies. It summarizes the performance of each business segment for the financial year 2010/2011 and outlines expansion plans. The group aims to consolidate market leadership positions and pursue opportunities for growth across its portfolio.
Intact Financial Corporation held an investor presentation in February 2011. The presentation discussed IFC's position as the largest property and casualty insurer in Canada, with $4.5 billion in direct premiums written. It highlighted IFC's consistent outperformance of the Canadian P&C industry, including a 10-year combined ratio that was 3.8 percentage points better than the industry average. The presentation also outlined IFC's growth strategies, including organic growth through its multiple distribution channels and the potential for industry consolidation through acquisitions.
UTI TOP 100 Fund comes from India’s most respected fund house, UTI MF. UTI TOP 100 is an open ended equity oriented scheme that is that is based on the principle of large cap investing
This document discusses an investment opportunity in emerging and frontier markets fixed income funds. It notes the high growth expectations for emerging markets and tendency for developed economies to maintain low interest rates. This creates an opportunity to invest in emerging market corporate and sovereign bonds to obtain equity-like returns with lower risk compared to equities. The Galloway Global Emerging Markets Fixed Income Fund is presented as a way to capitalize on this opportunity by investing across emerging market countries and currencies while maintaining risk controls. The manager aims to generate consistent risk-adjusted returns through fundamental research and a diversified portfolio.
The document discusses Intact Financial Corporation's acquisition of AXA Canada. The key points are:
1) The acquisition strengthens IFC's position as the largest property and casualty insurer in Canada, increasing its premiums by over 40%.
2) The acquisition is financially compelling with an expected internal rate of return of 20% and accretion to net operating income per share.
3) Combining the two companies creates a leading P&C insurer in Canada and provides numerous diversification and synergistic benefits.
This document summarizes three model portfolios for investors with different risk appetites. The aggressive portfolio has 75% equity and is for high-risk investors. The moderate portfolio is 50% equity and 50% debt, aiming for medium-long term returns. The conservative portfolio is 25% equity and focuses on capital preservation. Nine mutual funds are recommended across equity and debt categories for each portfolio based on past performance and risk analysis.
India's economic fundamentals have deteriorated in the near term leaving the country with weaker growth. The country is grappling with problems of rising inflation and booming fiscal and current account deficits. Global macro-economic environment seems equally gloomy. European debt crisis has been escalating with more and more countries finding it difficult to re-finance their government debt without the assistance of third parties. China's growth has also moderated along with other Asian countries. Against the backdrop of weak global growth and high global commodity prices, the Indian economy has taken a severe beating due to weak domestic political climate. Indian government has failed to reduce the fiscal deficit and to device structural reforms to open supply-side bottlenecks. Rising subsidy bills, slow decision making on behalf of the government due to scandals and back-tracking on reforms due to influence of regional political parties have curtailed the growth potential. Any significant economic reform or any serious effort to curtail the fiscal deficit seems unlikely in the face of general elections due in May 2014.
The weakness in the Indian economy is reflected in the Indian equity market as well. Over the last two years, the equity market has given a negative return of nearly 4% while in the last year, it gave a negative return of nearly 8%. Thus, investment in the equity market has been quite difficult. We expect the market to consolidate in a broad range in the remaining part of the year, giving us the opportunity to accumulate stocks at reasonable prices. Thus, we have attempted to create a model portfolio to generate superior returns over the market. Given the weak domestic and global economic environment, we prefer to keep more than 70% of out portfolio in liquid funds. The funds would be deployed as and when the time will be ripe.
Intact Financial Corporation is Canada's largest personal and commercial property and casualty insurer, with $7 billion in annual premiums written. It has leading market shares in several Canadian provinces and consistently outperforms the industry on key metrics like combined ratio and return on equity. Intact has a diversified business mix across personal and commercial lines as well as regions. It expects to continue outperforming peers in 2013 through scale advantages, underwriting expertise, and a balanced investment portfolio.
1) Munjal Showa Ltd is a leading manufacturer of auto components like shock absorbers and struts. It has a dominant market share of over 55% in two-wheeler shock absorbers in India.
2) The company is expected to benefit from the expansion plans of its major clients Hero Motocorp and Honda Motorcycle & Scooter India.
3) The analyst initiates coverage with a "Buy" rating and target price of Rs. 85.71, arriving at attractive valuations.
1. Motilal Oswal Mutual Fund
Mos shares
presents
(An Open Ended Index Exchange Traded Fund)
m100
Opens: 12th Jan 2011 MOSt
NFO Closes: 24th Jan 2011 Mutual Fund Shares
Acts like a fund, Trades like a share
2. Midcaps - Wealth Creators
India’s GDP expected to grow from $1.3 tn to $5 tn by 2020.
This period may be marked by
A sustained increase in discretionary spend, savings and investments.
Significant growth in India allocation by global investors.
Midcap stocks are best positioned to capture the India growth
story - The S Curve
Source: Internal Analysis
Past performance may or may not be achieved in the future
2
3. Midcap Stocks
Early stage growth companies – Successful small cap companies
Focused on their specific niches
Hidden Gems:
under-researched
under-owned
under-valued
Seasoned management, established products, reasonable market share,
and name recognition
Outperformance relative to large caps
Complements large cap portfolios - better portfolio diversification
Source: Internal Analysis
3
4. Performance of Active Midcap Funds
3 Years 5 Years
Average Midcap Fund Performance -5.57% 13.14%
CNX Midcap -2.36% 16.71%
Index Outperformance 3.21% 3.57%
Of the active midcap funds,
90% underperformed the index over 5 years
70% Underperformed the index over 3 years
Source :- www.mutualfundsindia.com and Internal Analysis
Returns compounded annually
Past performance may or may not be achieved in the future
4
5. The CNX Midcap Index
Financial Performance :
minimum track record of
3 years operations and
+ve net worth.
Trading Interest :
minimum listing
record of 6 months.
The primary
objective:
benchmark of the
Midcap segment
of the market Criteria for Selection of Constituent Stocks
Exclude stocks more than 5% market capitalization of the universe.
The weight of the remaining stocks is determined and cumulative
weight calculated.
First 75 percent of the revised universe are excluded along with Nifty
Stocks.
Remaining top 100 companies form the CNX Midcap Index.
Source: India Index Services & Products Ltd. (IISL)
For further details, please refer to the Scheme Information Document (SID)
5
6. CNX Midcap Index
Maximum Minimum Average Total
Key Statistics
` crs ` crs ` crs ` tn
Market Cap 29,712 1,823 8,290 8.29
Free Float Market Cap 10,669 36 3,558 3.56
Weightage 3.72% 0.01% -
Sector Allocation Total Stars and Chartbusters
Financials 21.15
Top 10 Constituents
Healthcare 12.37
FMCG 8.7 Asian Paints Ltd.3.72%
Engineering 8.33 Crompton Greaves Ltd.3.30%
Chemicals 8.13 Lupin Ltd.3.20%
TMT 6.03 Ultratech Cement Ltd.3.00%
Auto 6.02 Shriram Trans. Finance Co. Ltd.2.90%
Construction 5.68 Union Bank Of India2.20%
Power 5.08 Exide Industries Ltd.2.15%
Cement 4.8 Cummins India Ltd.2.14%
Oil and Gas 3.89 Titan Industries Ltd.2.09%
Others 9.81 Yes Bank Ltd.2.08%
Source: IISL
Data as on 31.12. 2010
6
7. Midcap, Nifty and Nifty Jr.
(All Figures INR) Midcap Nifty Nifty Jr
Initial Investment amount: 10000 10000 10000
Ending amount: 77,169 47,804 49,973
Years of investment: 10 10 10
CAGR (%): 22.66% 16.93% 17.45%
Standard Deviation 25.50% 26.10% -
Source: Bloomberg. Data as on 31.12.2010. Values rebased to 10000 on 01-01-2001
Past performance may or may not be achieved in the future.
CAGR: Compounded annual growth rate
7
8. Complements Large Caps
60%
54% Midcap
Nifty
50%
45%
40%
30%
23%
18% 21%
20% 17% 18% 17%
16%
14%
11% 16%
10%
-1% -0.4%
0%
1Year 2 Years 3 Years 4 Years 5 Years 7 Years 10 Years
-10%
Source: Bloomberg. Data as on 31.12.2010
Past performance may or may not be achieved in the future
8
9. Yearly Returns
150%
139%
CNX Midcap
Nifty
106%
100%
81%
71% 74%
53%
50% 35% 40%
36%
25% 29%
23%
18% 16%
9%
4%
0%
2001
2002
2003
2004
2005
2006
2007
2008
2009
2010
-16%
-30%
-50%
-53%
-60%
-100%
Source: Bloomberg.
Past performance may or may not be achieved in the future
9
12. Features of MOSt Shares M100
India’s 1st Midcap Index ETF; Based on CNX Midcap Index
To be Listed on National Stock Exchange of India Limited (NSE)
A mutual fund scheme with the convenience of real time liquidity and
prices
Diversified portfolio of 100 Midcap companies which are a part of CNX
Midcap Index
Low cost structure: Proposed Total Expense Ratio (TER) of 1% p.a.
(Maximum permissible 1.5%p.a.) as compared to traditional investment
products where the TER > 2% p.a.
Complete transparency with portfolio being disclosed on daily basis
No loads and a Tax efficient exposure to the market
No discretion with Fund Manager / AMC, ensuring replication of the
Index
For further details, please refer to the Scheme Information Document (SID)
12
13. MOSl Shares M100
Fund Manager: Rajnish Rastogi
15 Years Experience in Fund Management and Equity Research
Qualifications - CFA, M. Tech (Mgmt & Systems) and B.Tech from
Indian Institute of Technology (I.I.T.)
NFO Application for ETF Units
Minimum Investment ` 10,000/- & in multiple of `1 thereafter
NFO Opens 12th Jan 2011 to 24th Jan 2011
During NFO, the units of MOSt Shares M100 will be allotted at
1/1000th of CNX Midcap Index value
Eg. CNX Midcap index on 31st Dec 2010 : 8857.2
MOSt Shares M100 allotment price per unit : ` 8.8572
MOSt Shares M100 Units will be credited to DP Account of the
investor & listed on NSE
For further details, please refer to the Scheme Information Document (SID)
13
14. DISCLAIMER:
This presentation has been prepared and issued on the basis of internal data, publicly available information and
other sources believed to be reliable. The information contained in this document is for general purposes only and
not a complete disclosure of every material fact and terms and conditions and features of Motilal Oswal MOSt
Shares Midcap 100 ETF (MOSt Shares M100). The information / data herein alone is not sufficient and shouldn't be
used for the development or implementation of an investment strategy. It should not be construed as investment
advice to any party. All opinions, figures, charts/graphs, estimates and data included in this presentation are as on
date and are subject to change without notice. While utmost care has been exercised while preparing this
document, Motilal Oswal Asset Management Company Limited does not warrant the completeness or accuracy of
the information and disclaims all liabilities, losses and damages arising out of the use of this information. The
statements contained herein may include statements of future expectations and other forward-looking statements
that are based on our current views and assumptions and involve known and unknown risks and uncertainties that
could cause actual results, performance or events to differ materially from those expressed or implied in such
statements. Readers shall be fully responsible / liable for any decision taken on the basis of this presentation. No
part of this document may be duplicated in whole or in part in any form and/or redistributed without prior written
consent of the Motilal Oswal Mutual Fund/ Motilal Oswal Asset Management Company Limited. Readers should
before investing in the Scheme make their own investigation and seek appropriate professional advice.
Statutory Details: Constitution: Motilal Oswal Mutual Fund has been set up as a trust under the Indian Trust Act,
1882. Trustee: Motilal Oswal Trustee Company Limited. Investment Manager: Motilal Oswal Asset
Management Company Ltd. Sponsor: Motilal Oswal Securities Ltd. Scheme Classification & Objective:
Motilal Oswal MOSt Shares Midcap 100 ETF (MOSt Shares M100), an open ended Index Exchange
Traded Fund that seeks investment return that corresponds (before fees and expenses) to the performance of
CNX Midcap Index (Underlying Index), subject to tracking error. Asset Allocation: Securities constituting CNX
Midcap Index: 95%-100%; Debt and Money market instruments and cash at call: 0-5%. Load: Entry Load: Nil Exit
Load: Nil Terms of Issue: Minimum Application Amount: During NFO, Rs. 10,000/- and in multiples of Re. 1/-
each. Ongoing Basis, On the Exchange: The units of the Scheme are proposed to be listed on the Capital
Market Segment on National Stock Exchange (NSE). On NSE, the units of the Scheme can be
purchased/sold in minimum lot of 1 unit and in multiples thereafter. Directly with the Fund: The
minimum number of units of the Scheme that investors can create/redeem in exchange of portfolio
deposit and cash component is 2,50,000 units and in multiples thereof. Face Value & Issue Price: Offer
of units having face value of Rs. 10/- per unit for cash at an allotment price during the New Fund Offer
14
15. and at NAV based prices during continuous offer. Investor Benefits and General Services: During
continuous offer, sale and redemption on all business days at NAV based prices. NAVs to be declared on
all business days. Risk Factors: (1) All Mutual Funds and securities investments are subject to market
risks and there can be no assurance that the Scheme's objectives will be achieved (2) As the price / value
/ interest rates of the securities in which the Scheme invests fluctuates, the Net Asset Value (NAV) of
the Scheme may go up or down depending upon the factors and forces affecting the securities market
(3) Past performance of the Sponsor/AMC/Mutual Fund and its affiliates does not indicate the future
performance of the Scheme and may not provide a basis of comparison with other investments (4)
Motilal Oswal MOSt Shares Midcap 100 ETF (MOSt Shares M100) is only the name of the Scheme and
does not in any manner indicate either the quality of the Scheme, its future prospects and returns.
Investors are therefore urged to study the terms of offer carefully and consult their Investment Advisor
before they invest in the Scheme (5) The Sponsor is not responsible or liable for any loss or shortfall
resulting from the operation of the Mutual Fund beyond the initial contribution made by it of an
amount of Rs. 1 Lac towards setting up of the Mutual Fund (6) The present Scheme is not a guaranteed
or assured return Scheme. (7) Investment in the scheme shall be subject to various other risk factors
including but not limited to risk associated with investment in equities such as trading volumes,
settlement risk, liquidity risk, default risk, tracking error risk, including the possible loss of principal,
investment in derivatives, etc. IISL Disclaimer: MOSt Shares M100 offered by Motilal Oswal Asset
Management Company Limited (MOAMC) or its affiliates is not sponsored, endorsed, sold or promoted by India
Index Services & Products Limited (IISL) and its affiliates. IISL and its affiliates do not make any representation or
warranty, express or implied (including warranties of merchantability or fitness for particular purpose or use) to the
owners of MOSt Shares M100 or any member of the public regarding the advisability of investing in securities
generally or in the MOSt Shares M100 linked to CNX Midcap Index or particularly in the ability of CNX Midcap
Index to track general stock market performance in India. Please read the full Disclaimers in relation to the CNX
Midcap Index in the Scheme Information Document. NSE Disclaimer: It is to be distinctly understood that the
permission given by NSE should not in any way be deemed or construed that the Scheme Information Document
has been cleared or approved by NSE nor does it certify the correctness or completeness of any of the contents of
the Scheme Information Document. The investors are advised to refer to the Scheme Information Document for
the full text of the Disclaimer Clause of NSE. For further Scheme Specific Risk Factors & other details, Please read
the Scheme Information Document (SID) & Statement of Additional Information (SAI) carefully
before investing. A copy of SID, SAI and KIM alongwith the application form are available at the office of the AMC,
R&T, Distributors, or can be downloaded from www.motilaloswal.com/assetmanagement and
www.mostshares.com.
15
16. MOSt
Mutual Fund Shares
Acts like a fund, Trades like a share
Call: 1800-200-6626 I SMS: M100 to 575753
E-mail: mfservice@motilaloswal.com
Website: www.mostshares.com
www.motilaloswal.com/assetmanagement