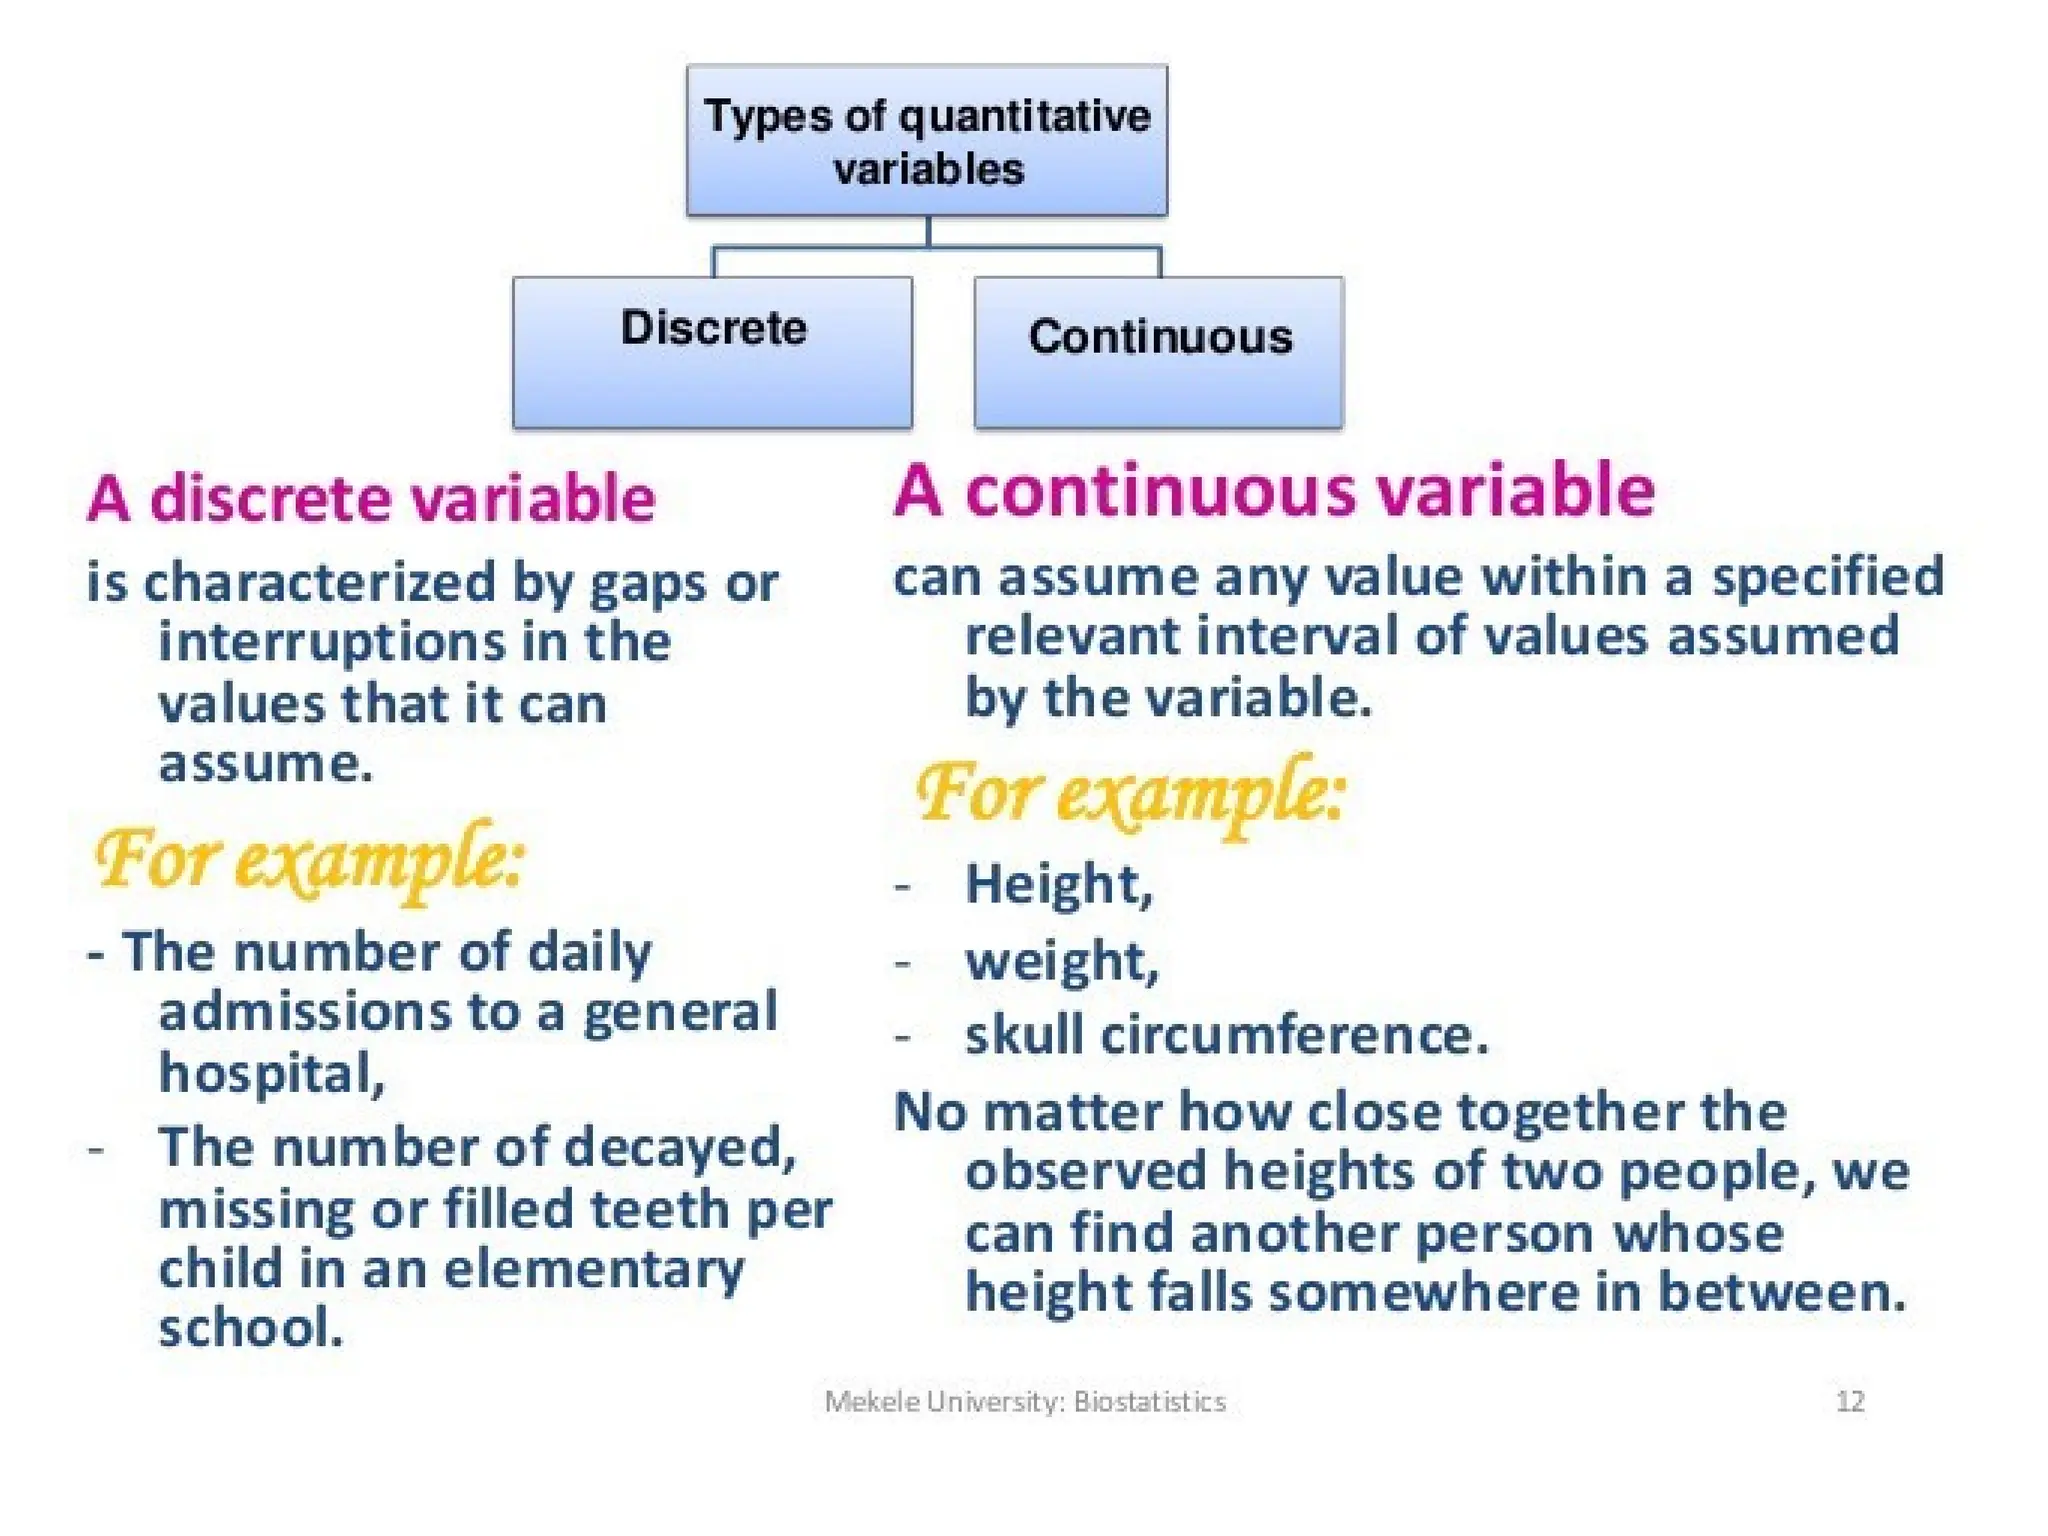
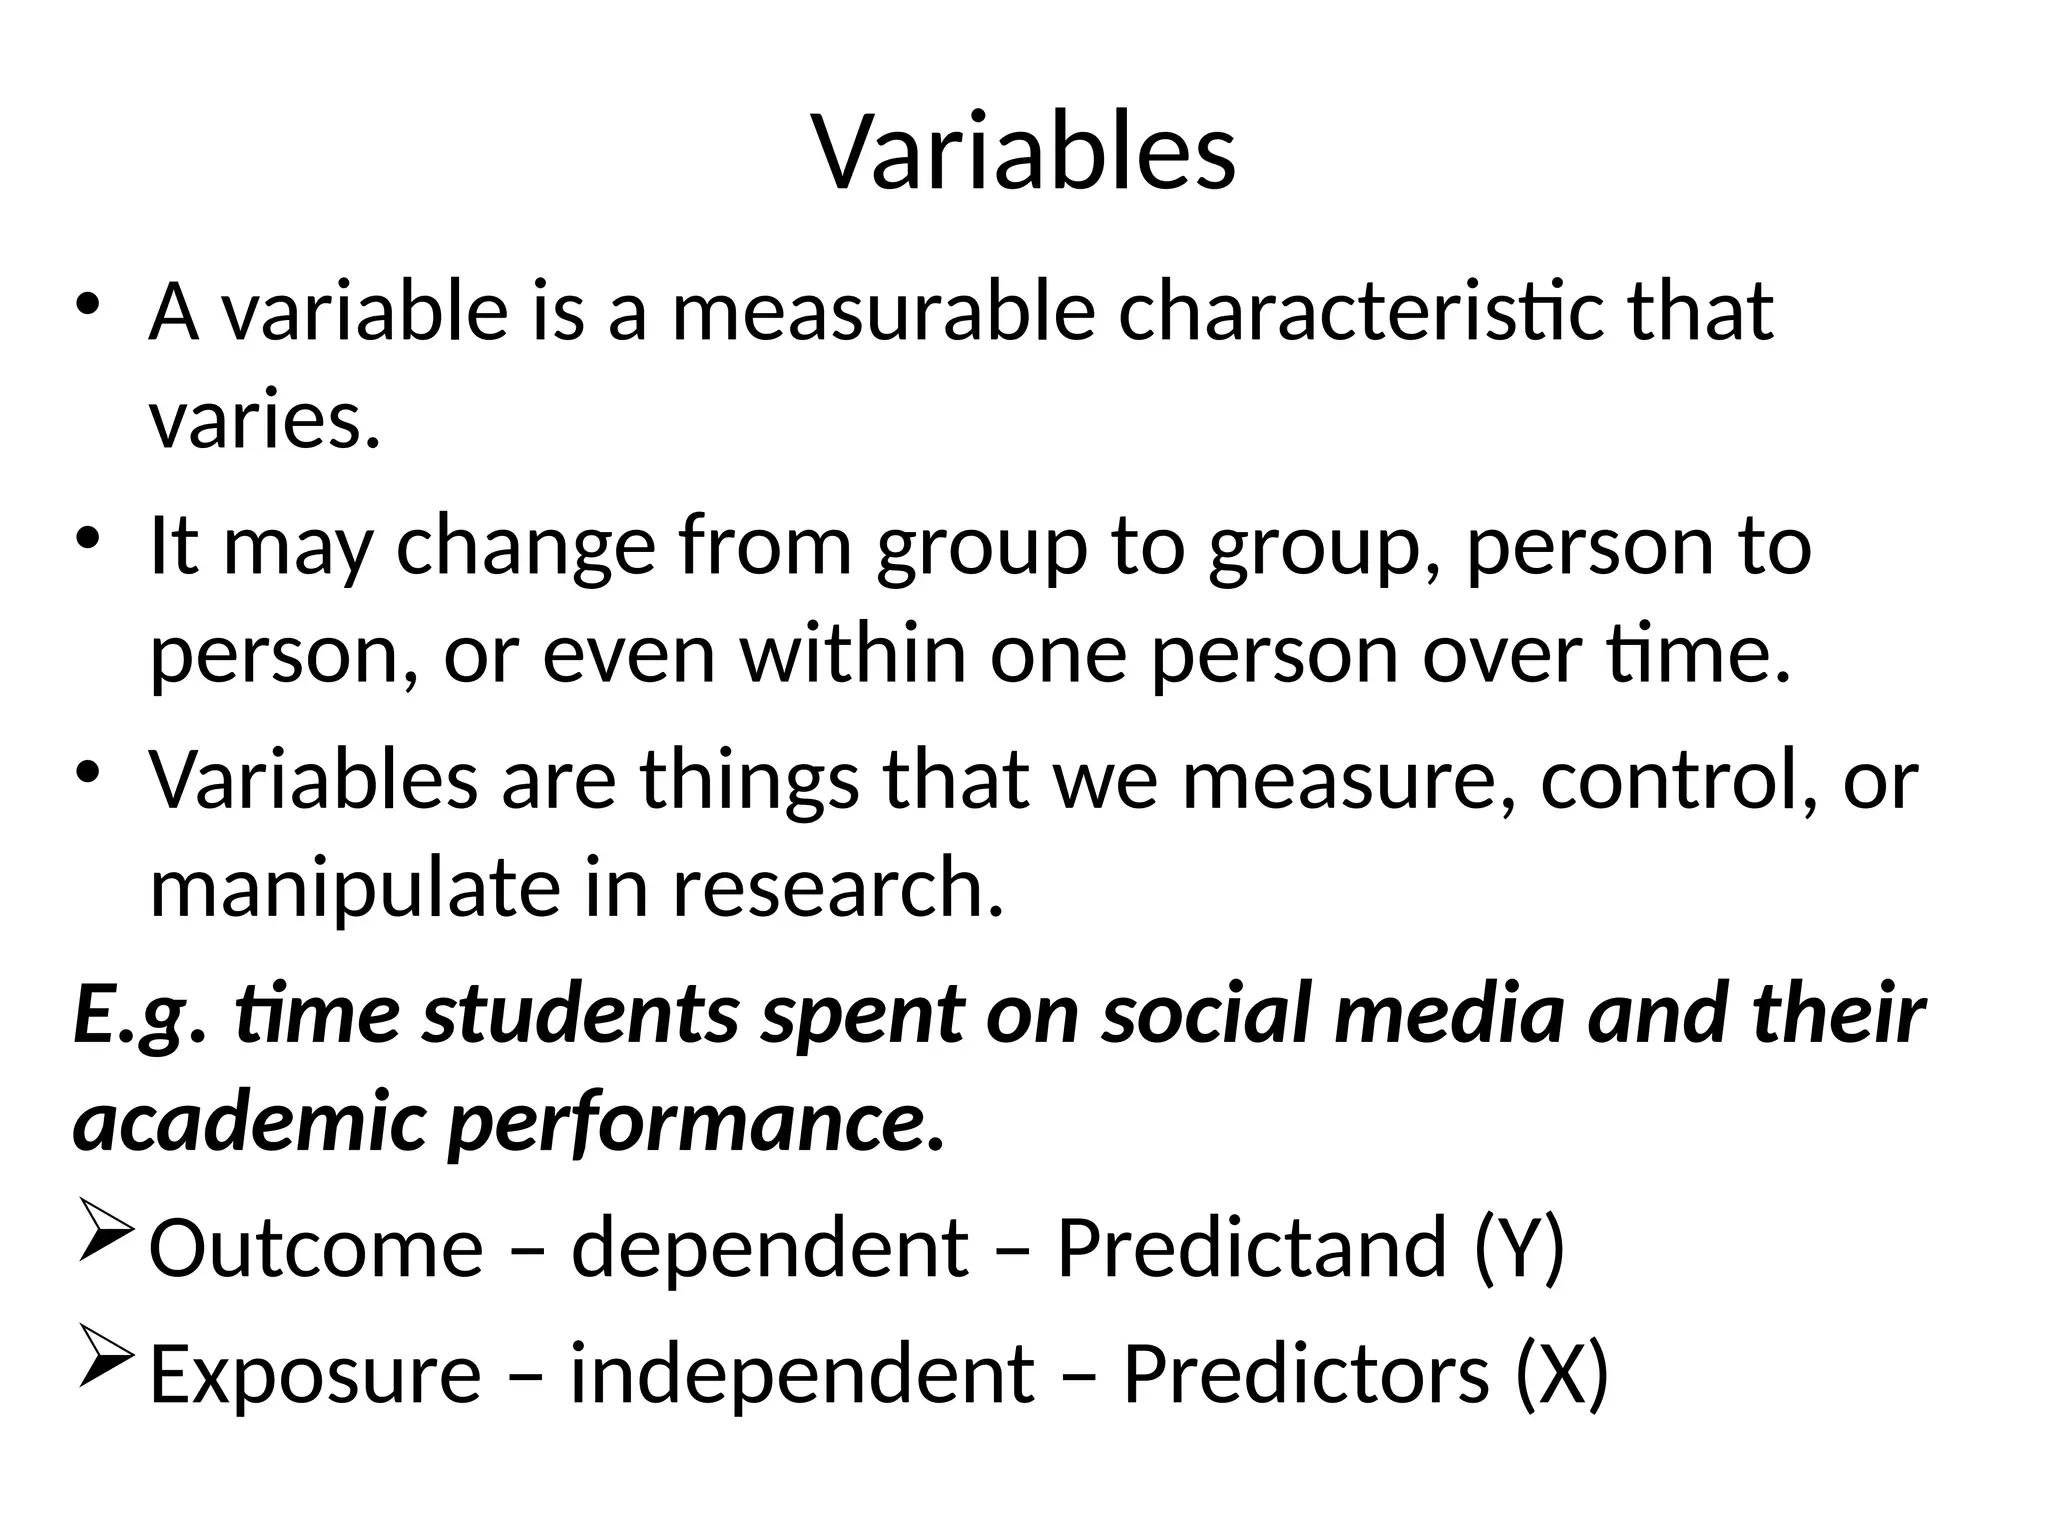
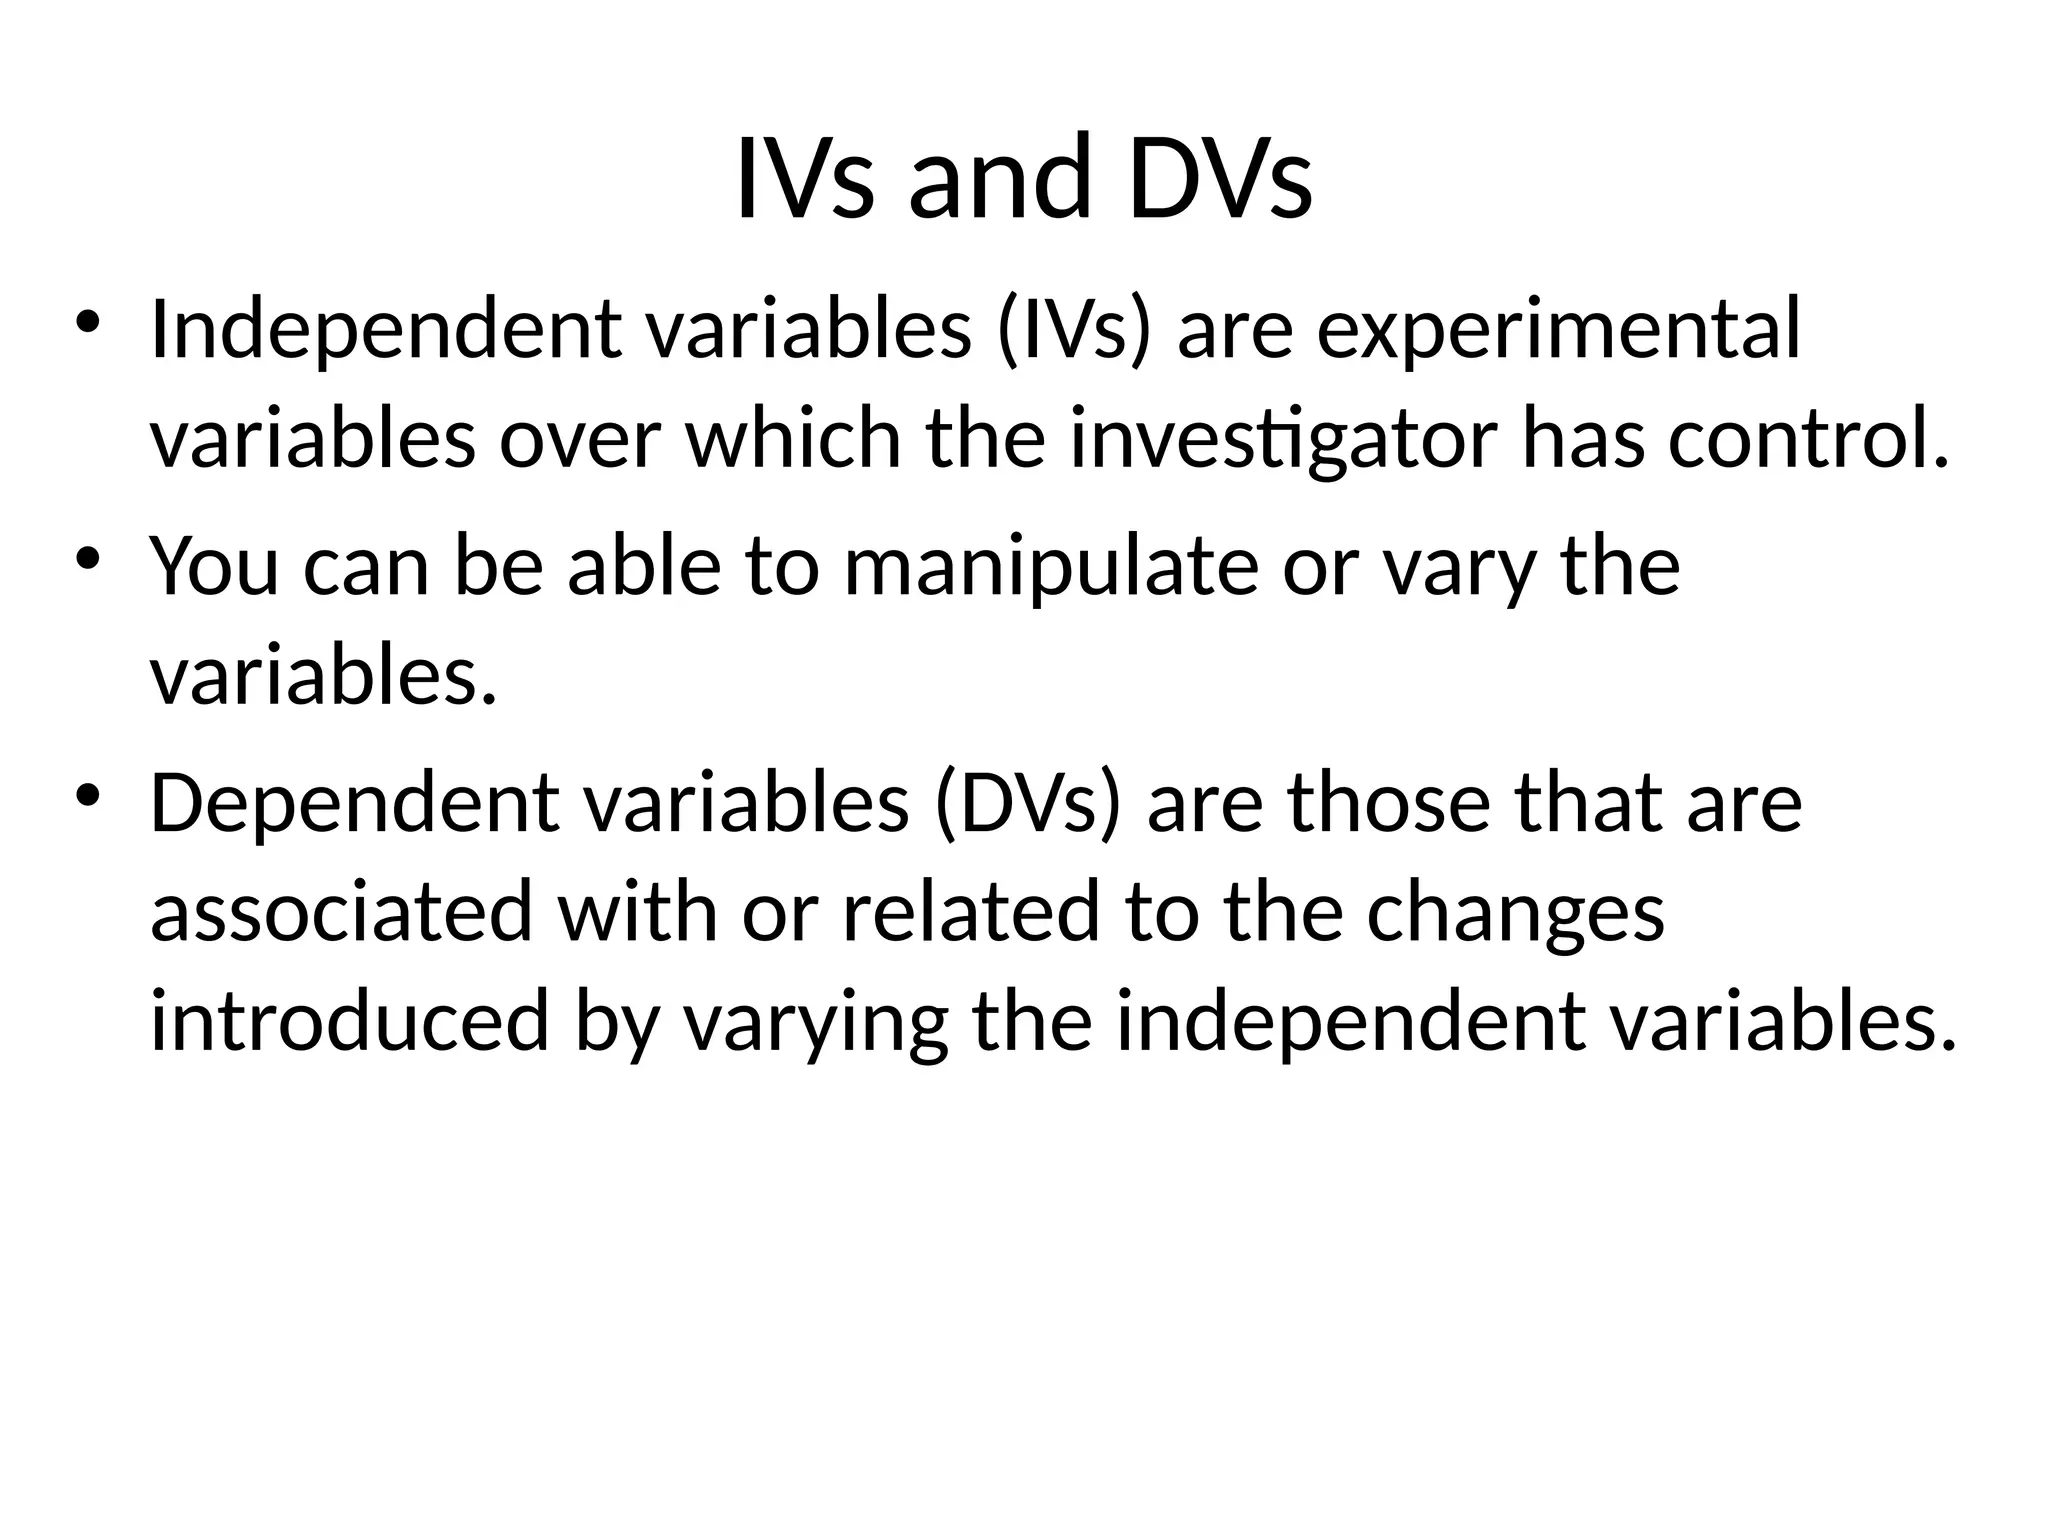
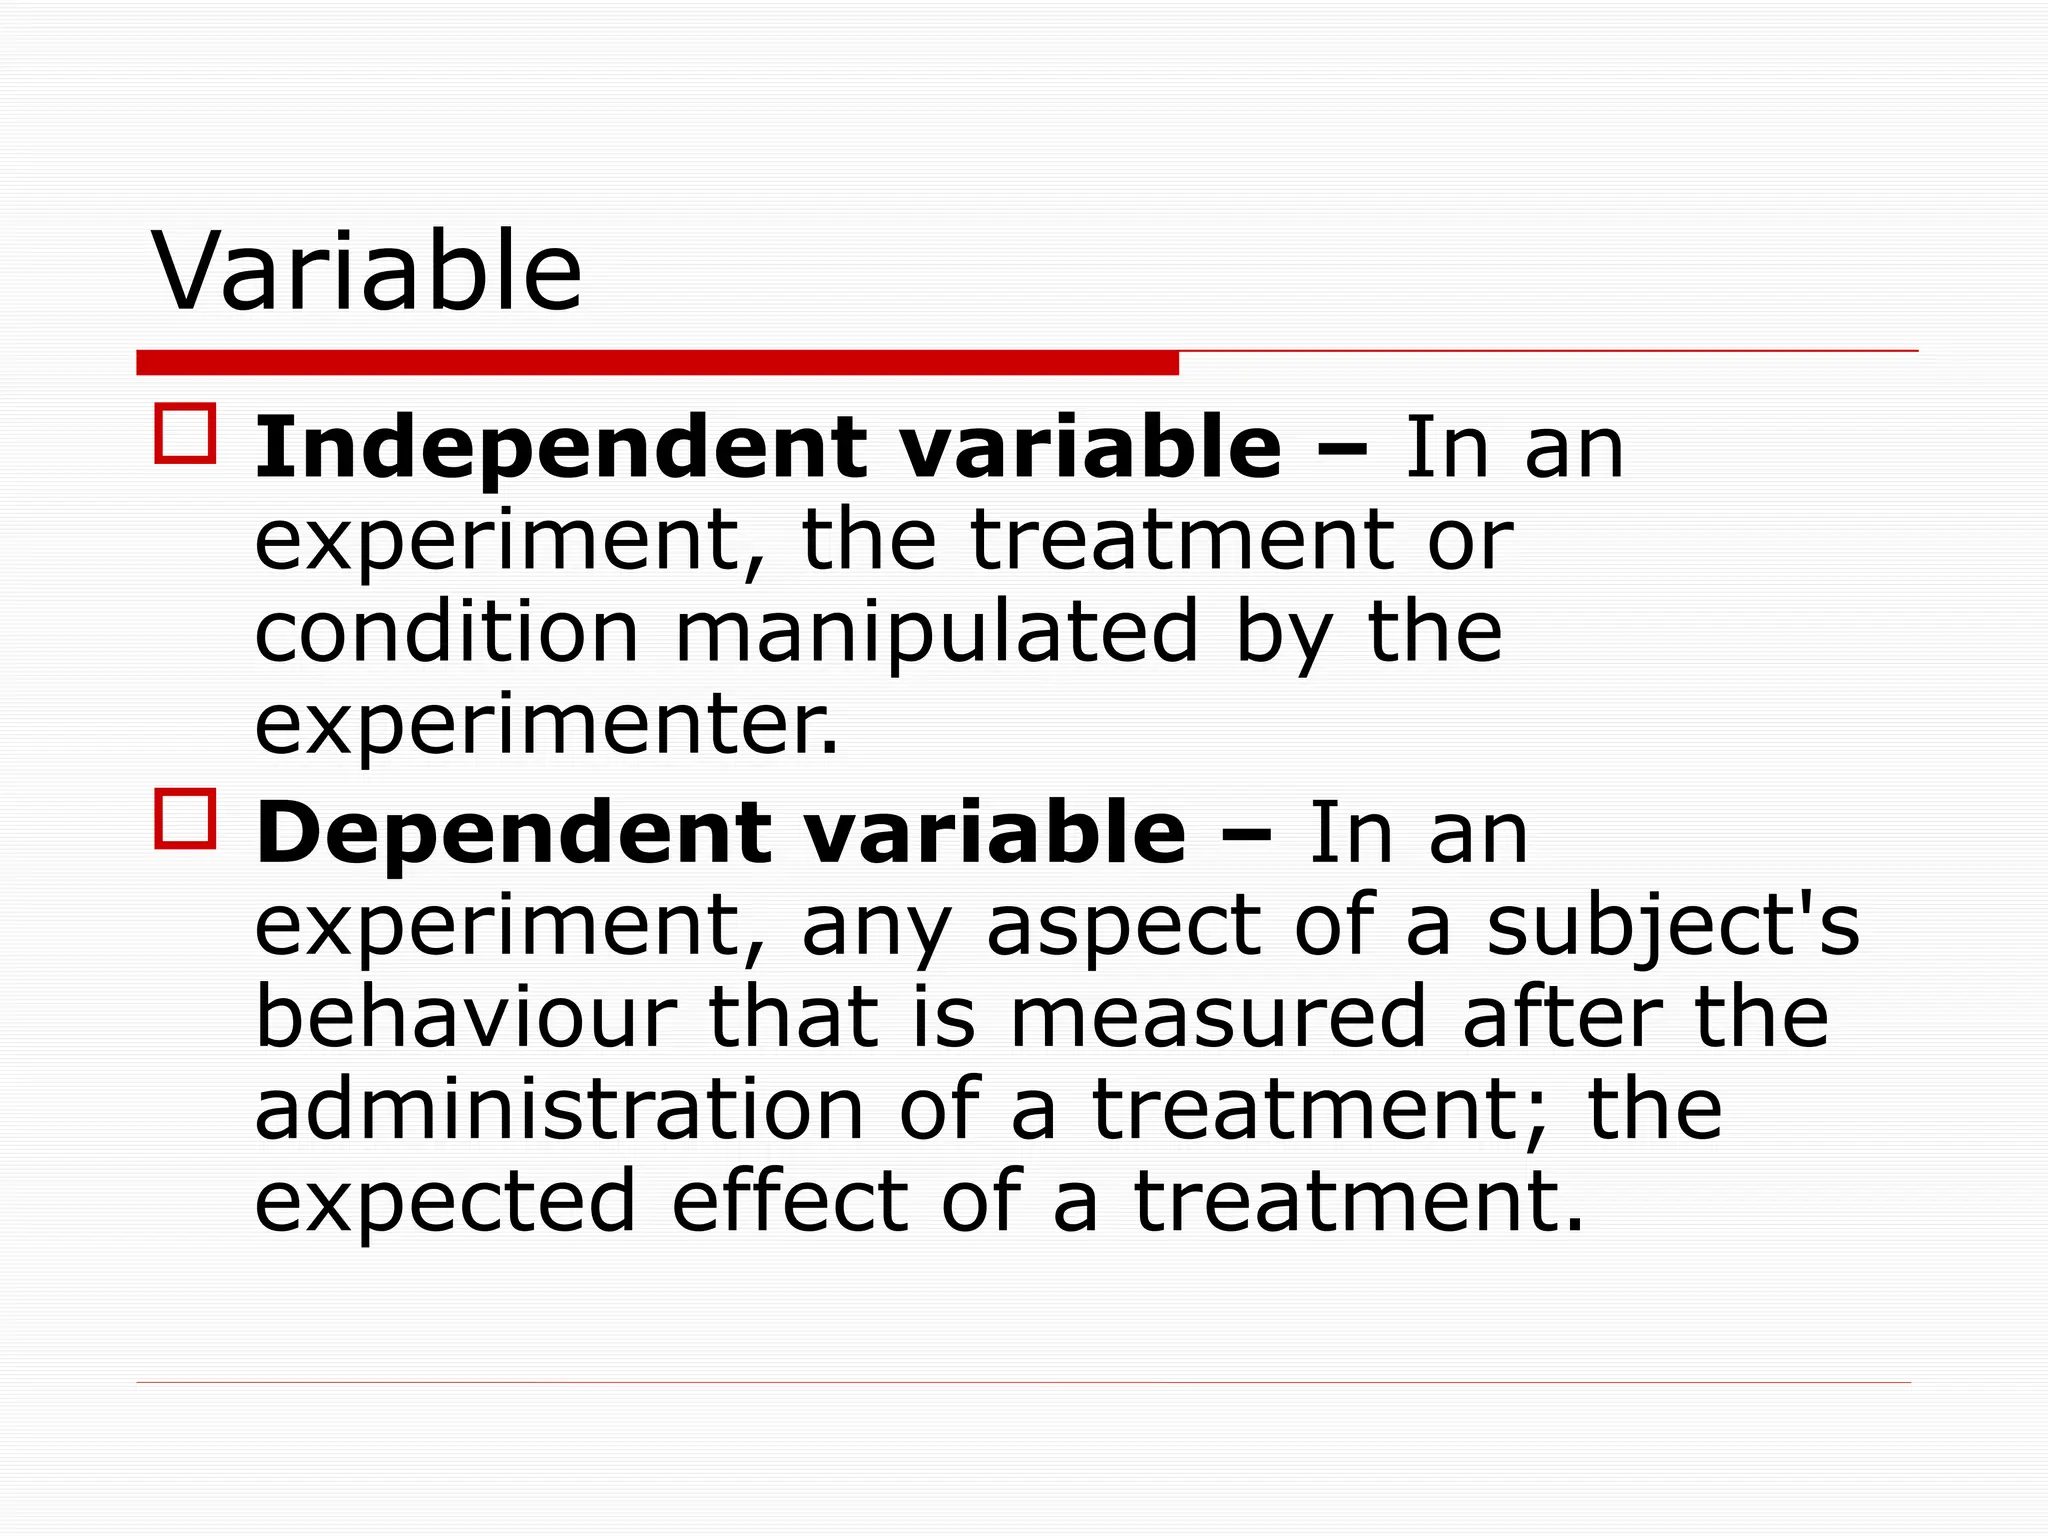
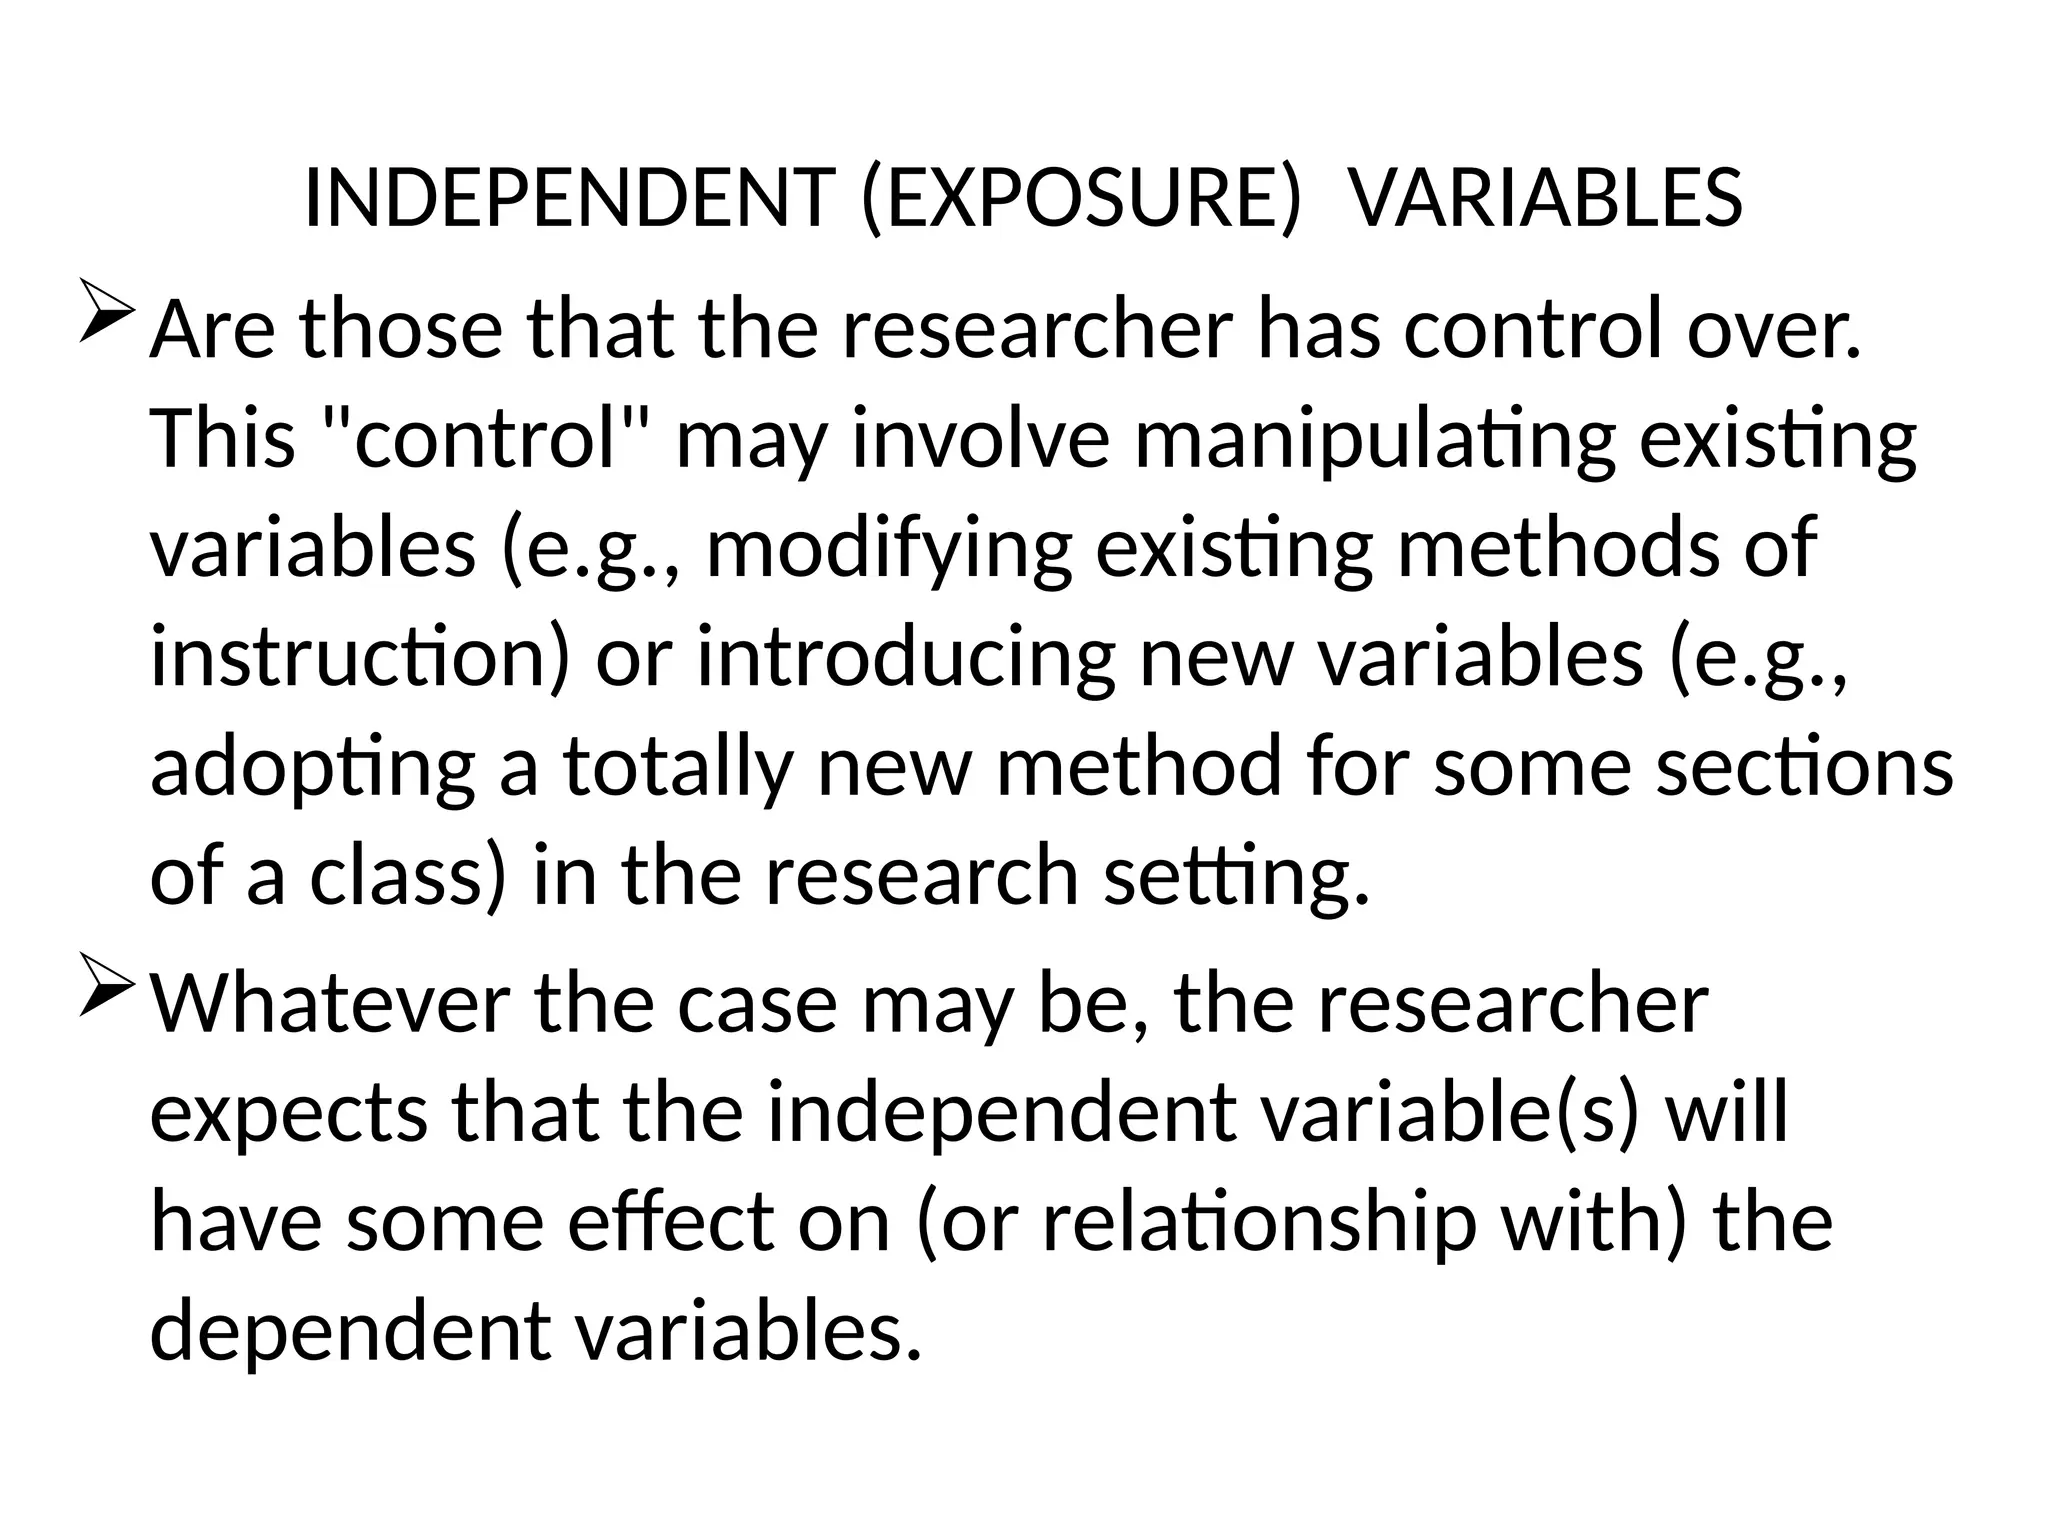
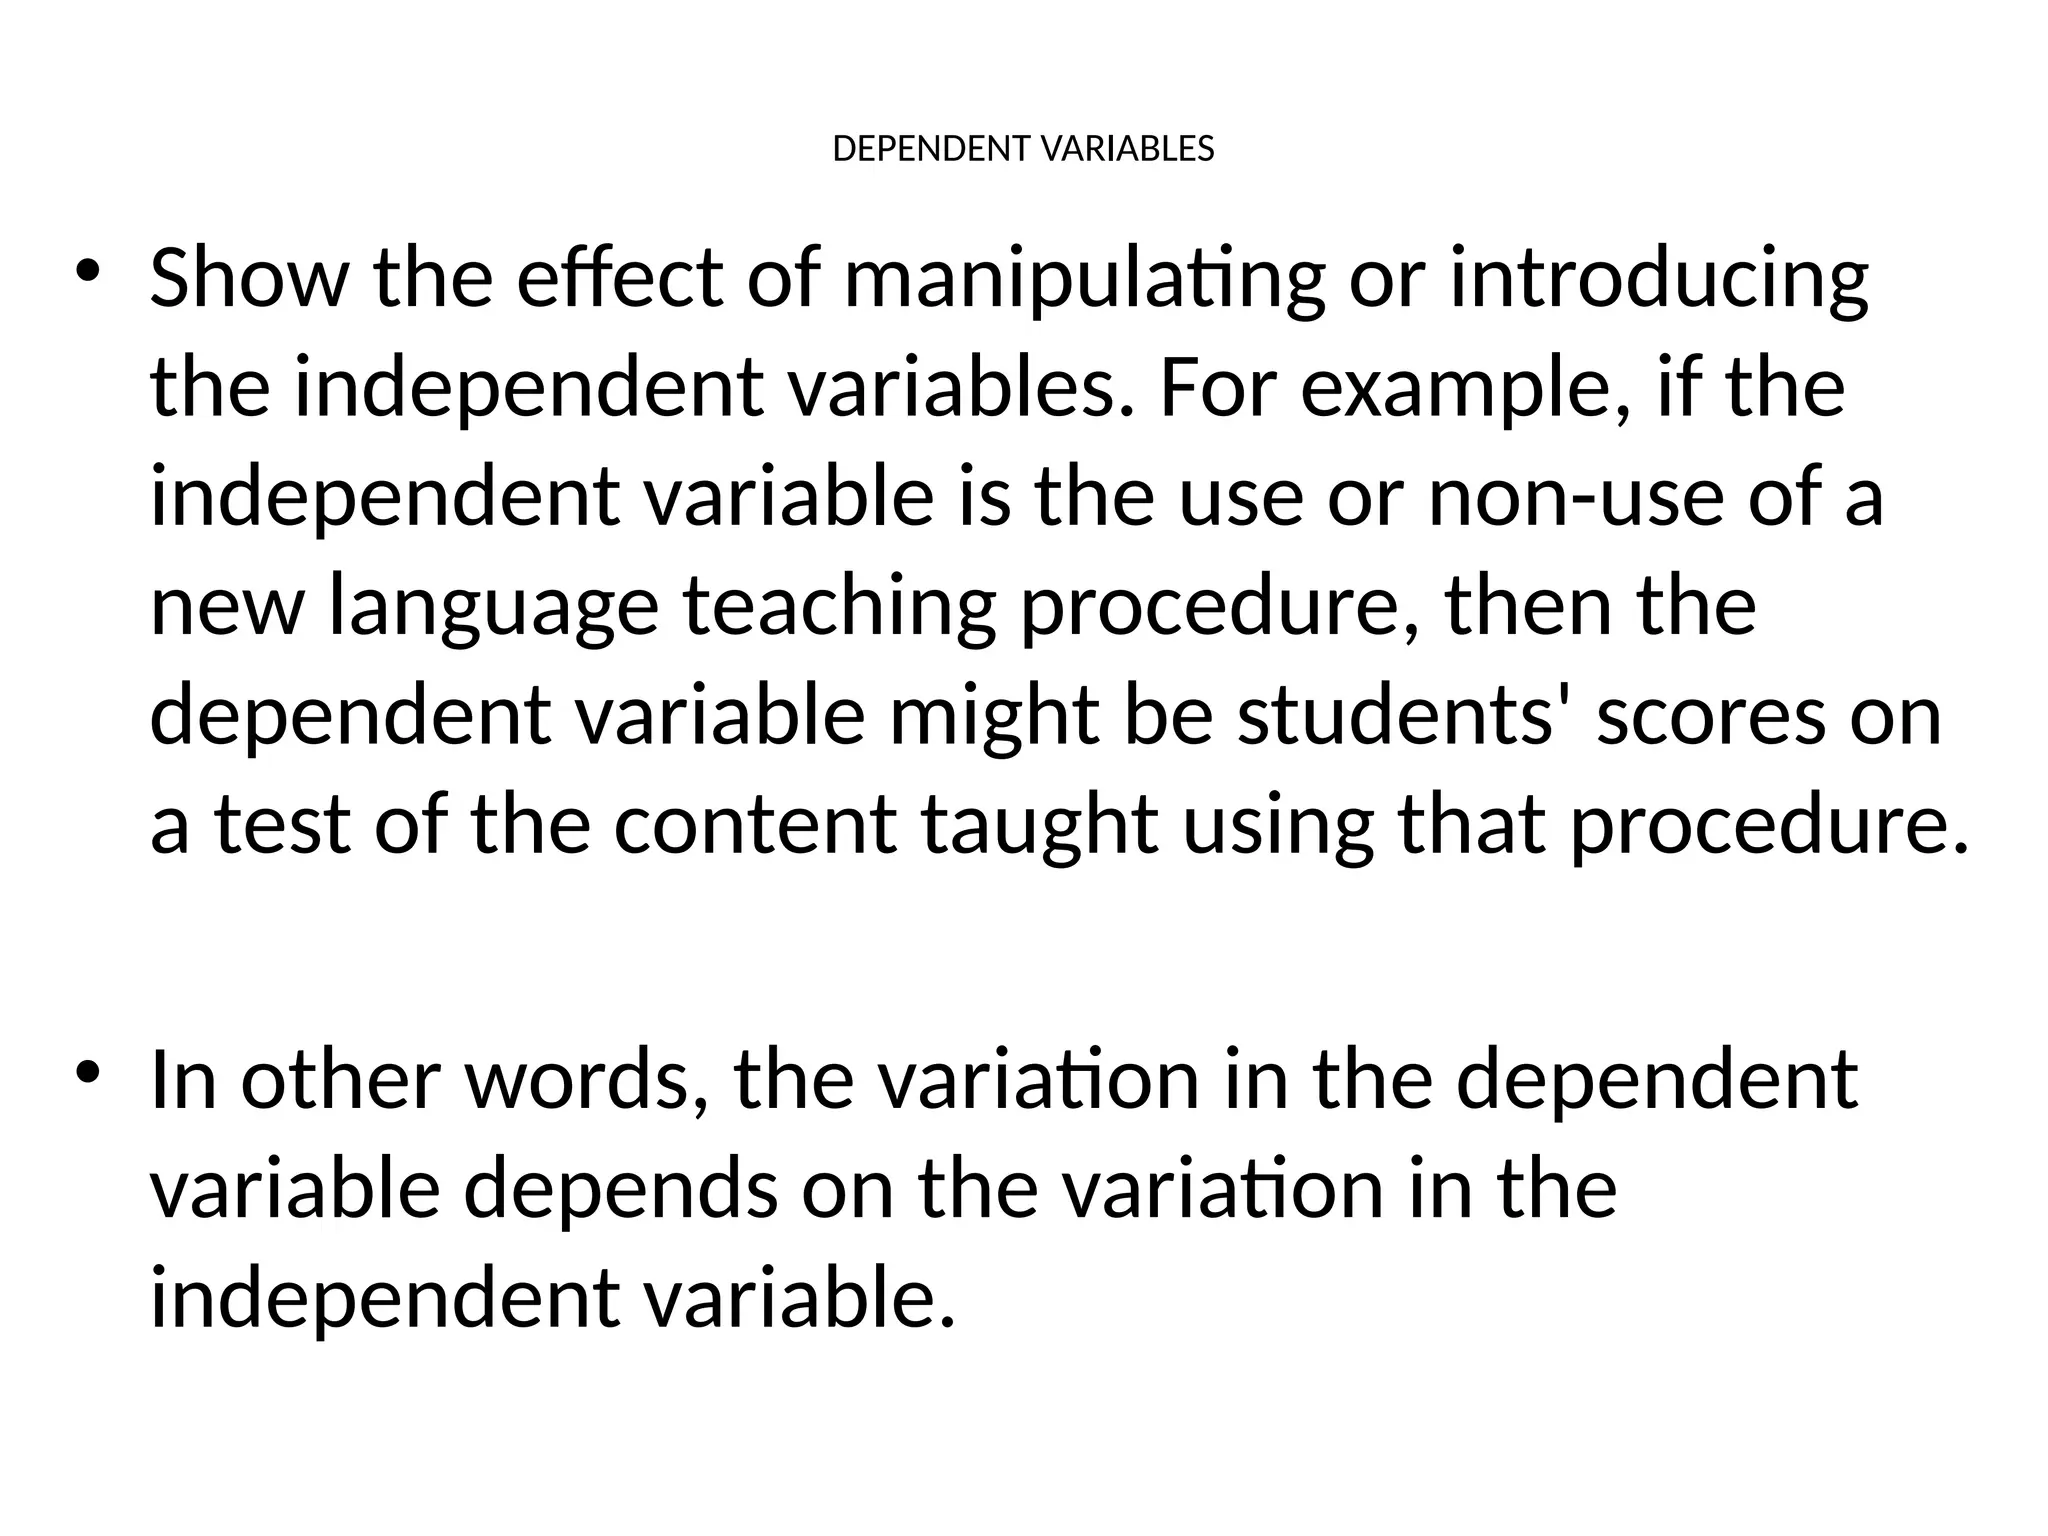
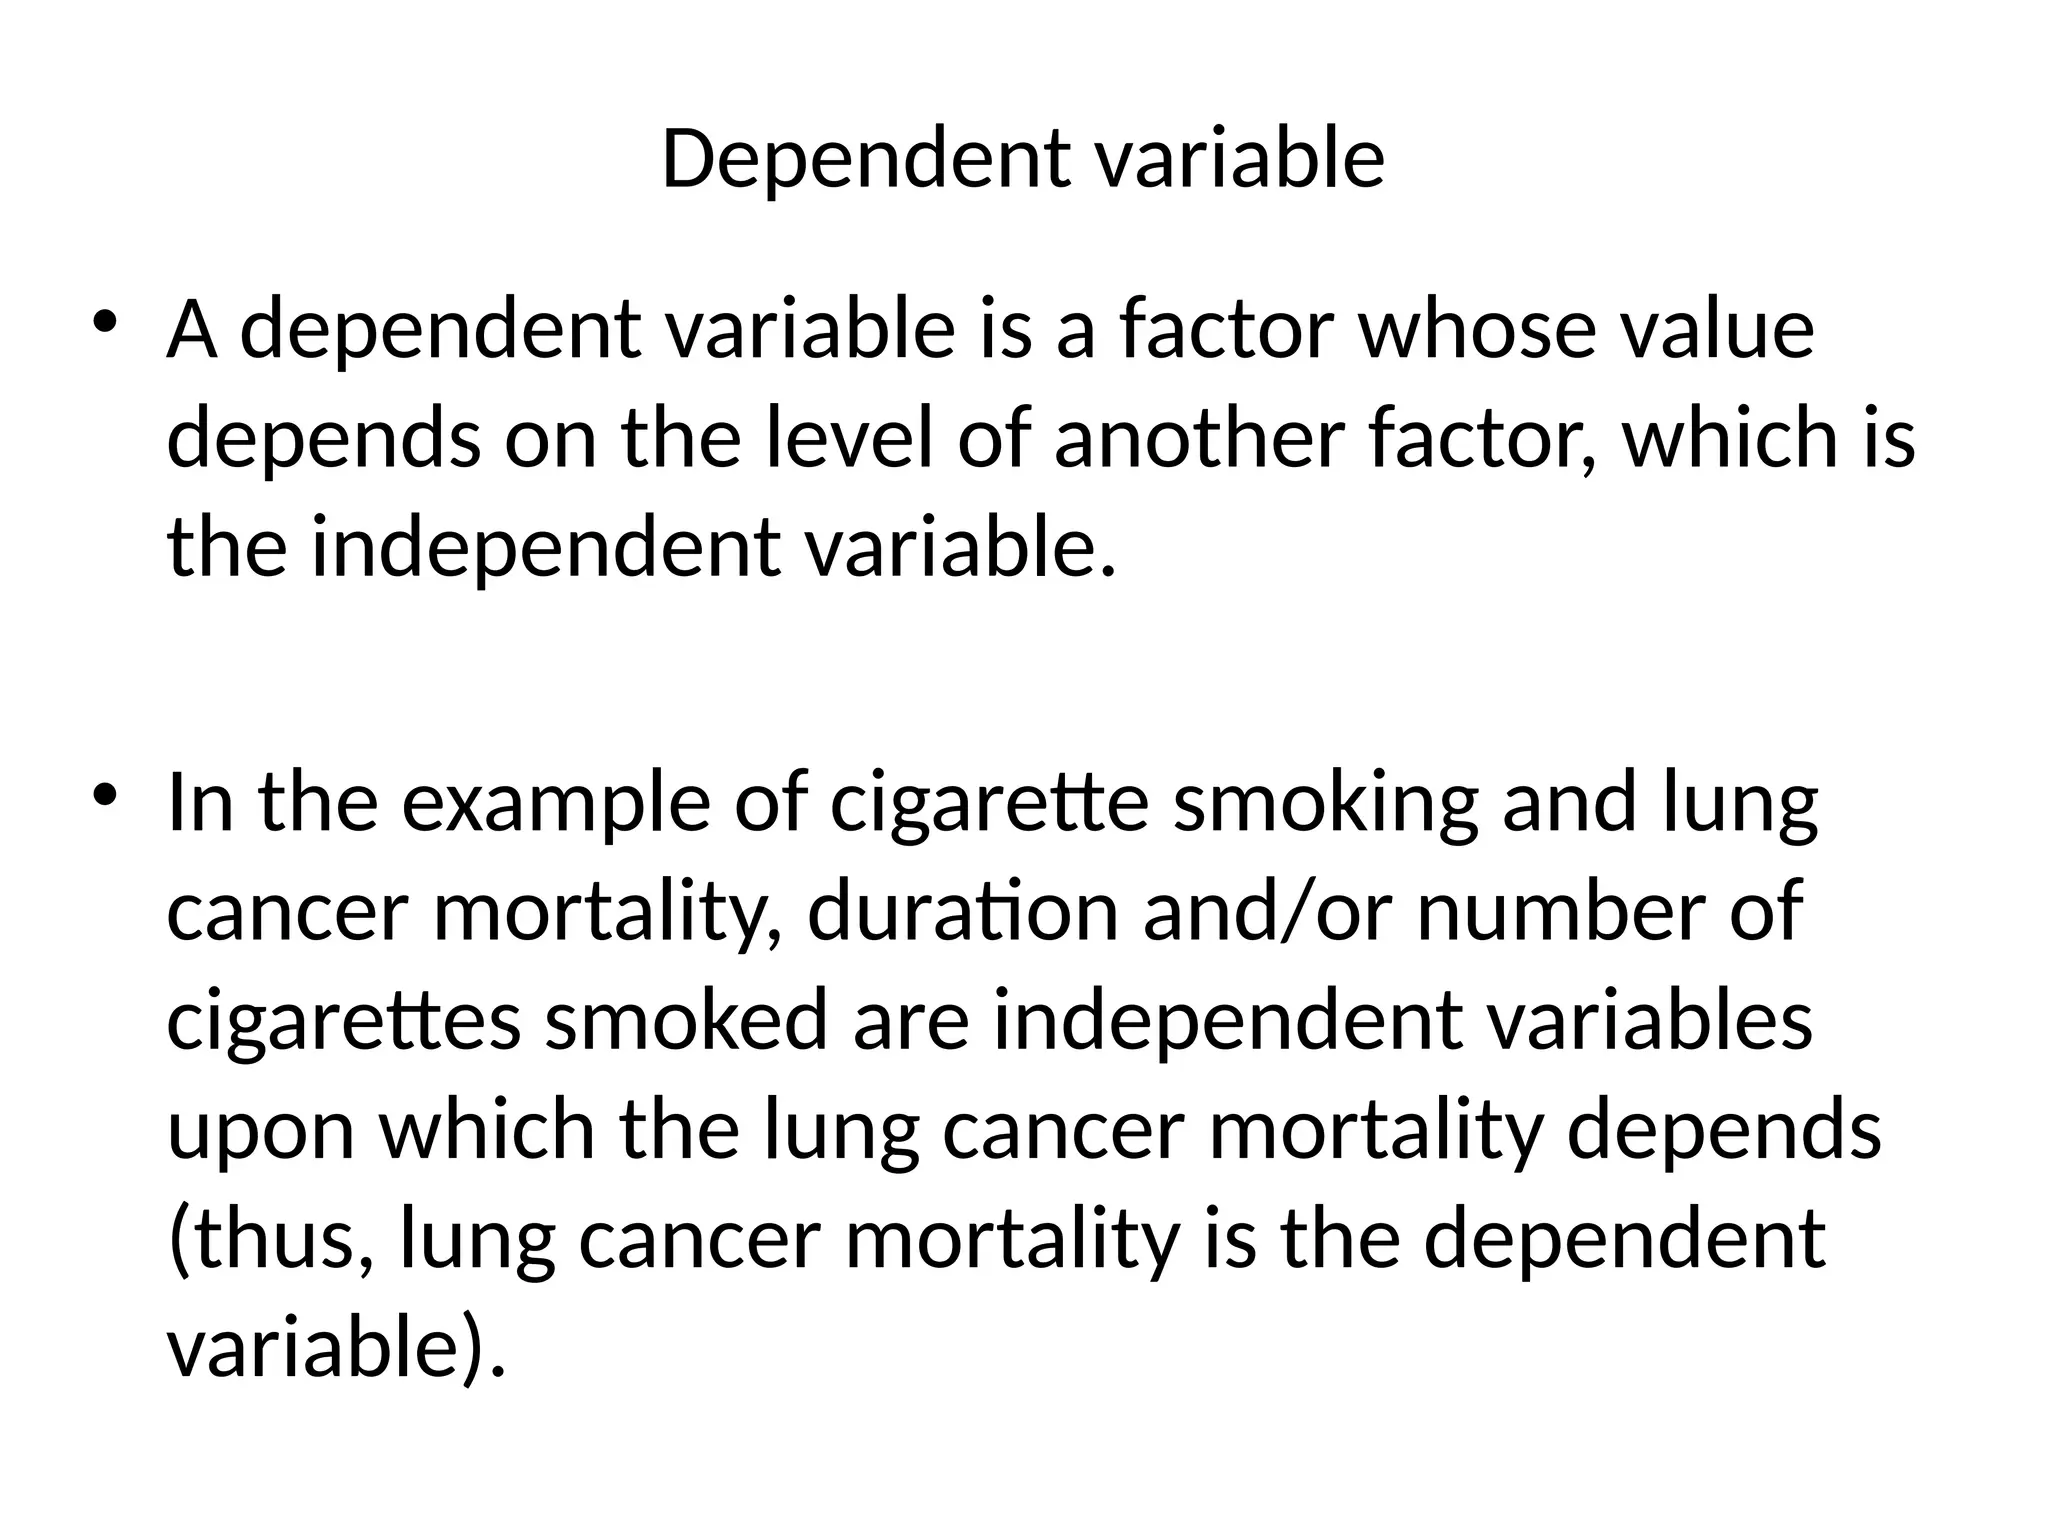
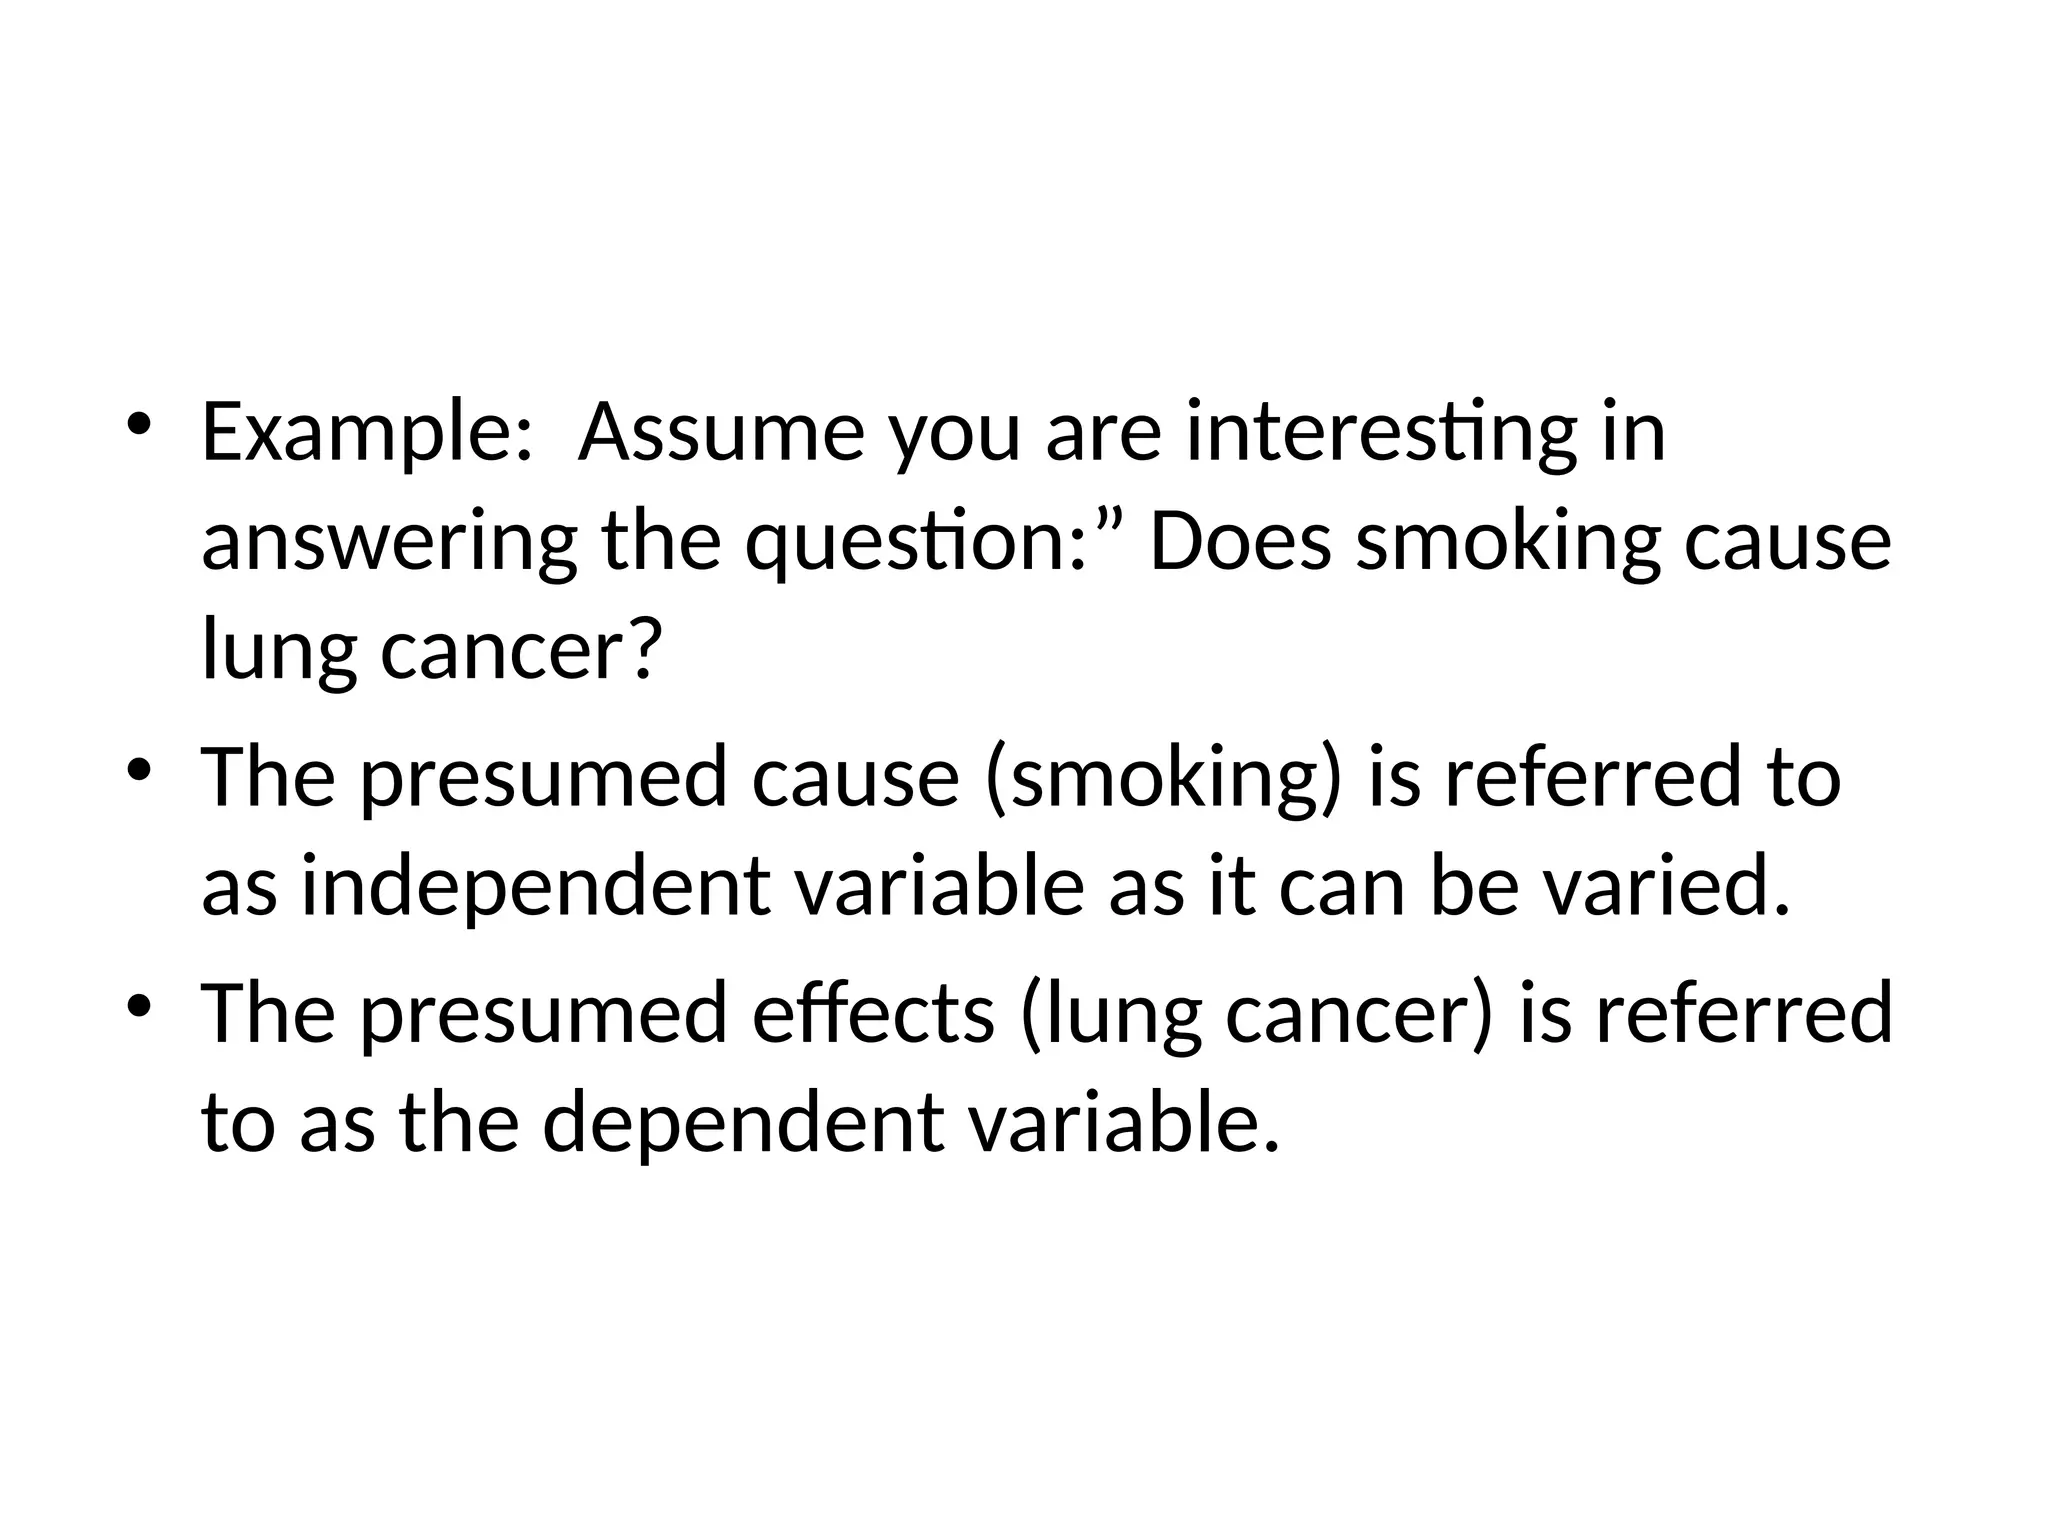
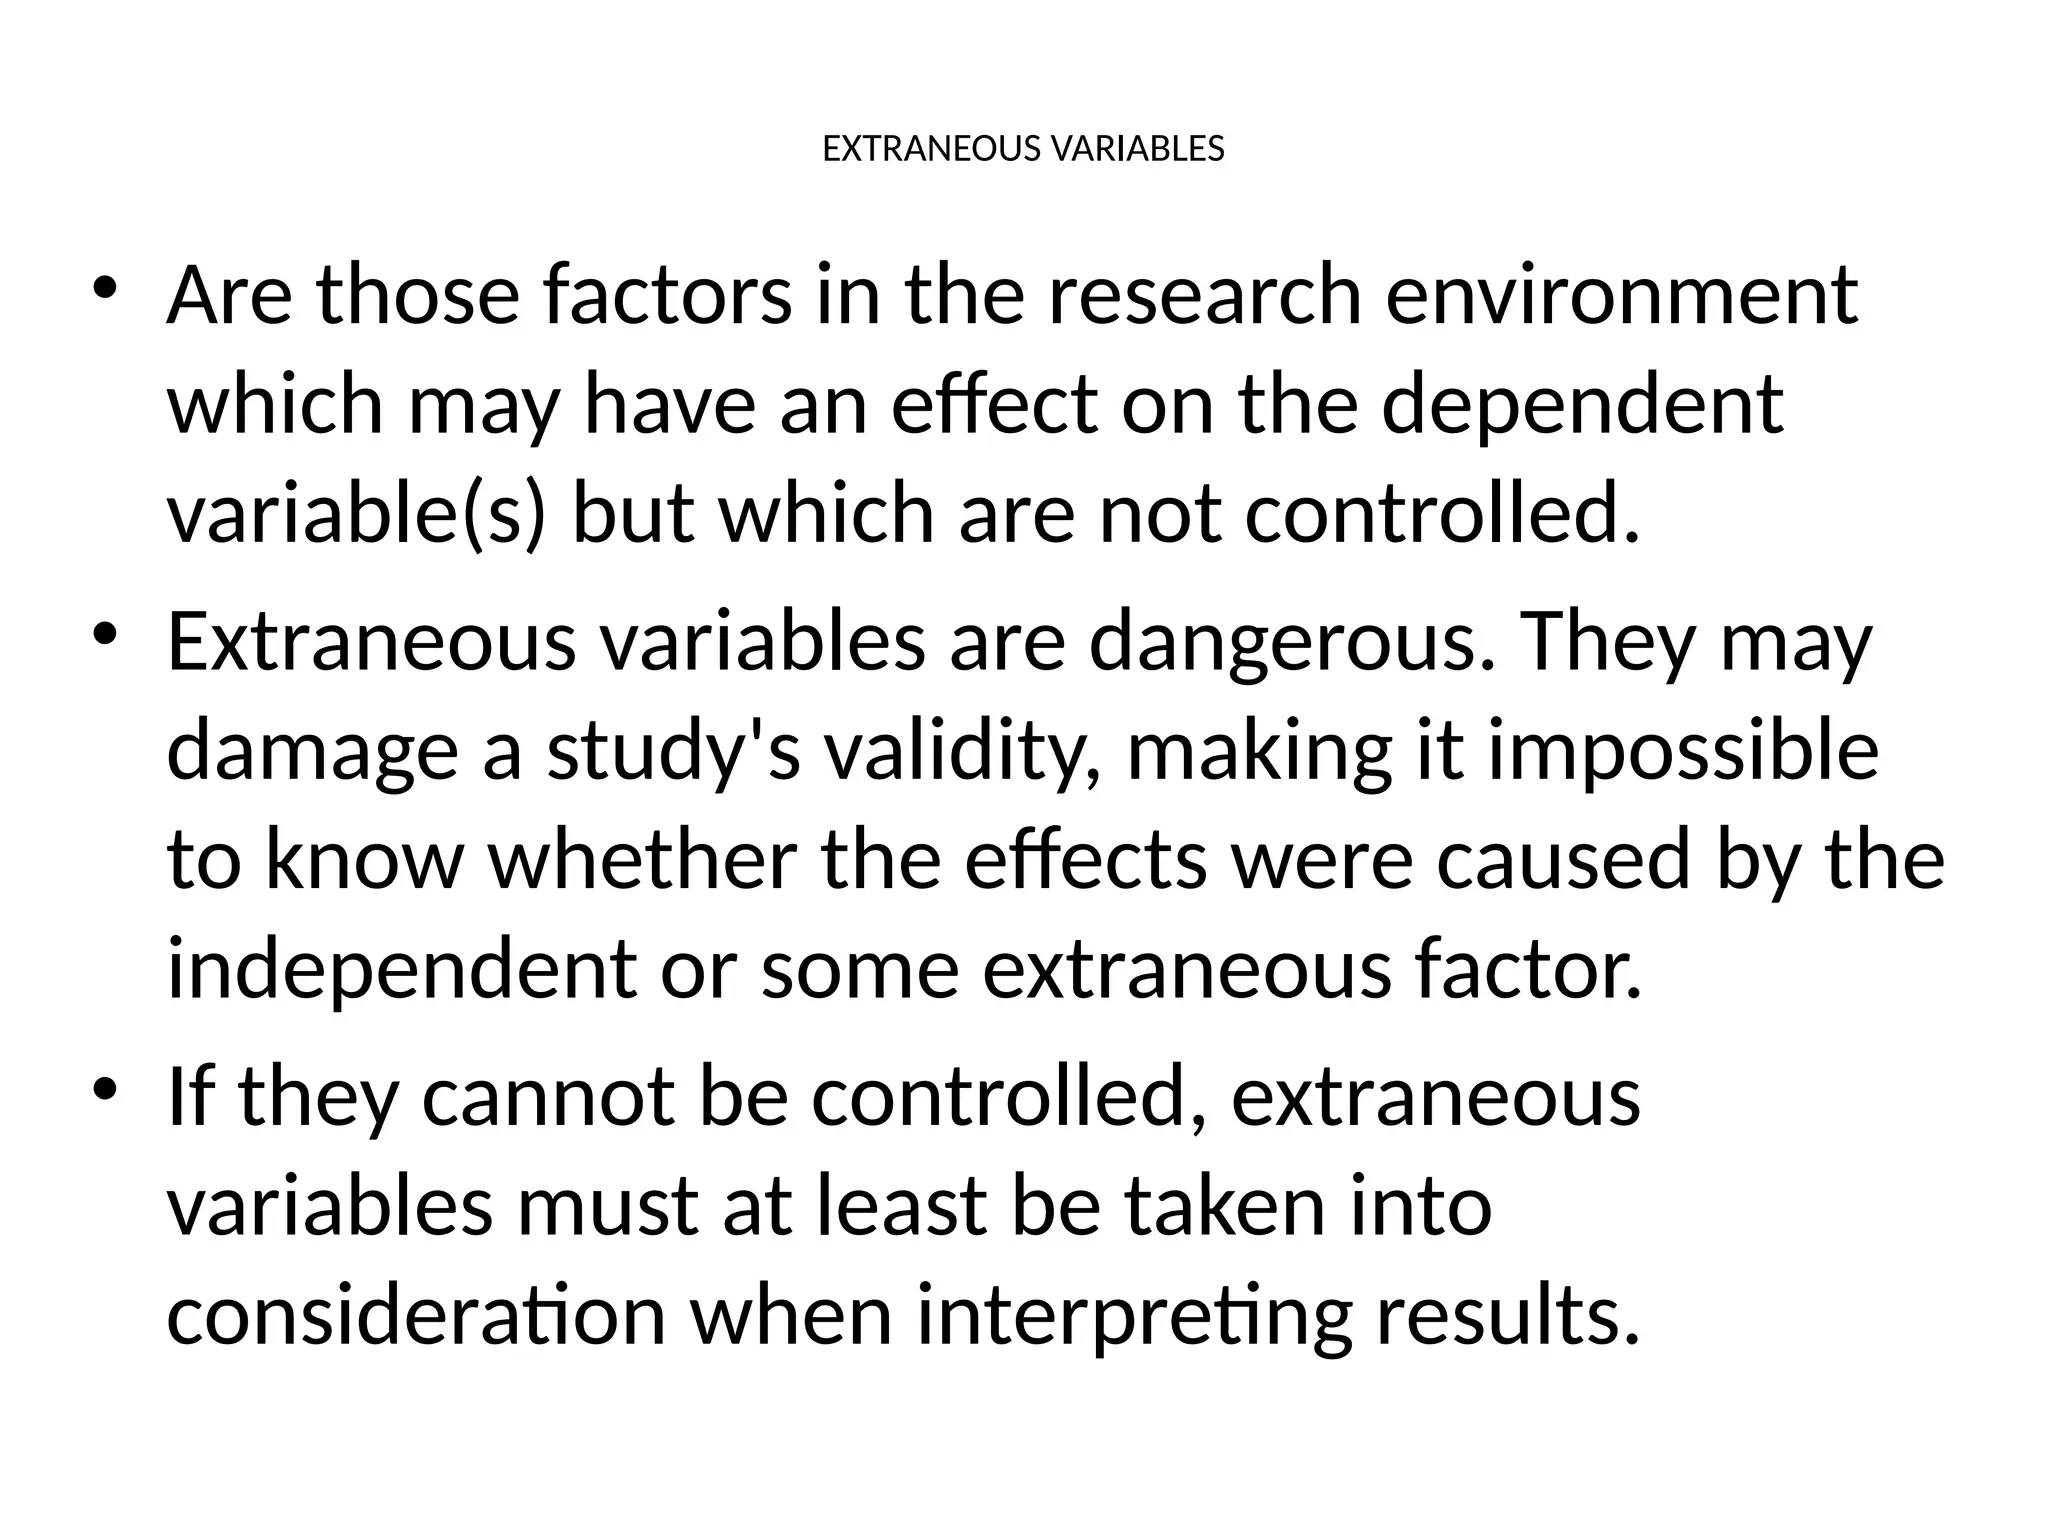
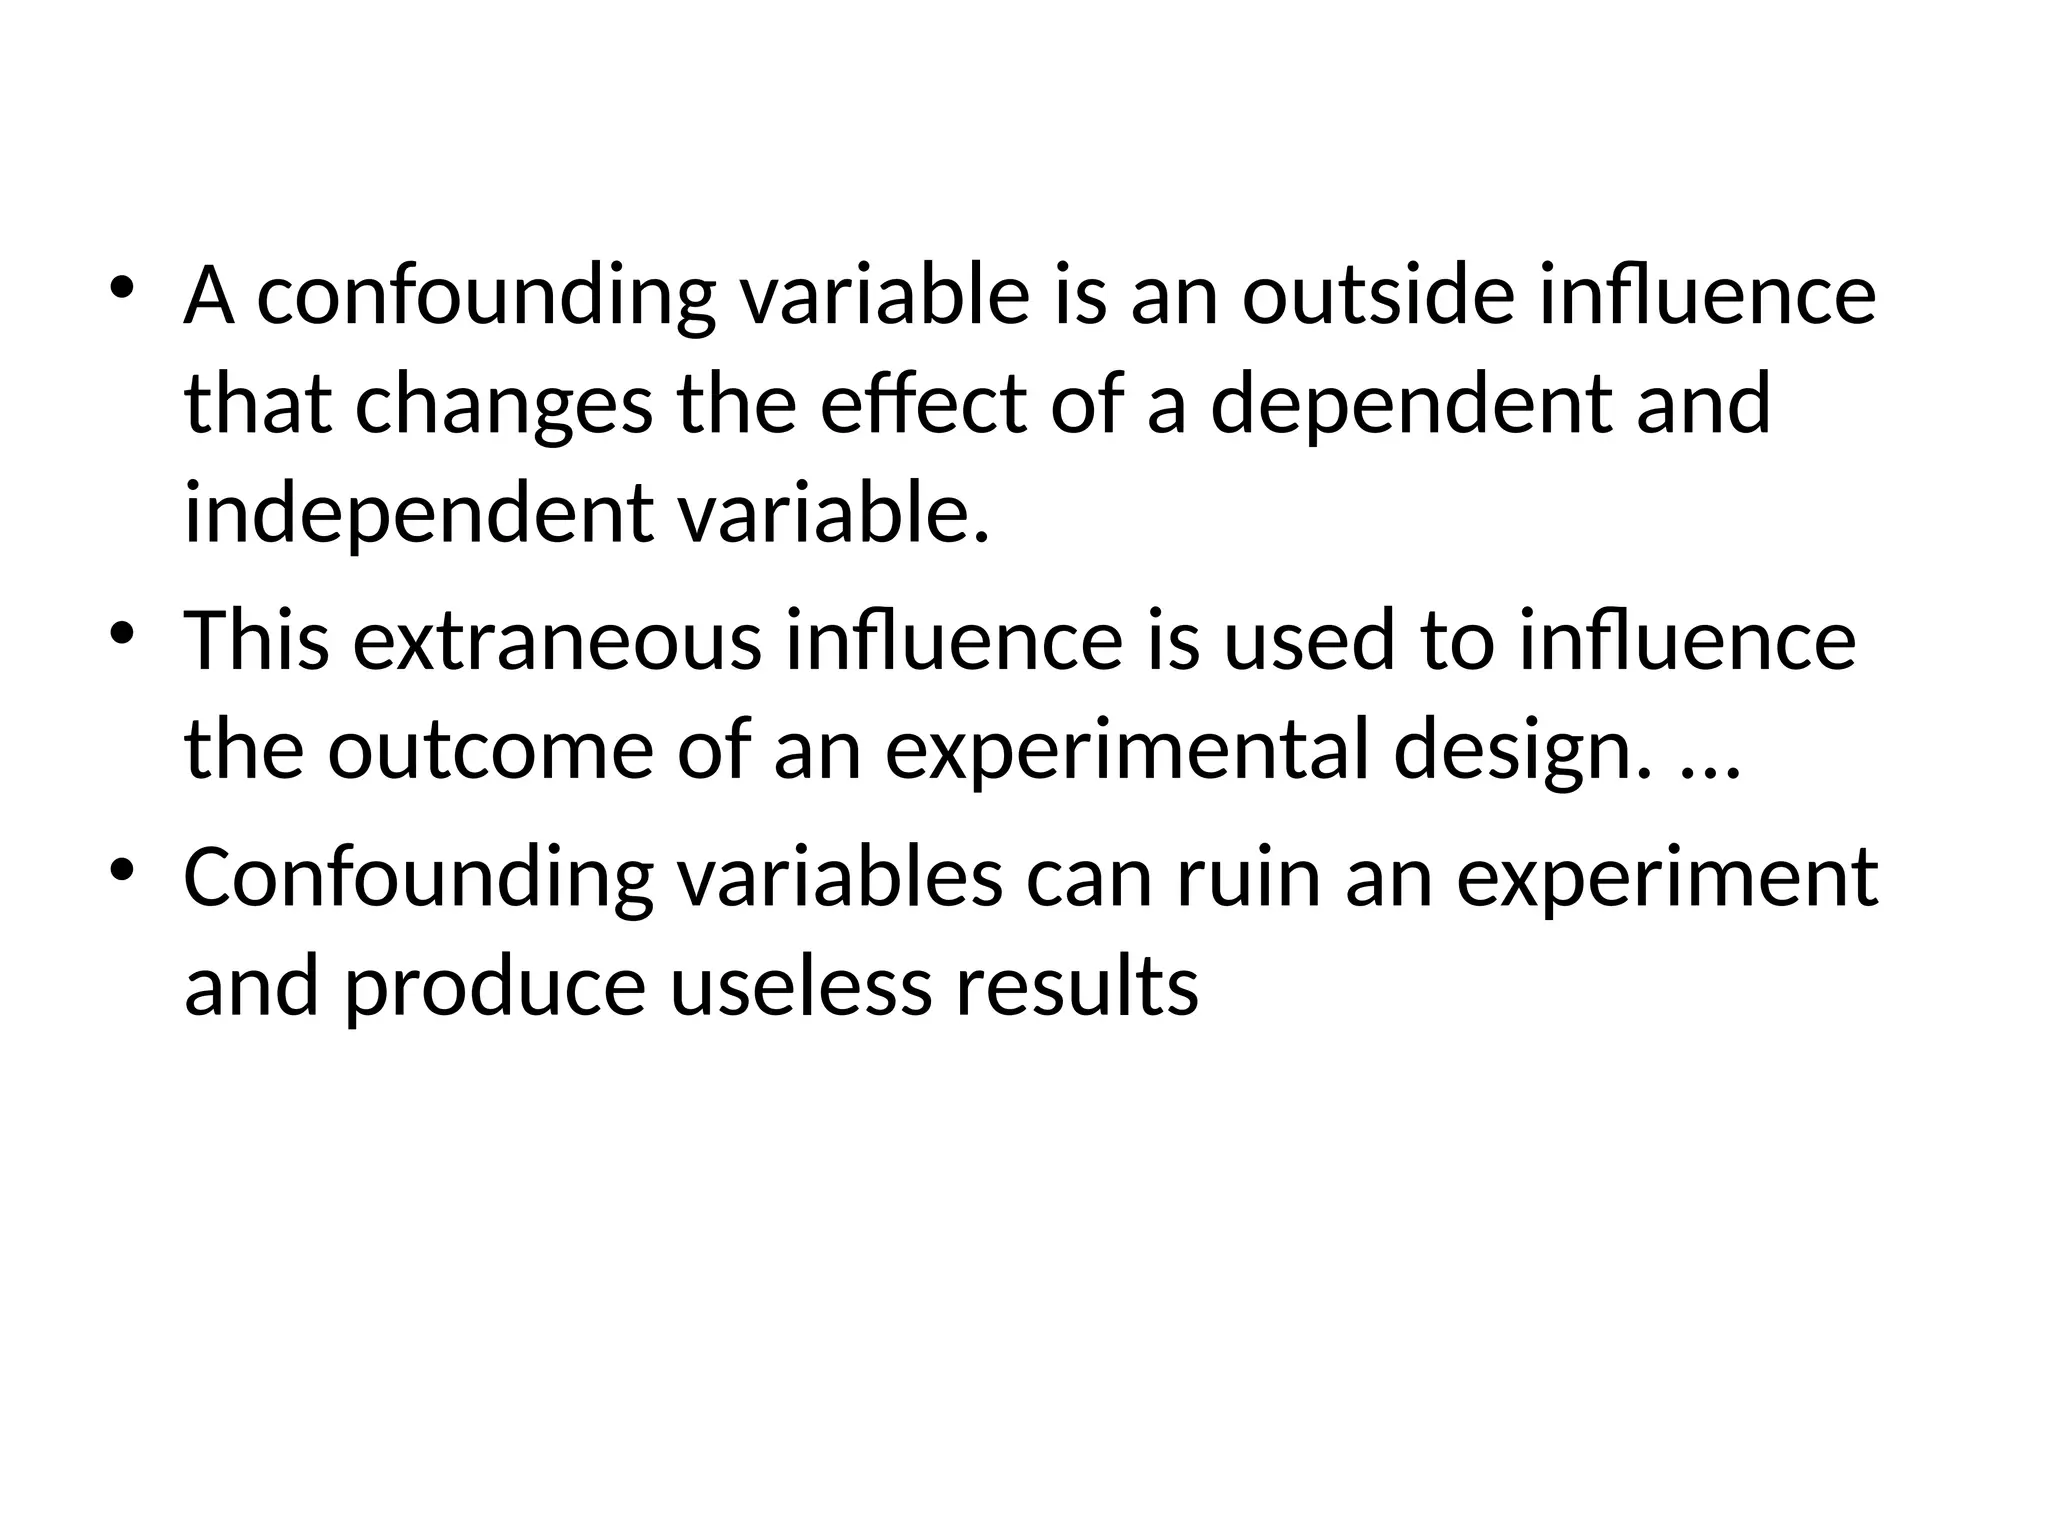
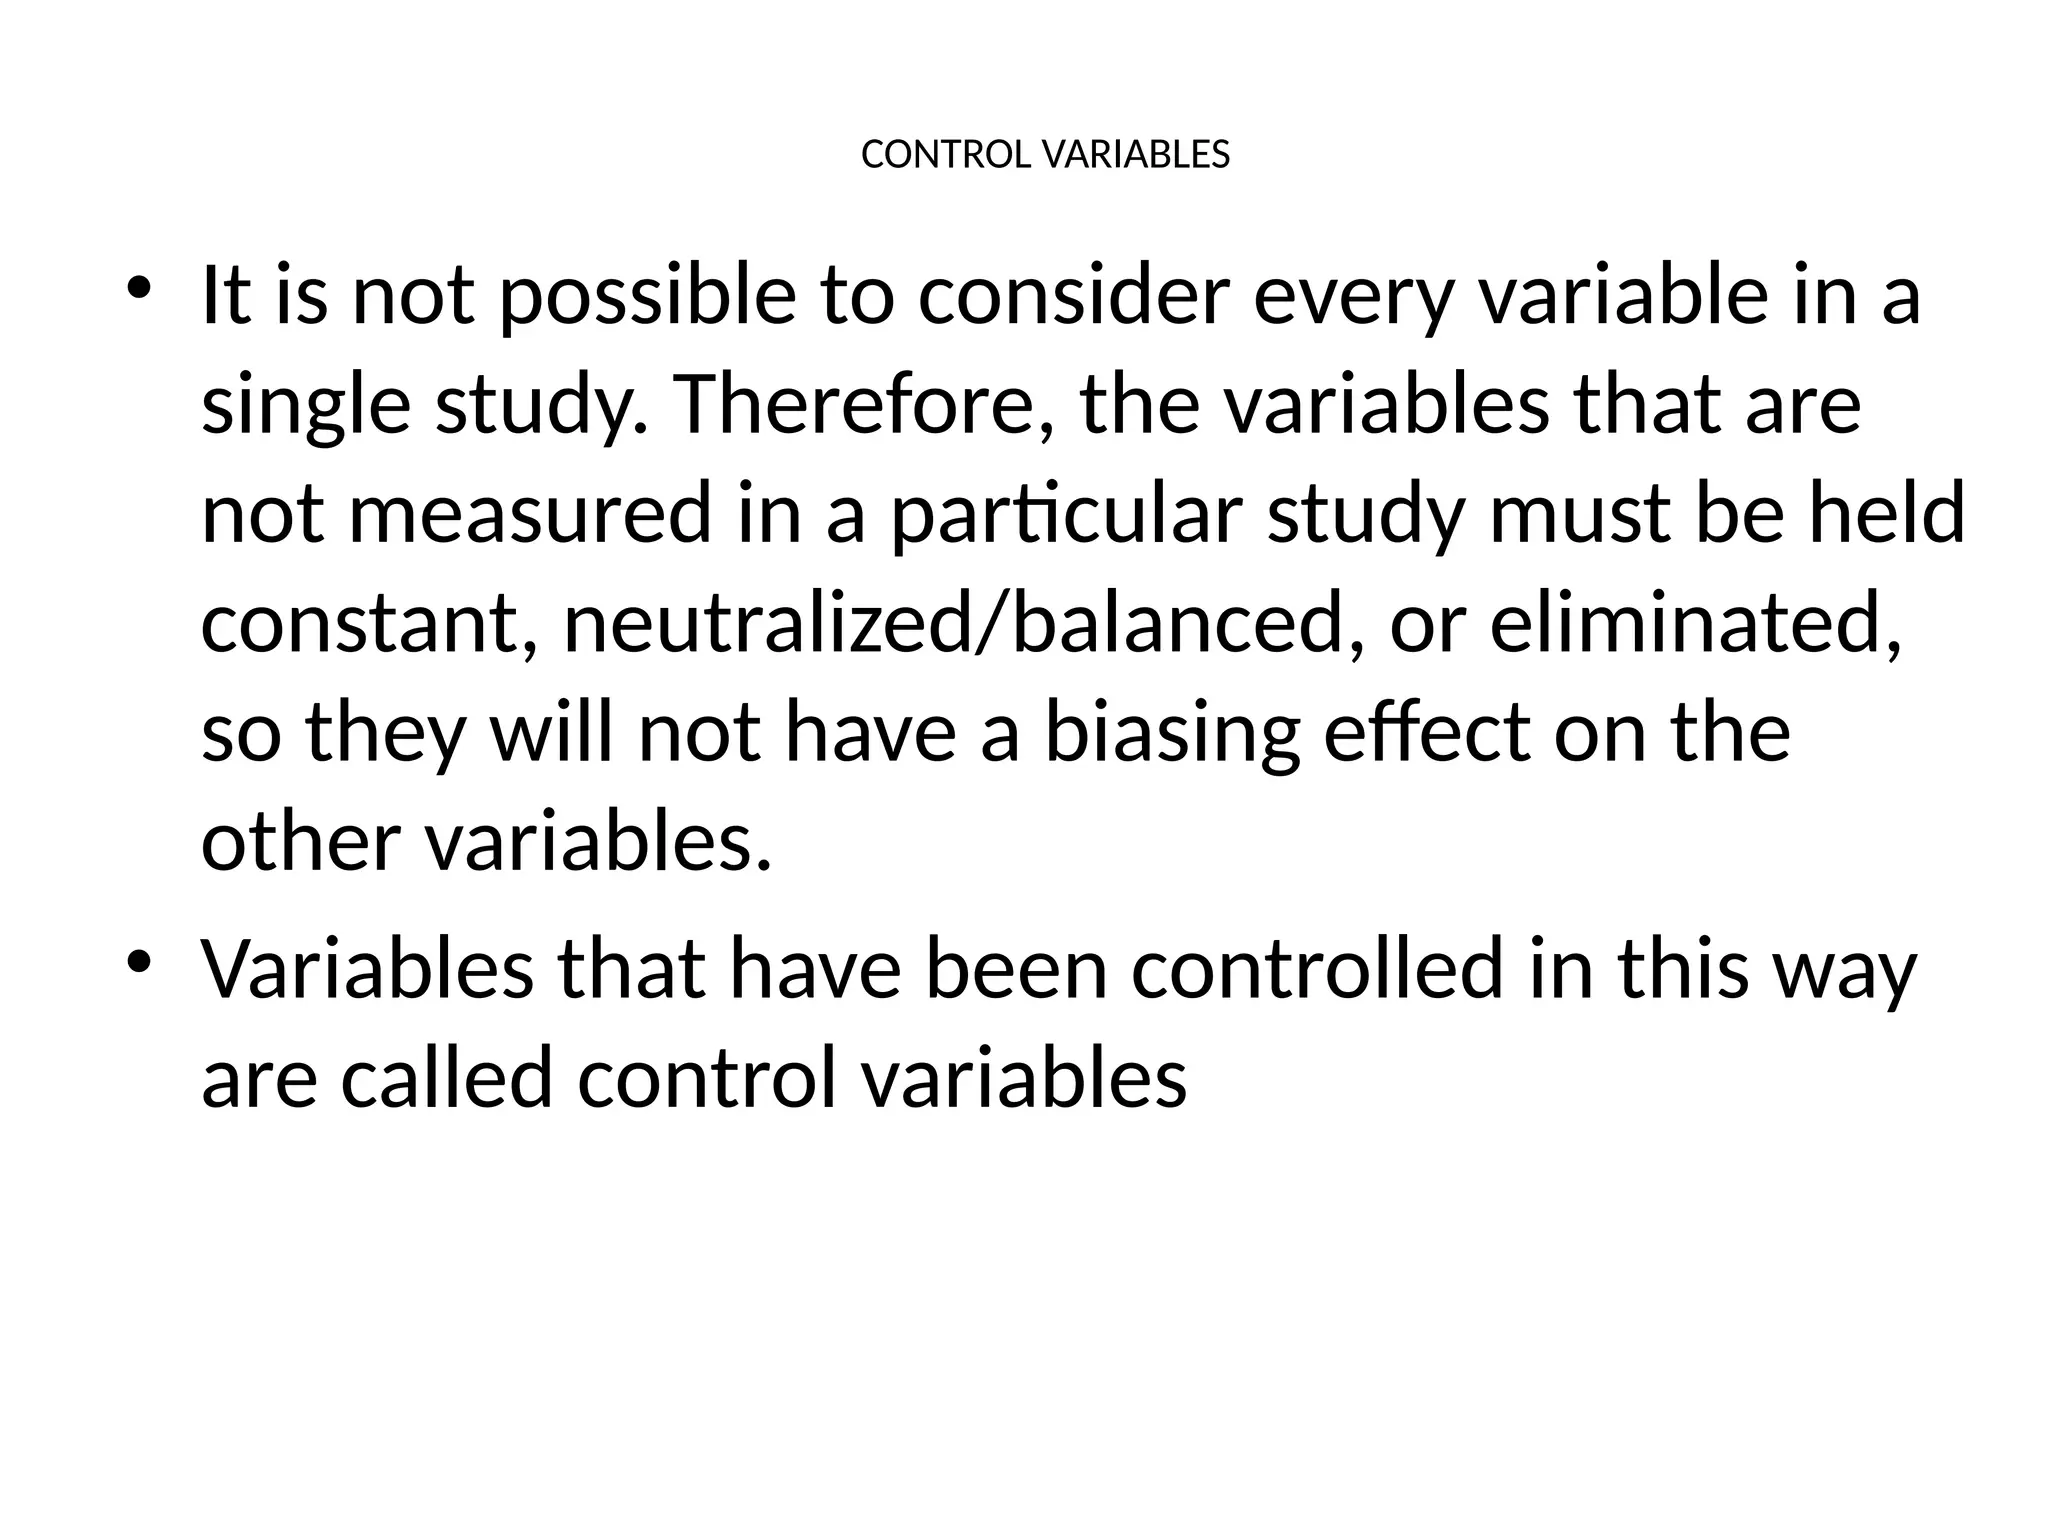
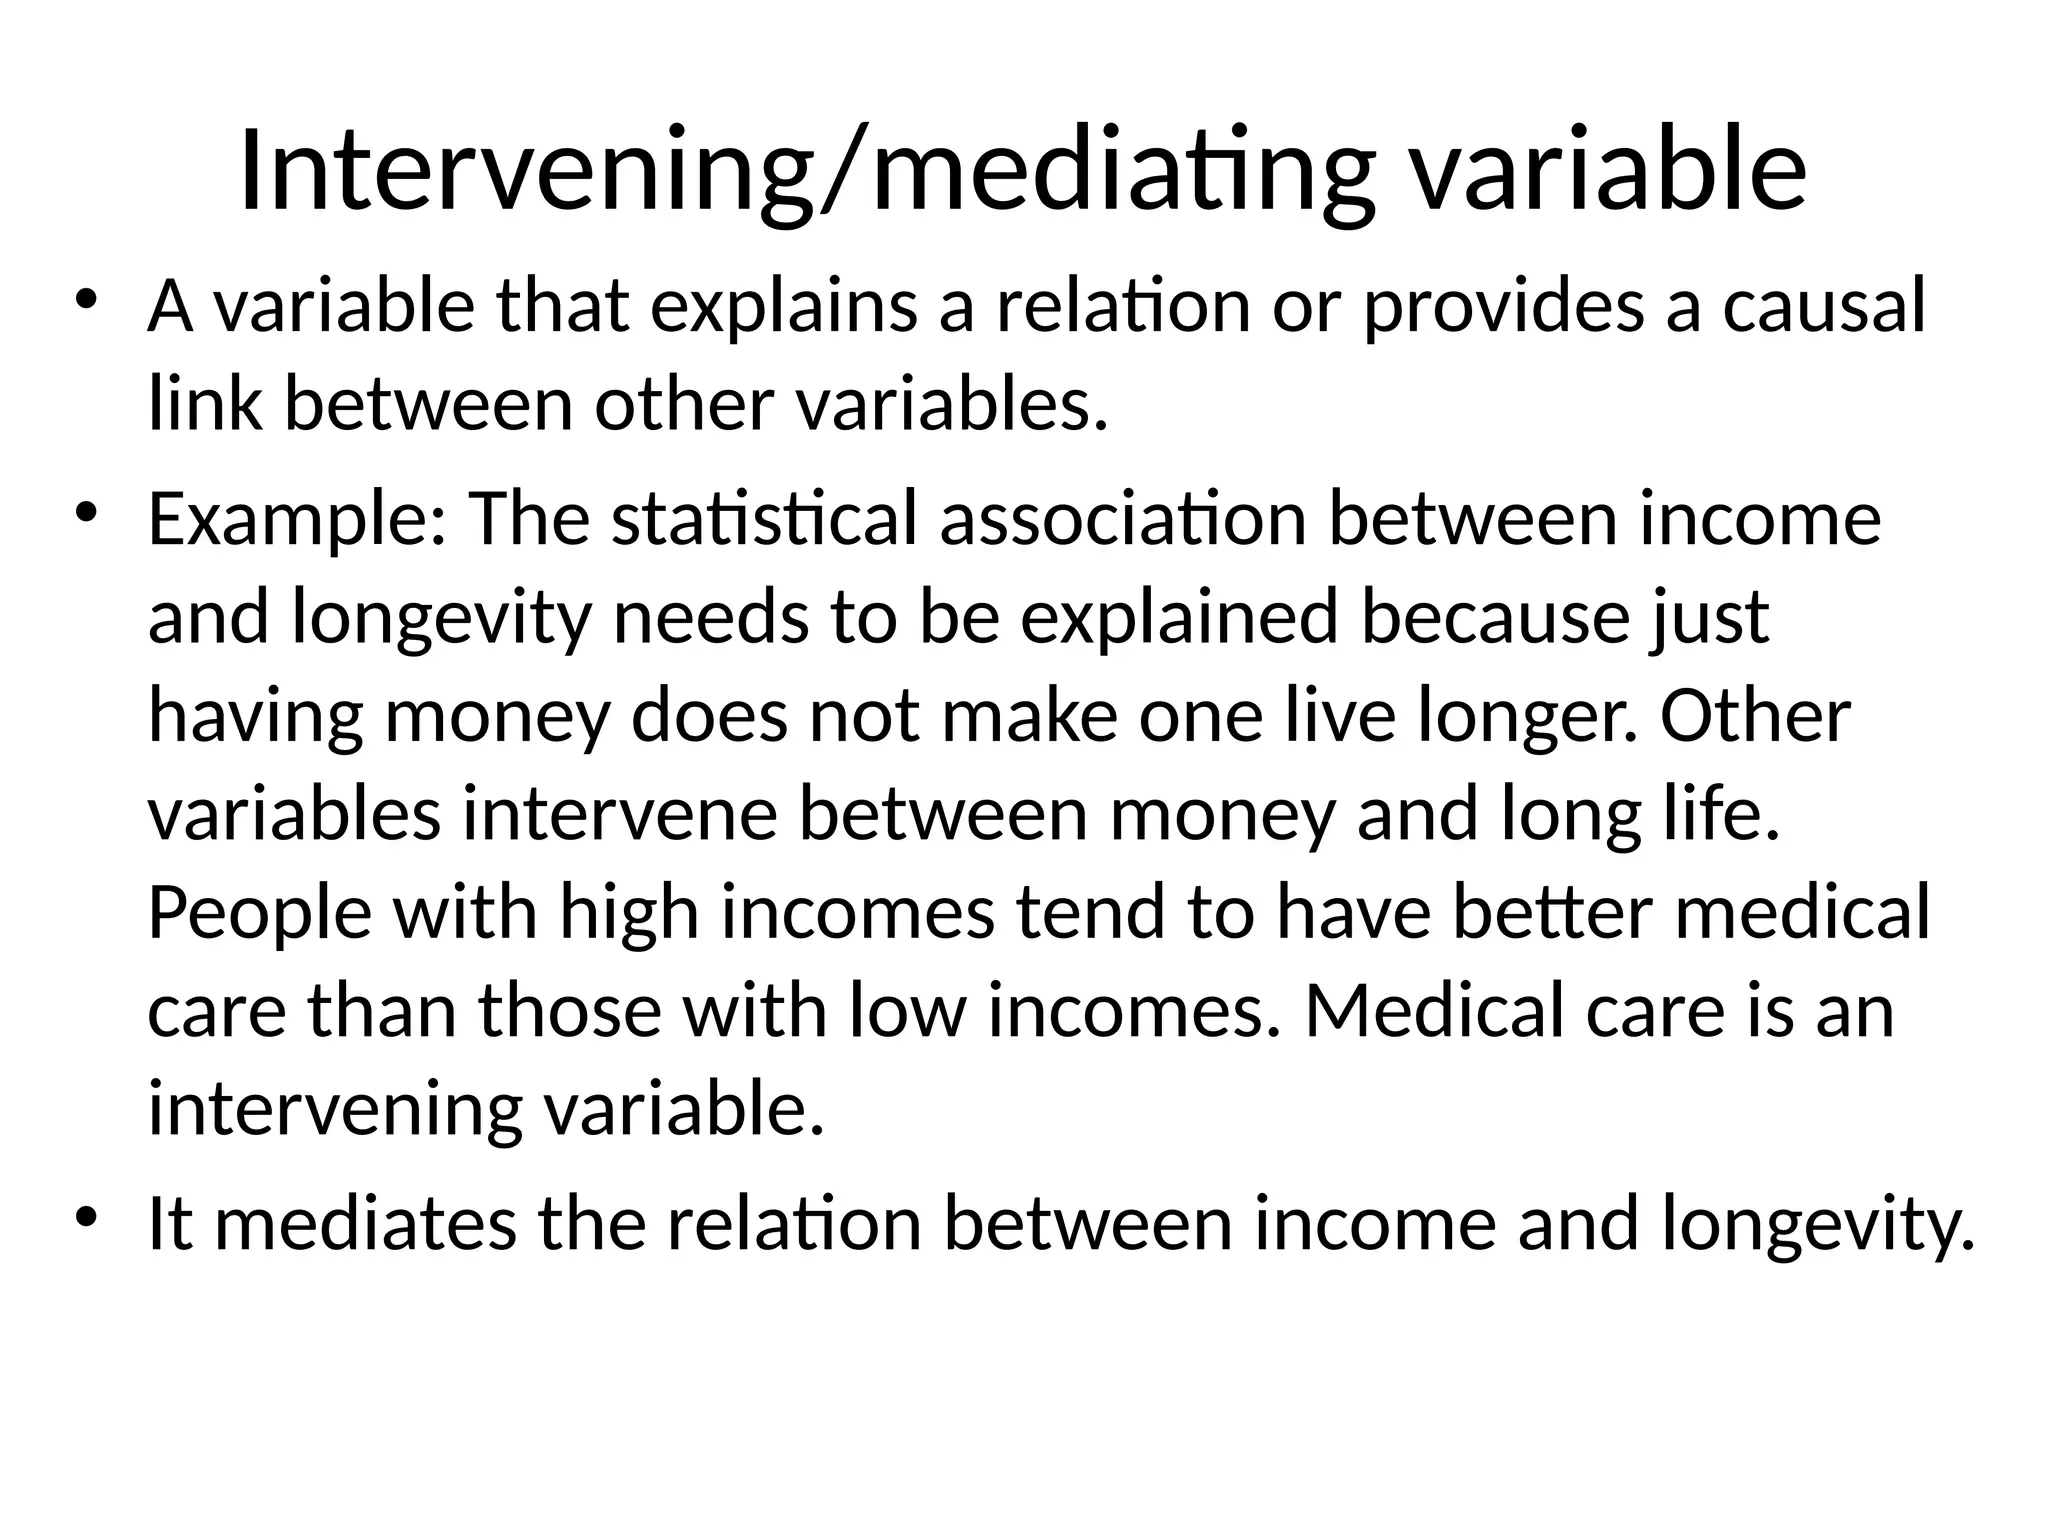
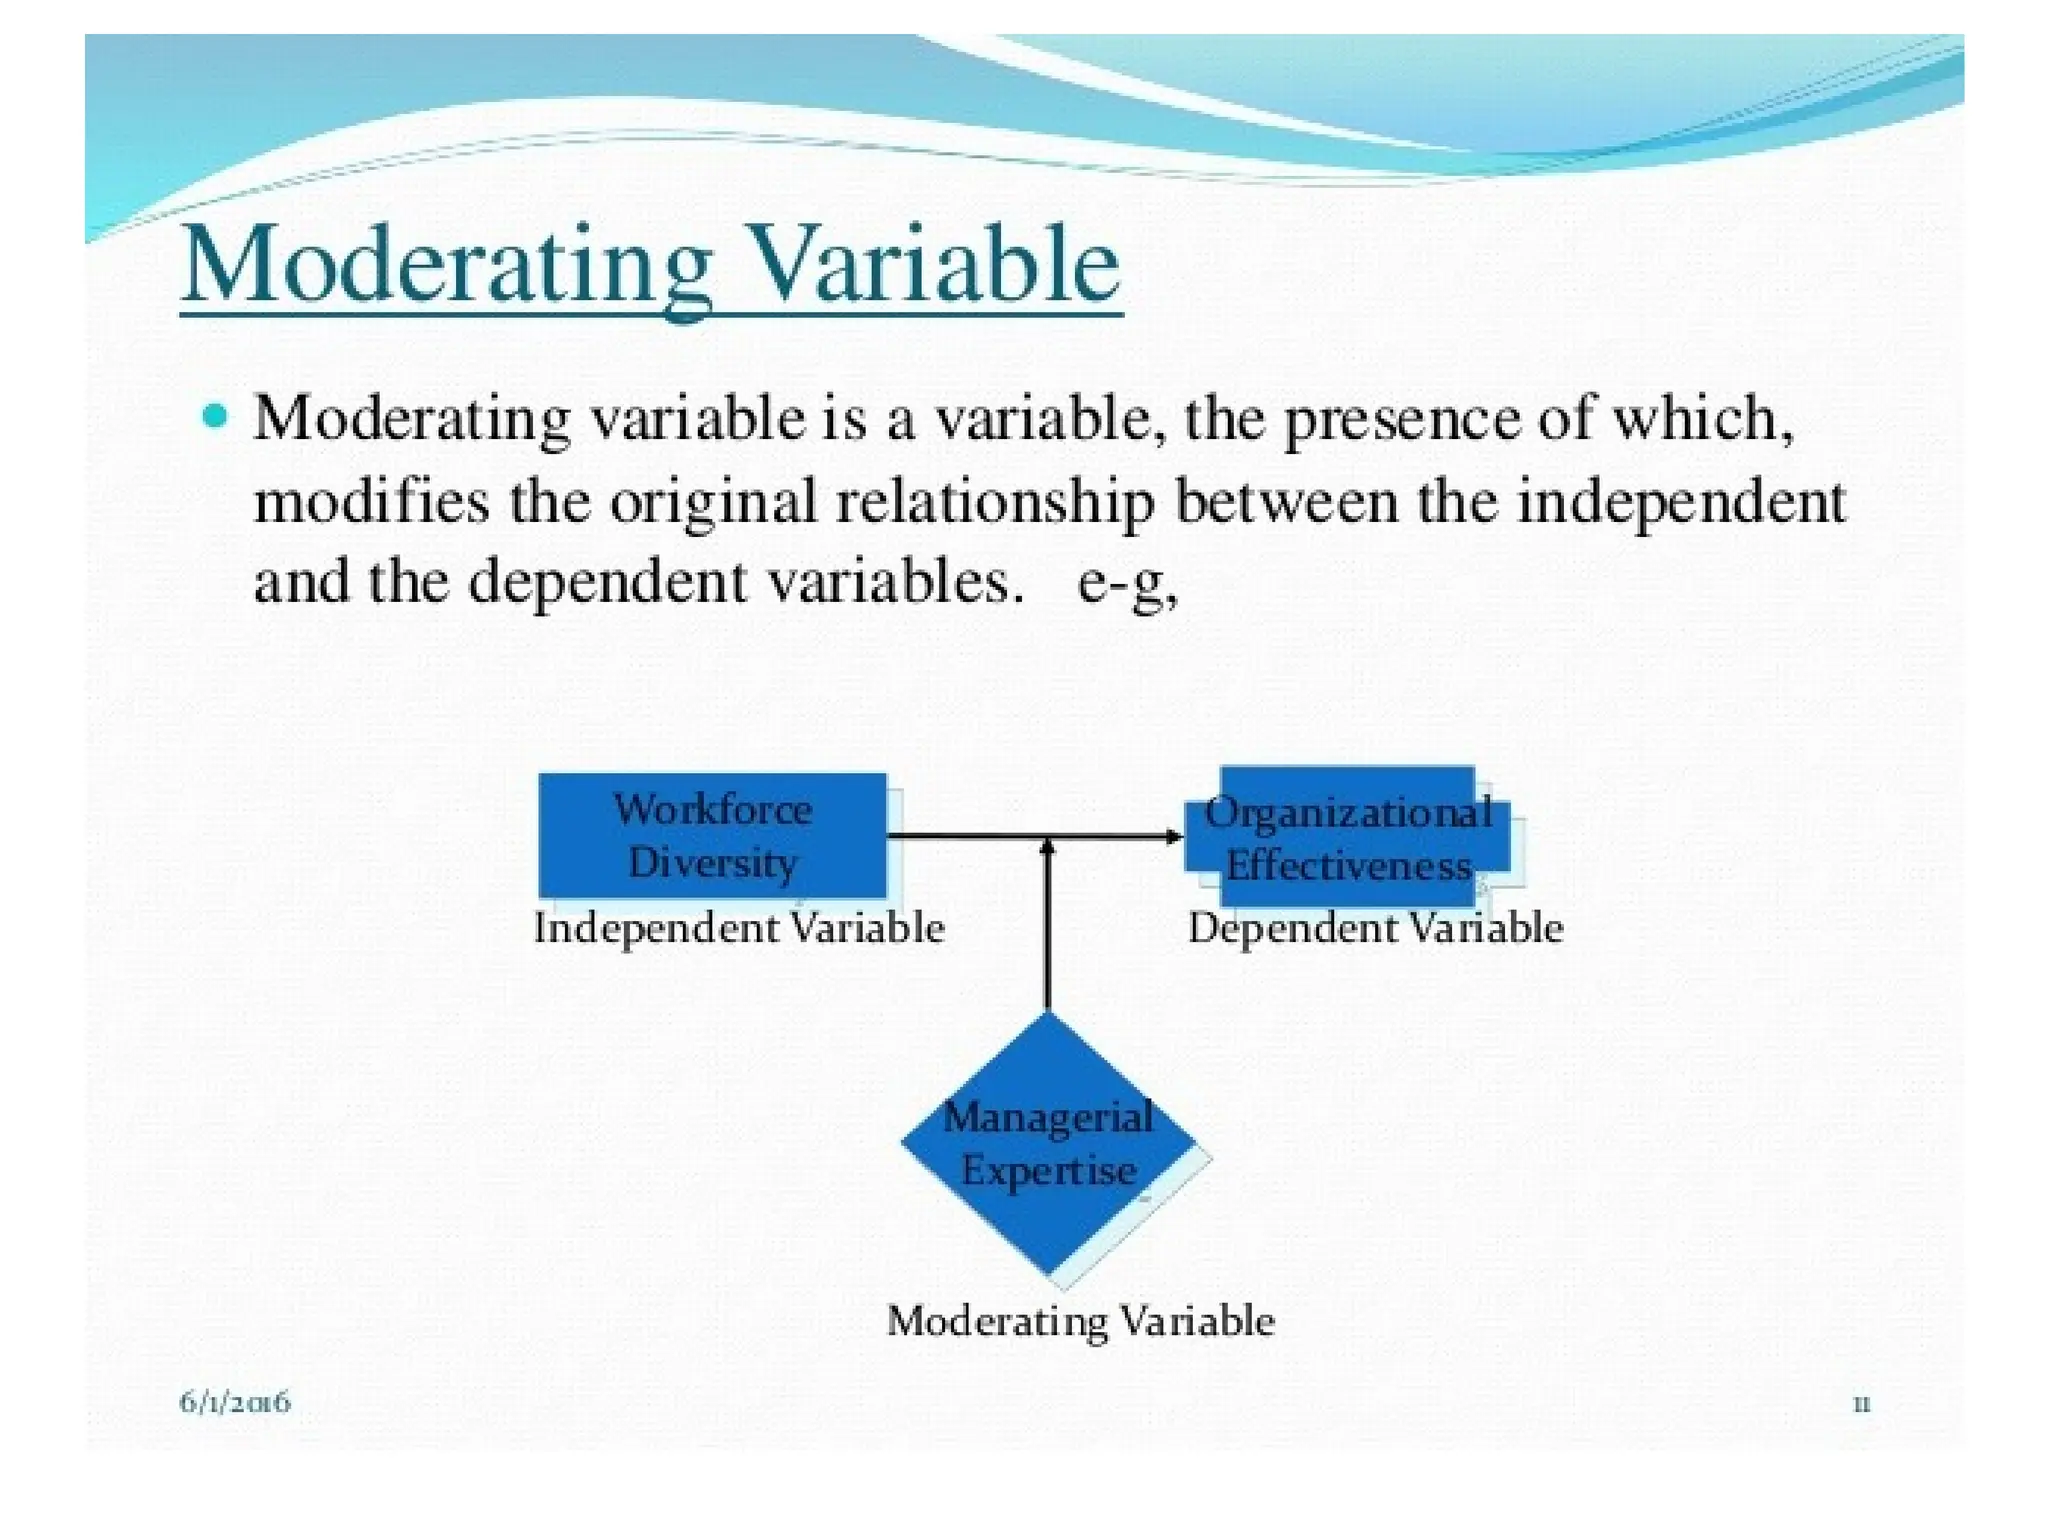
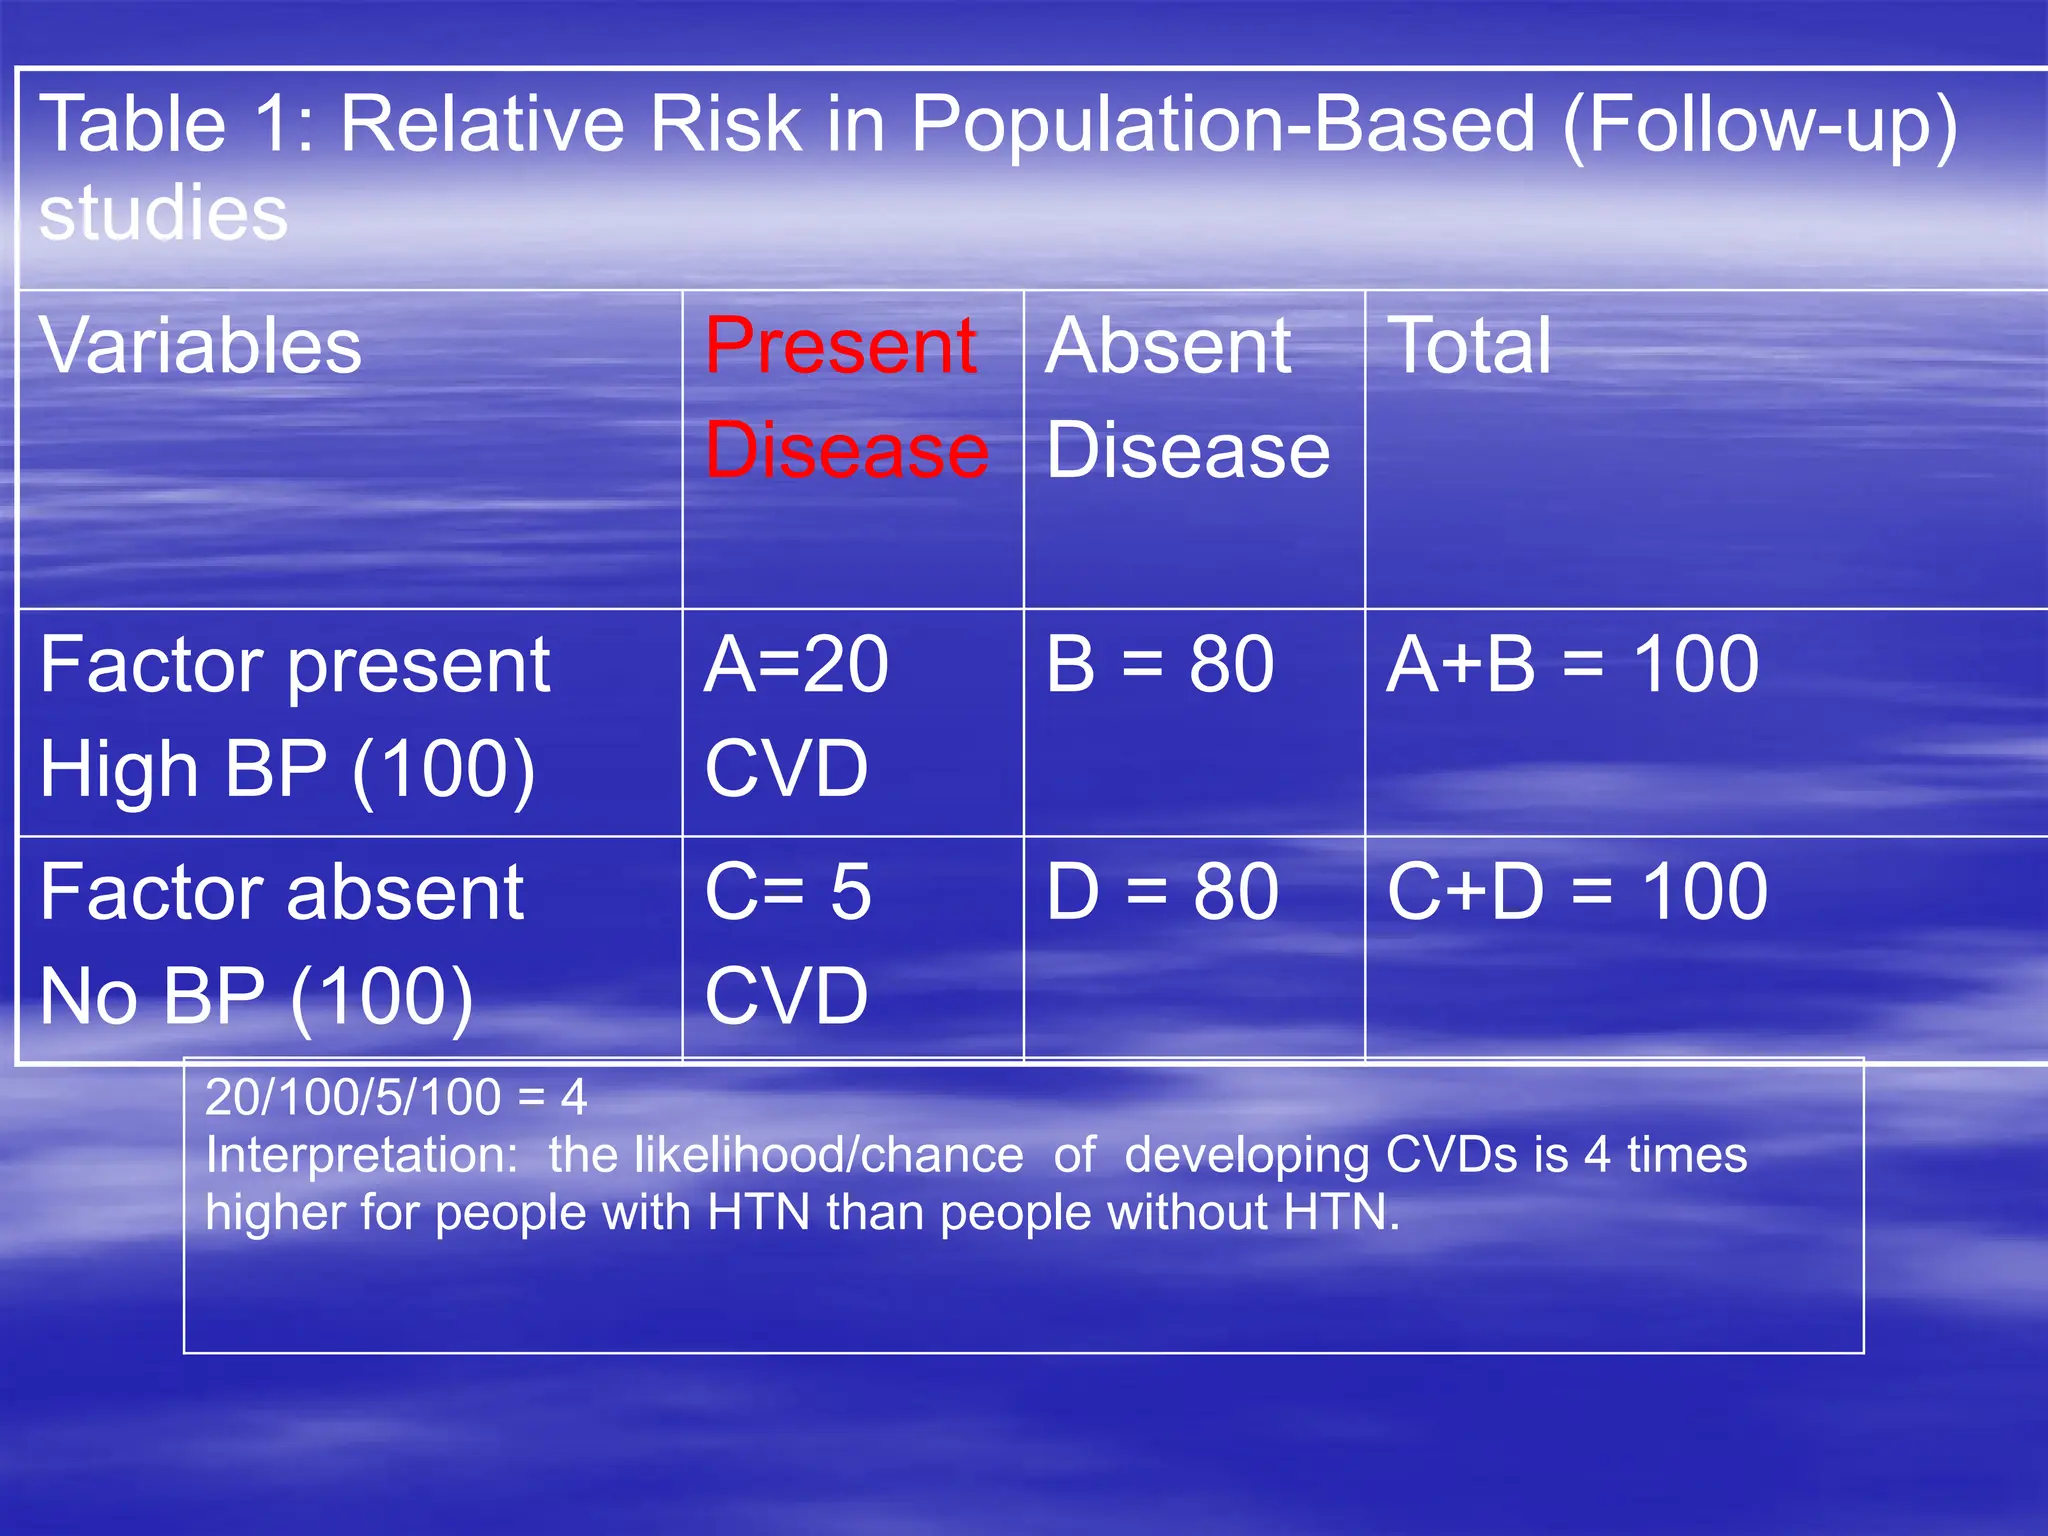
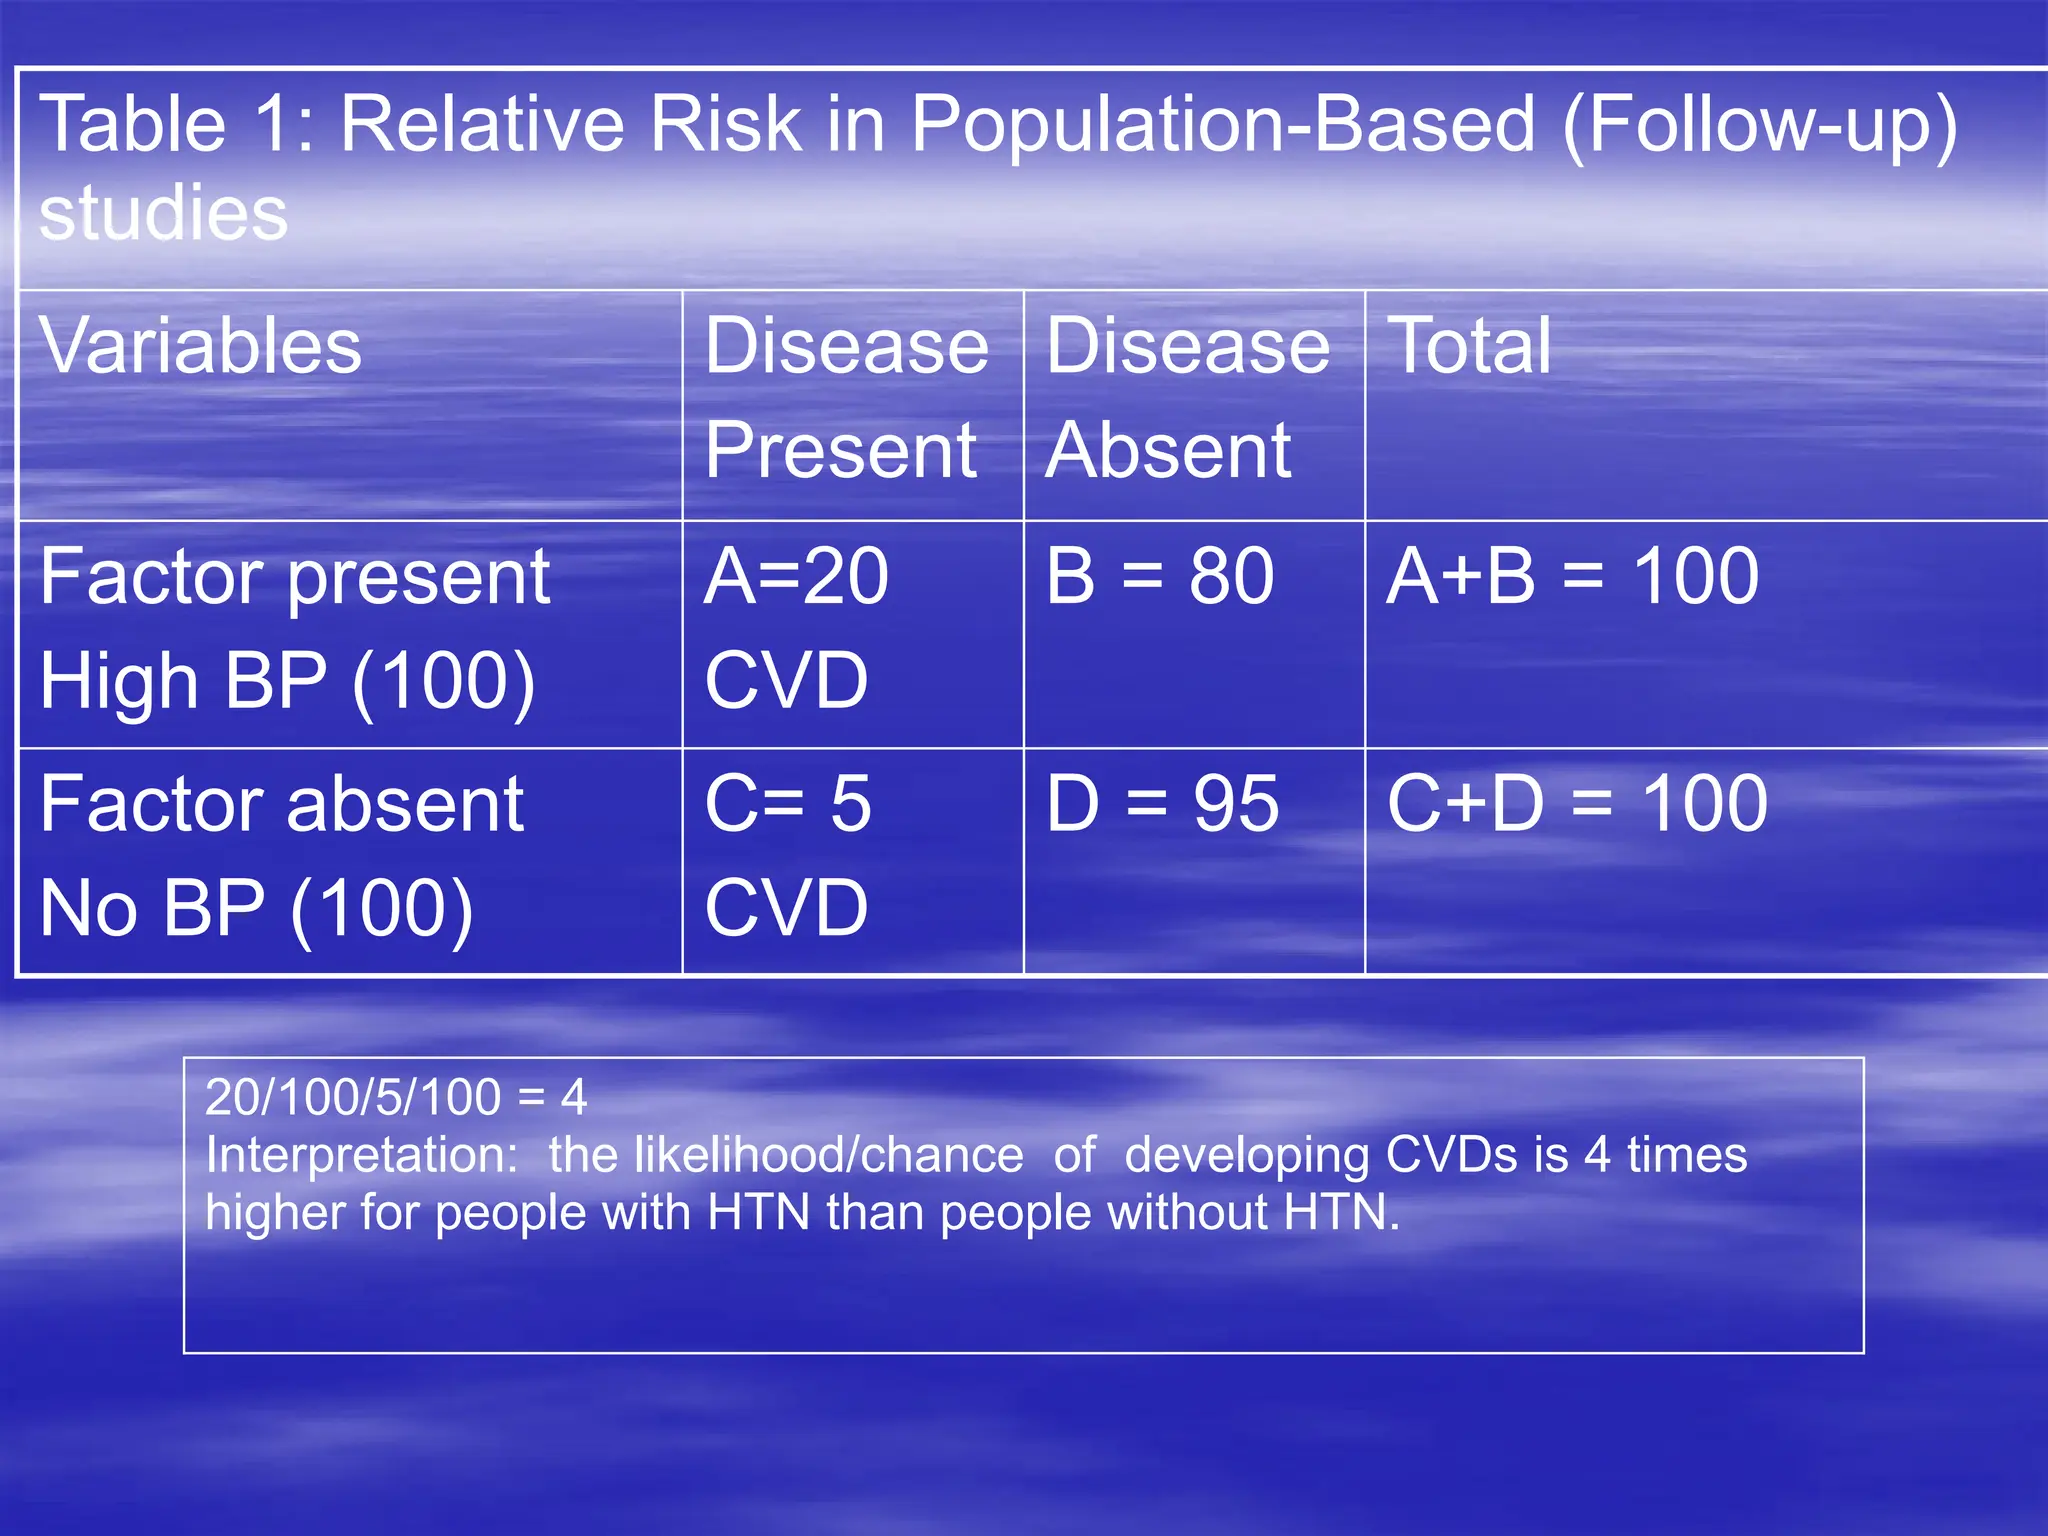
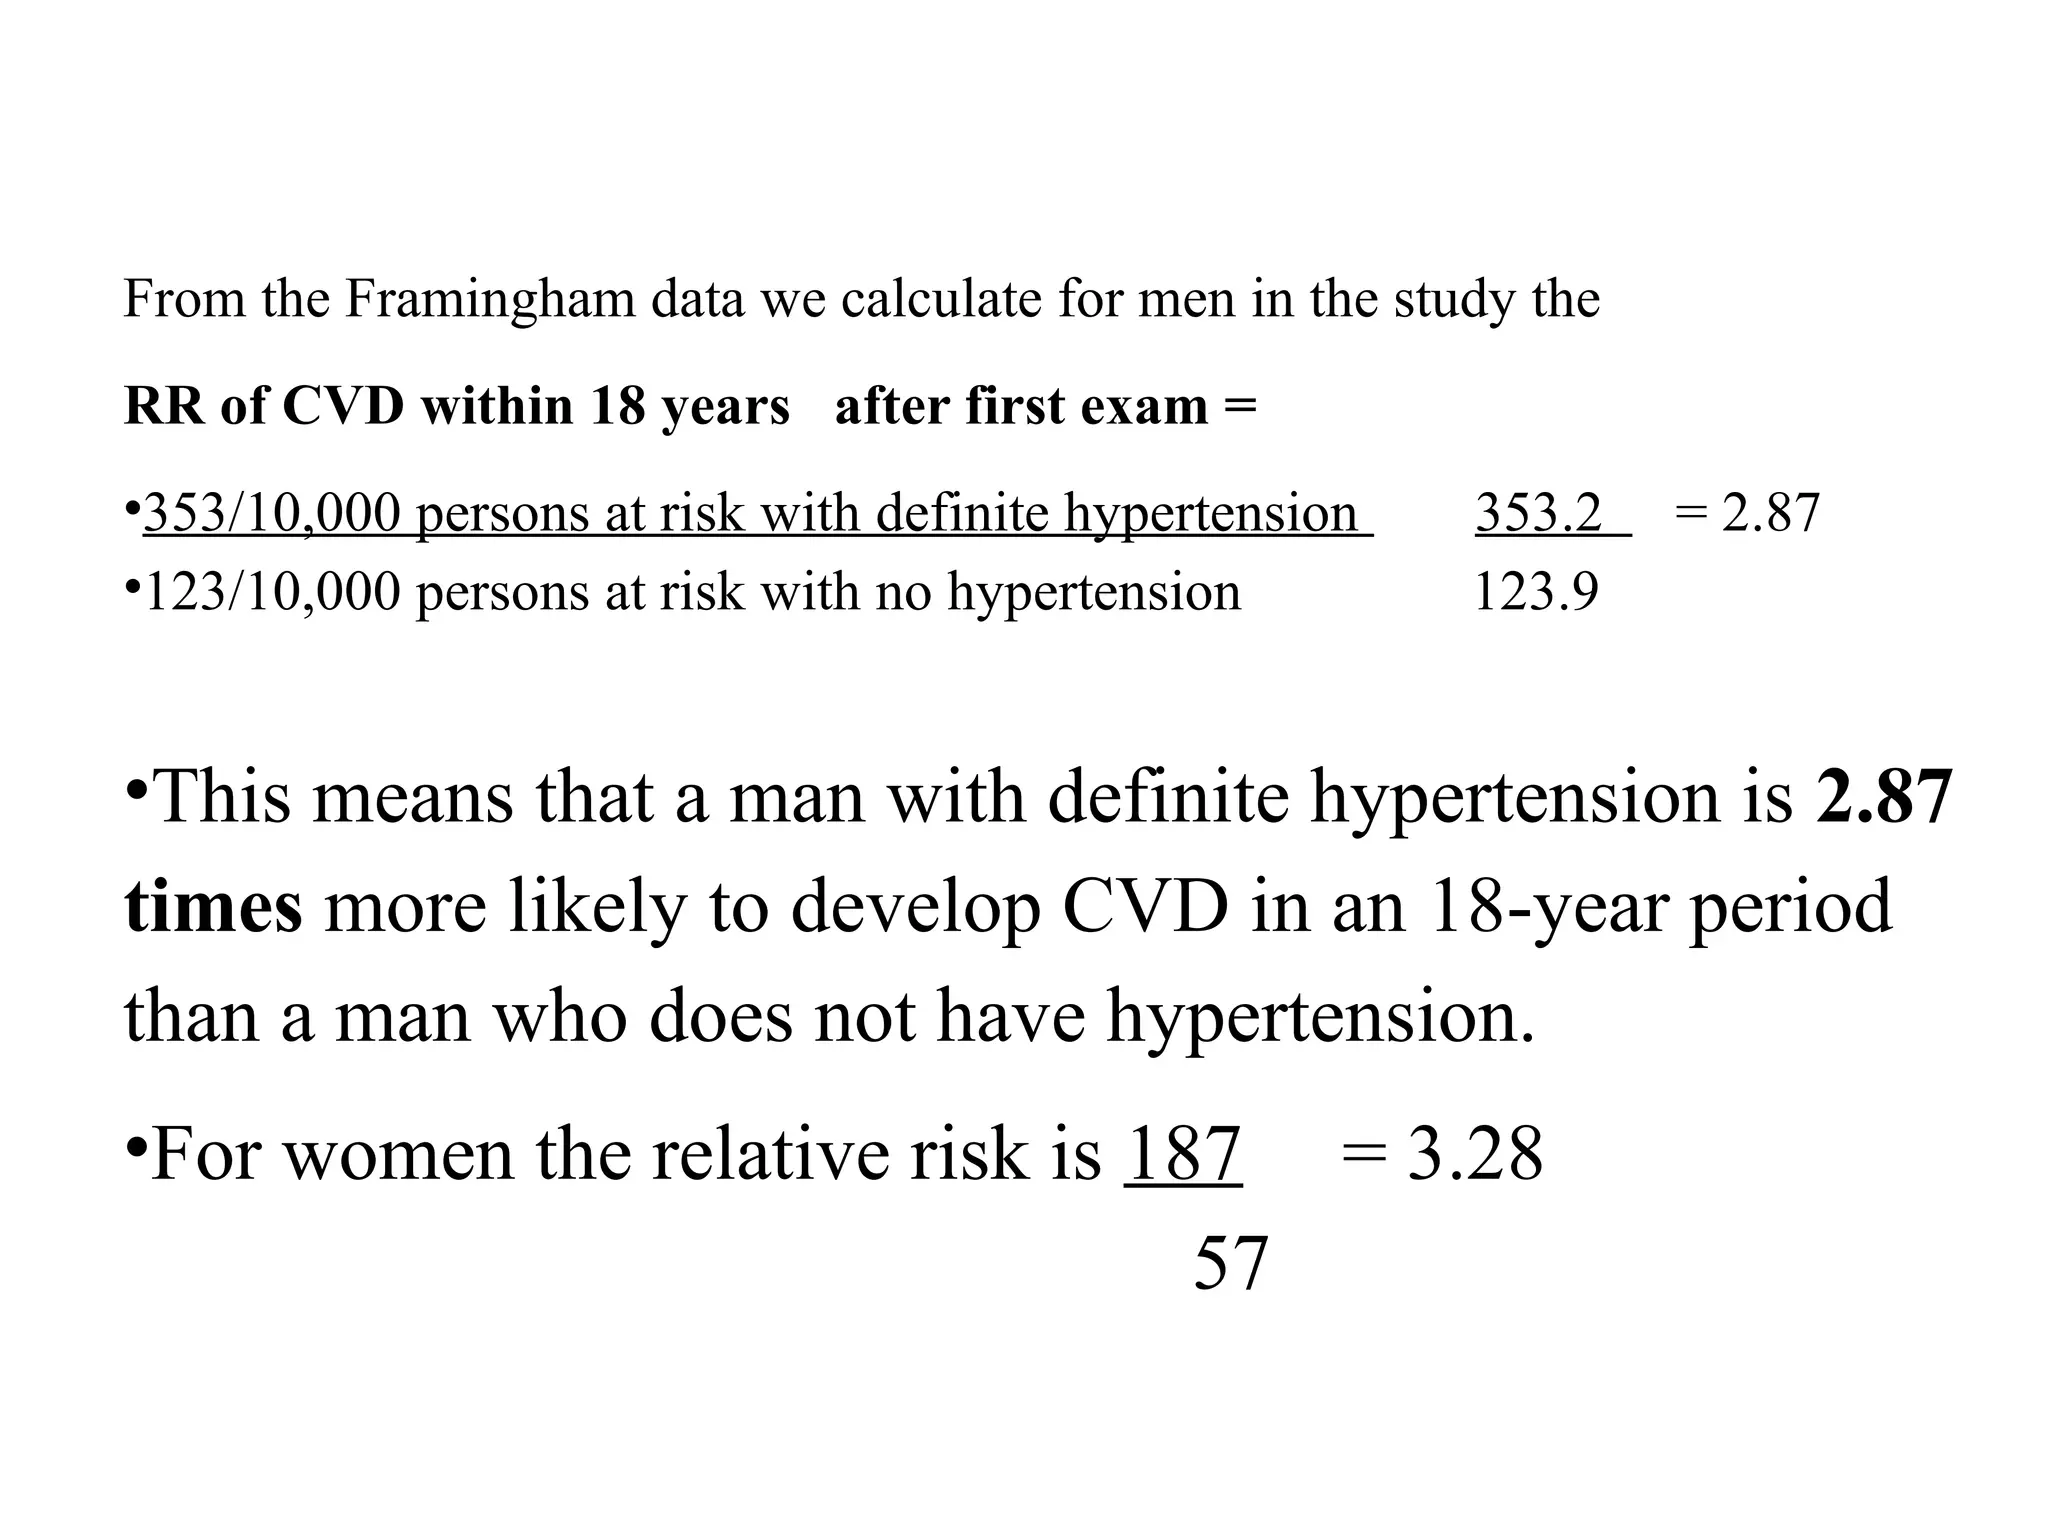
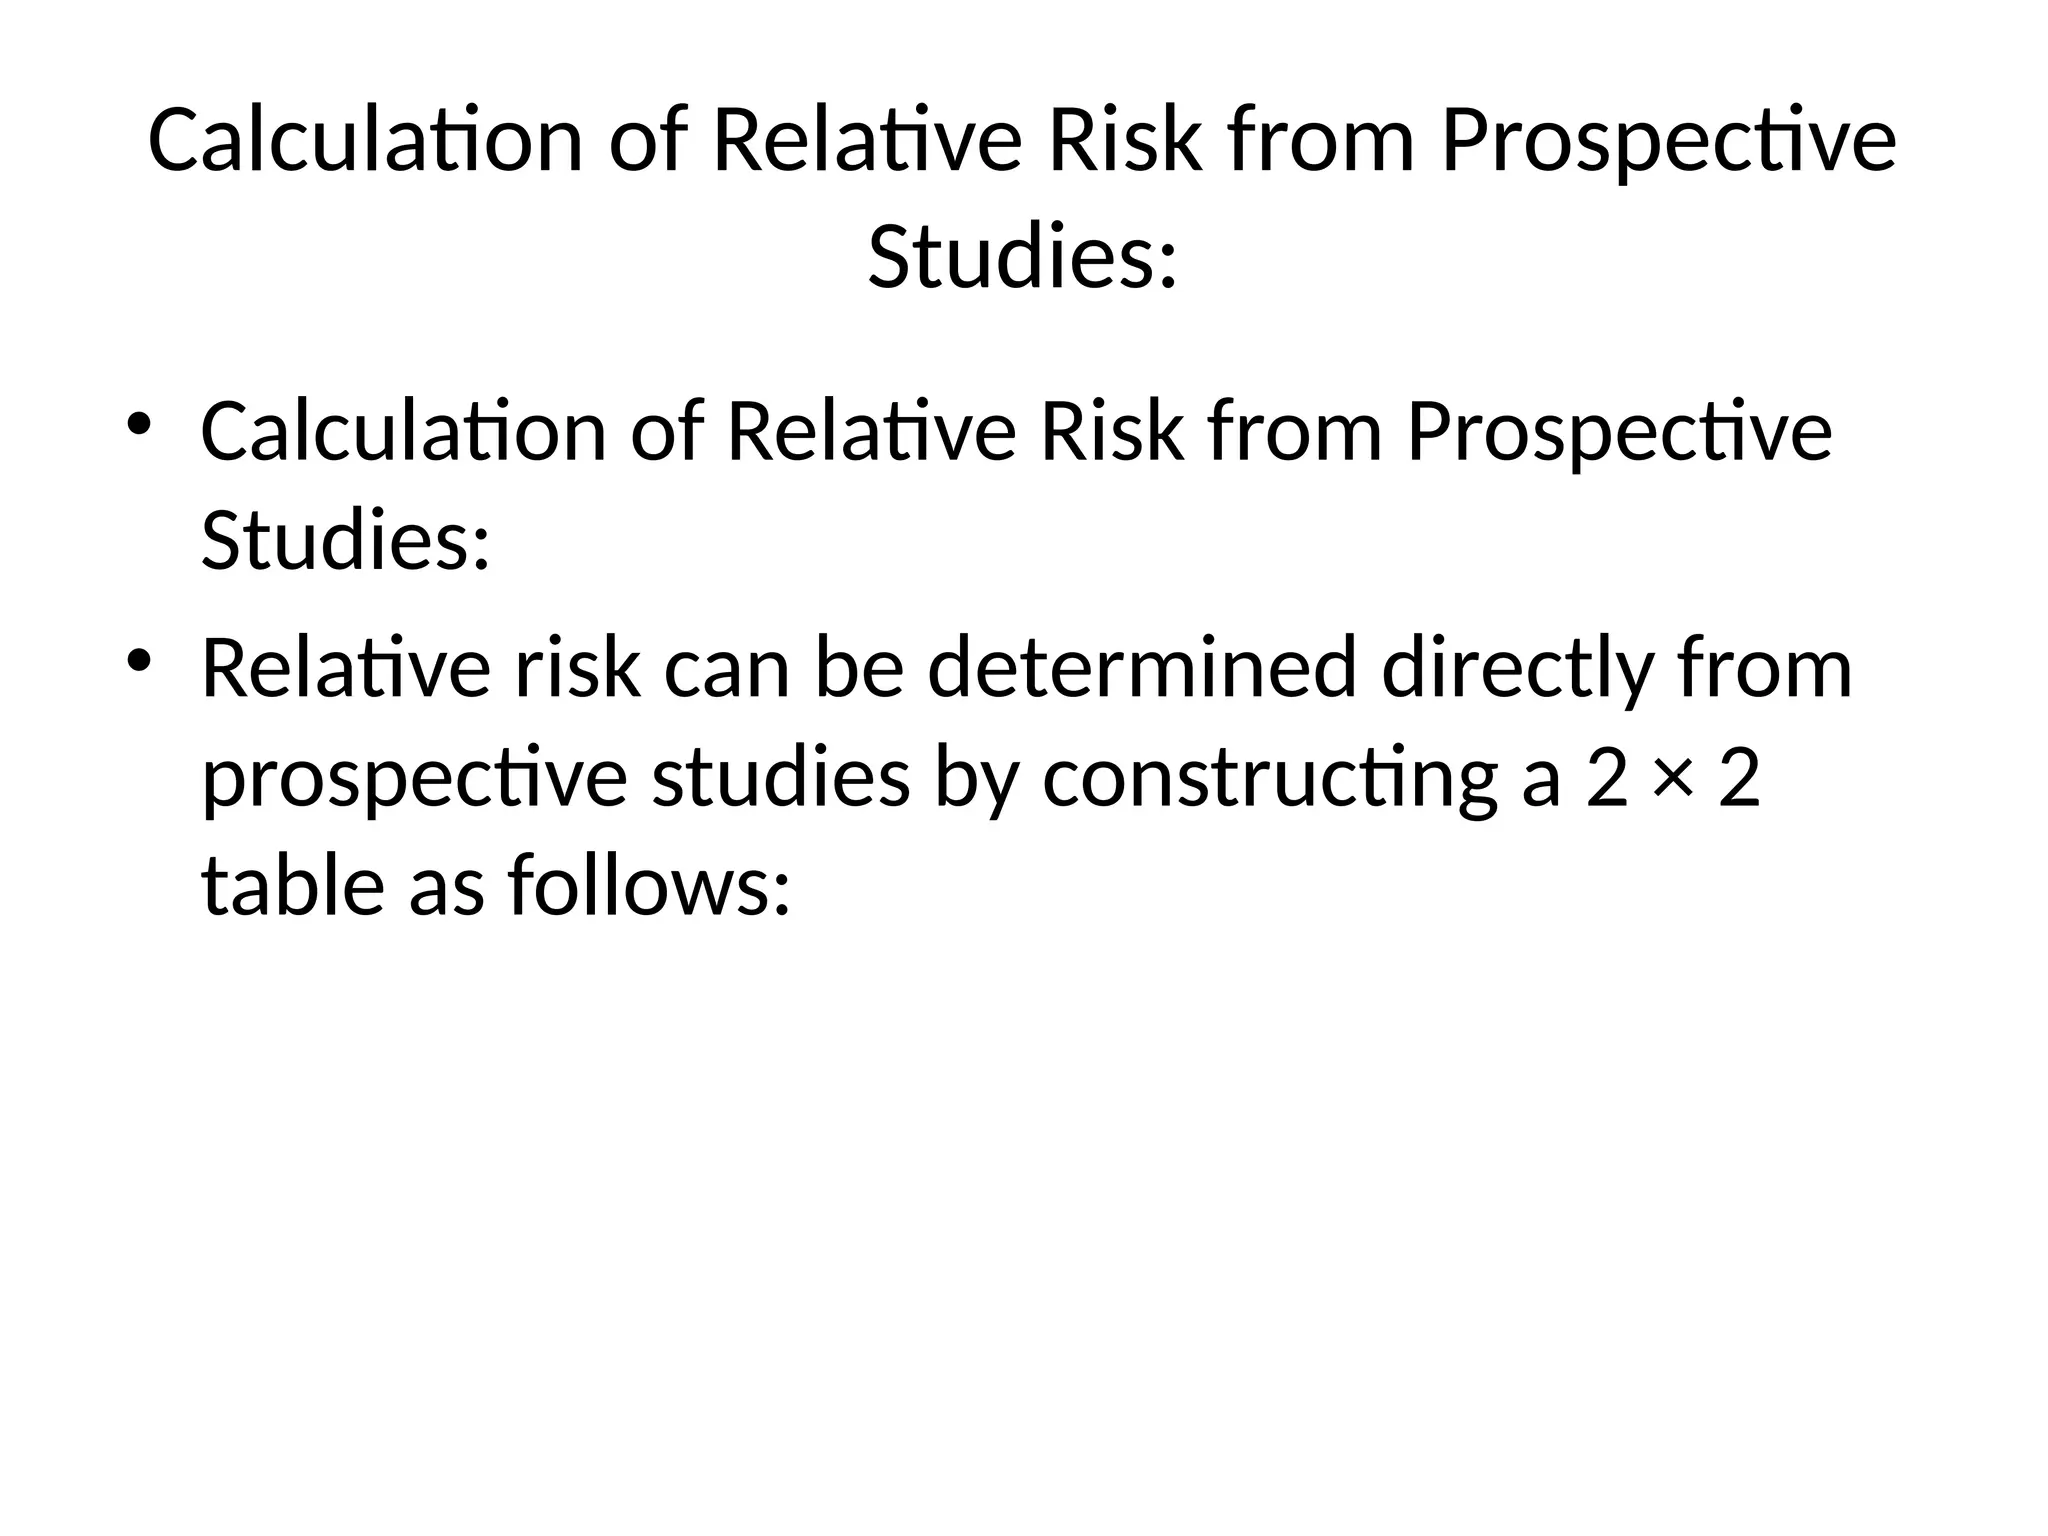
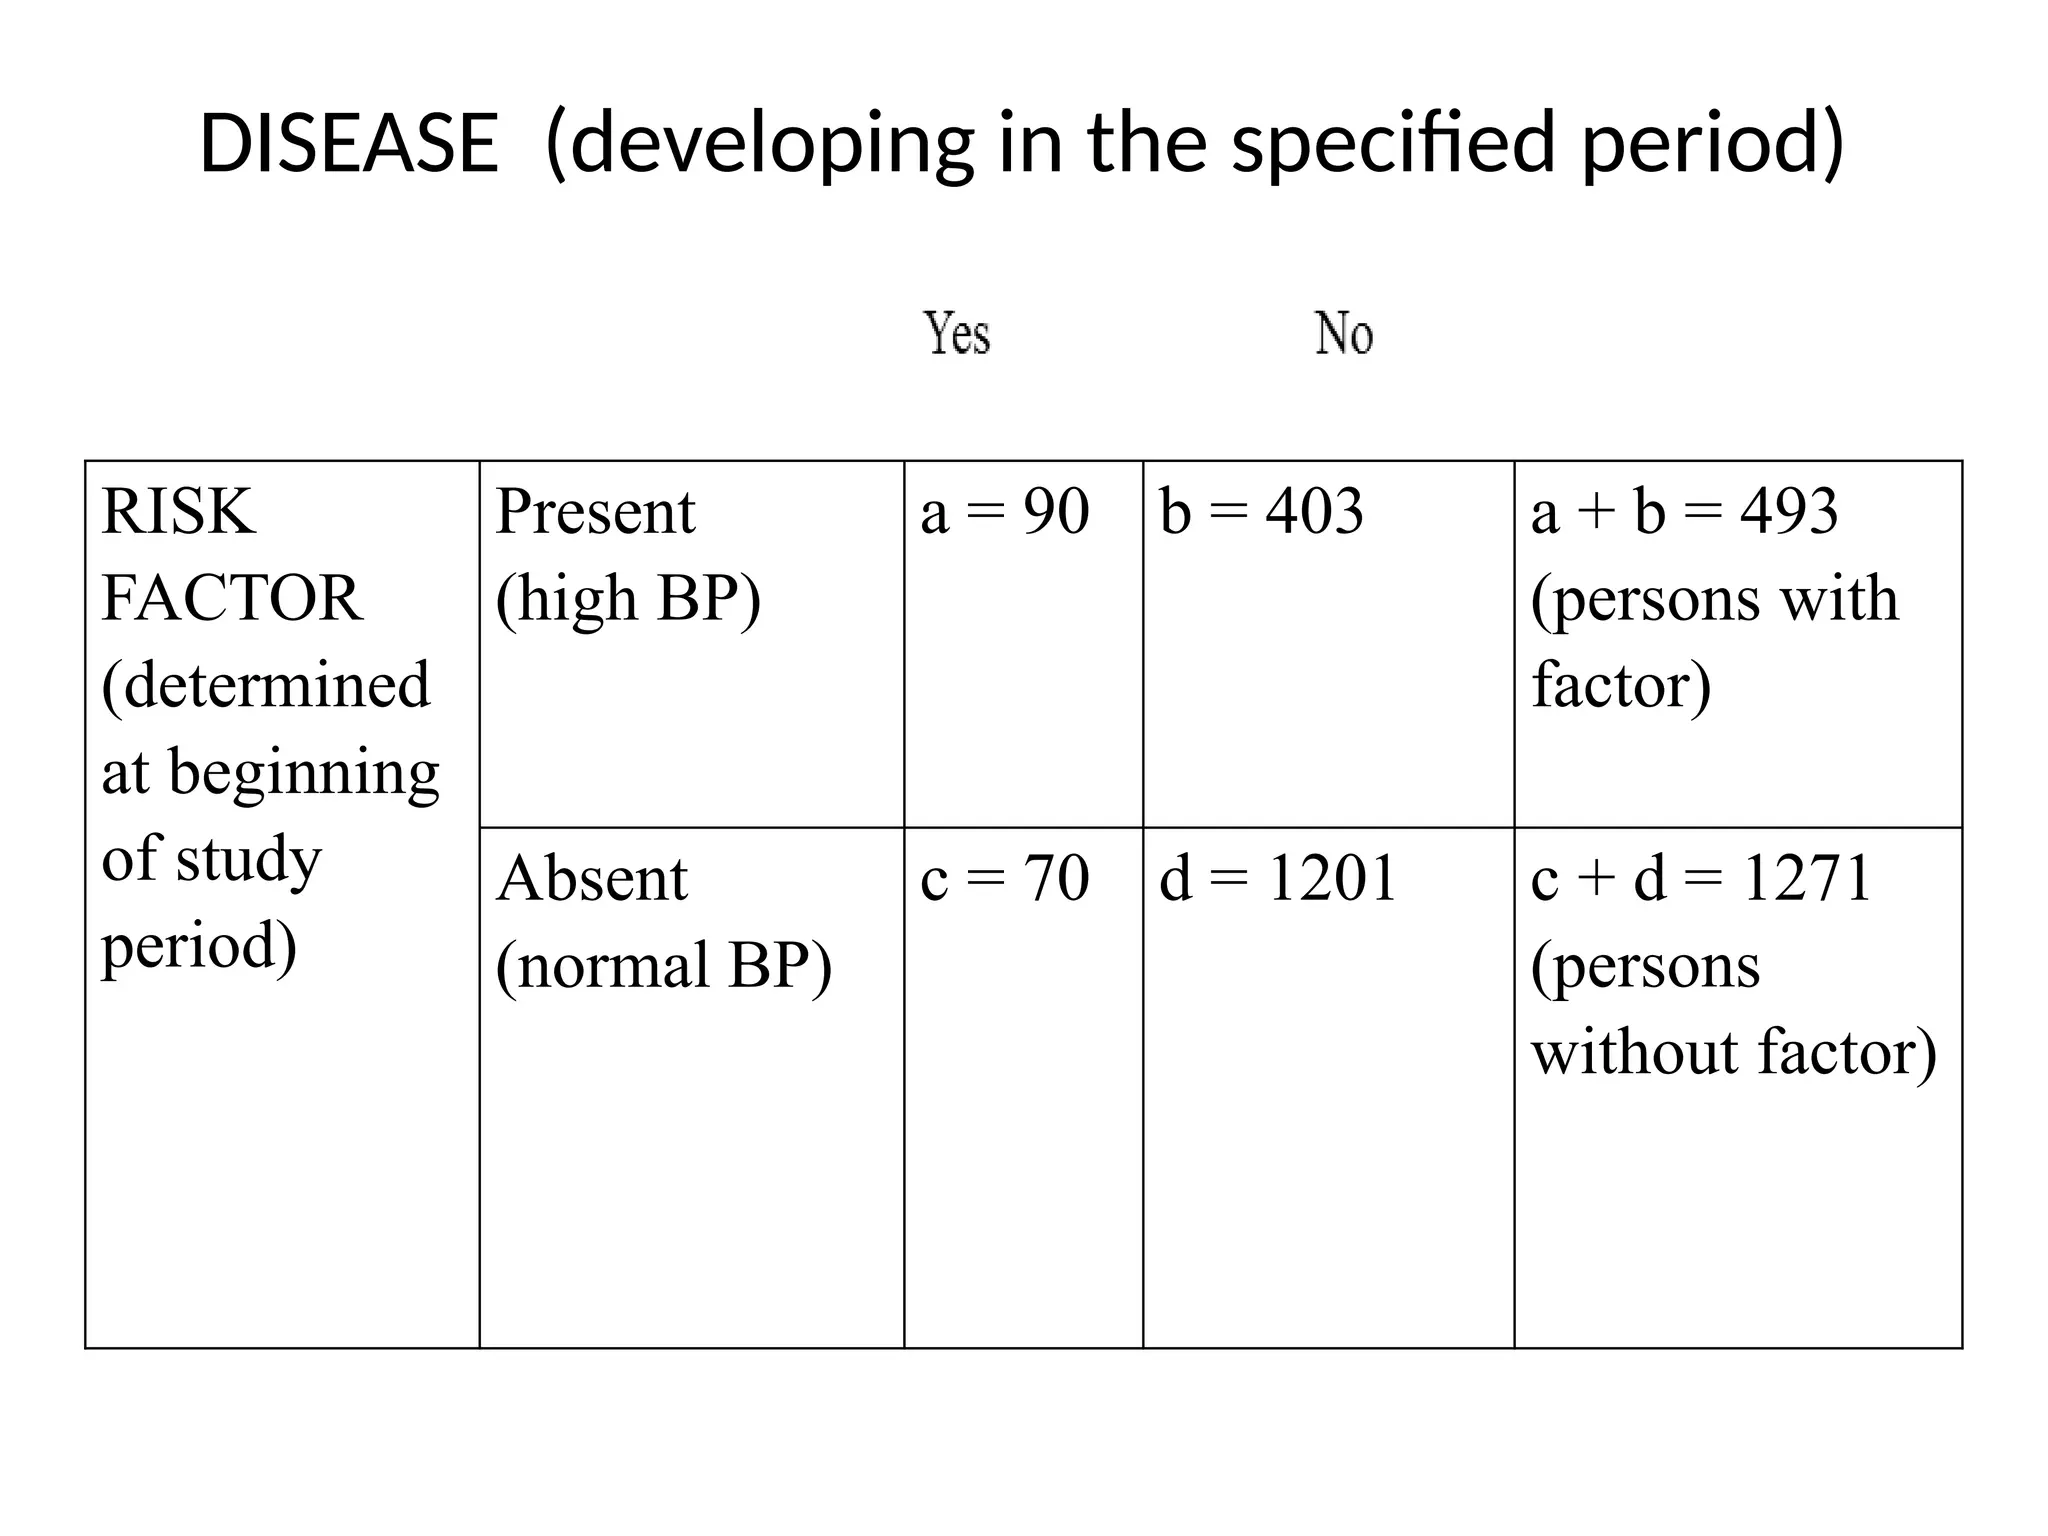
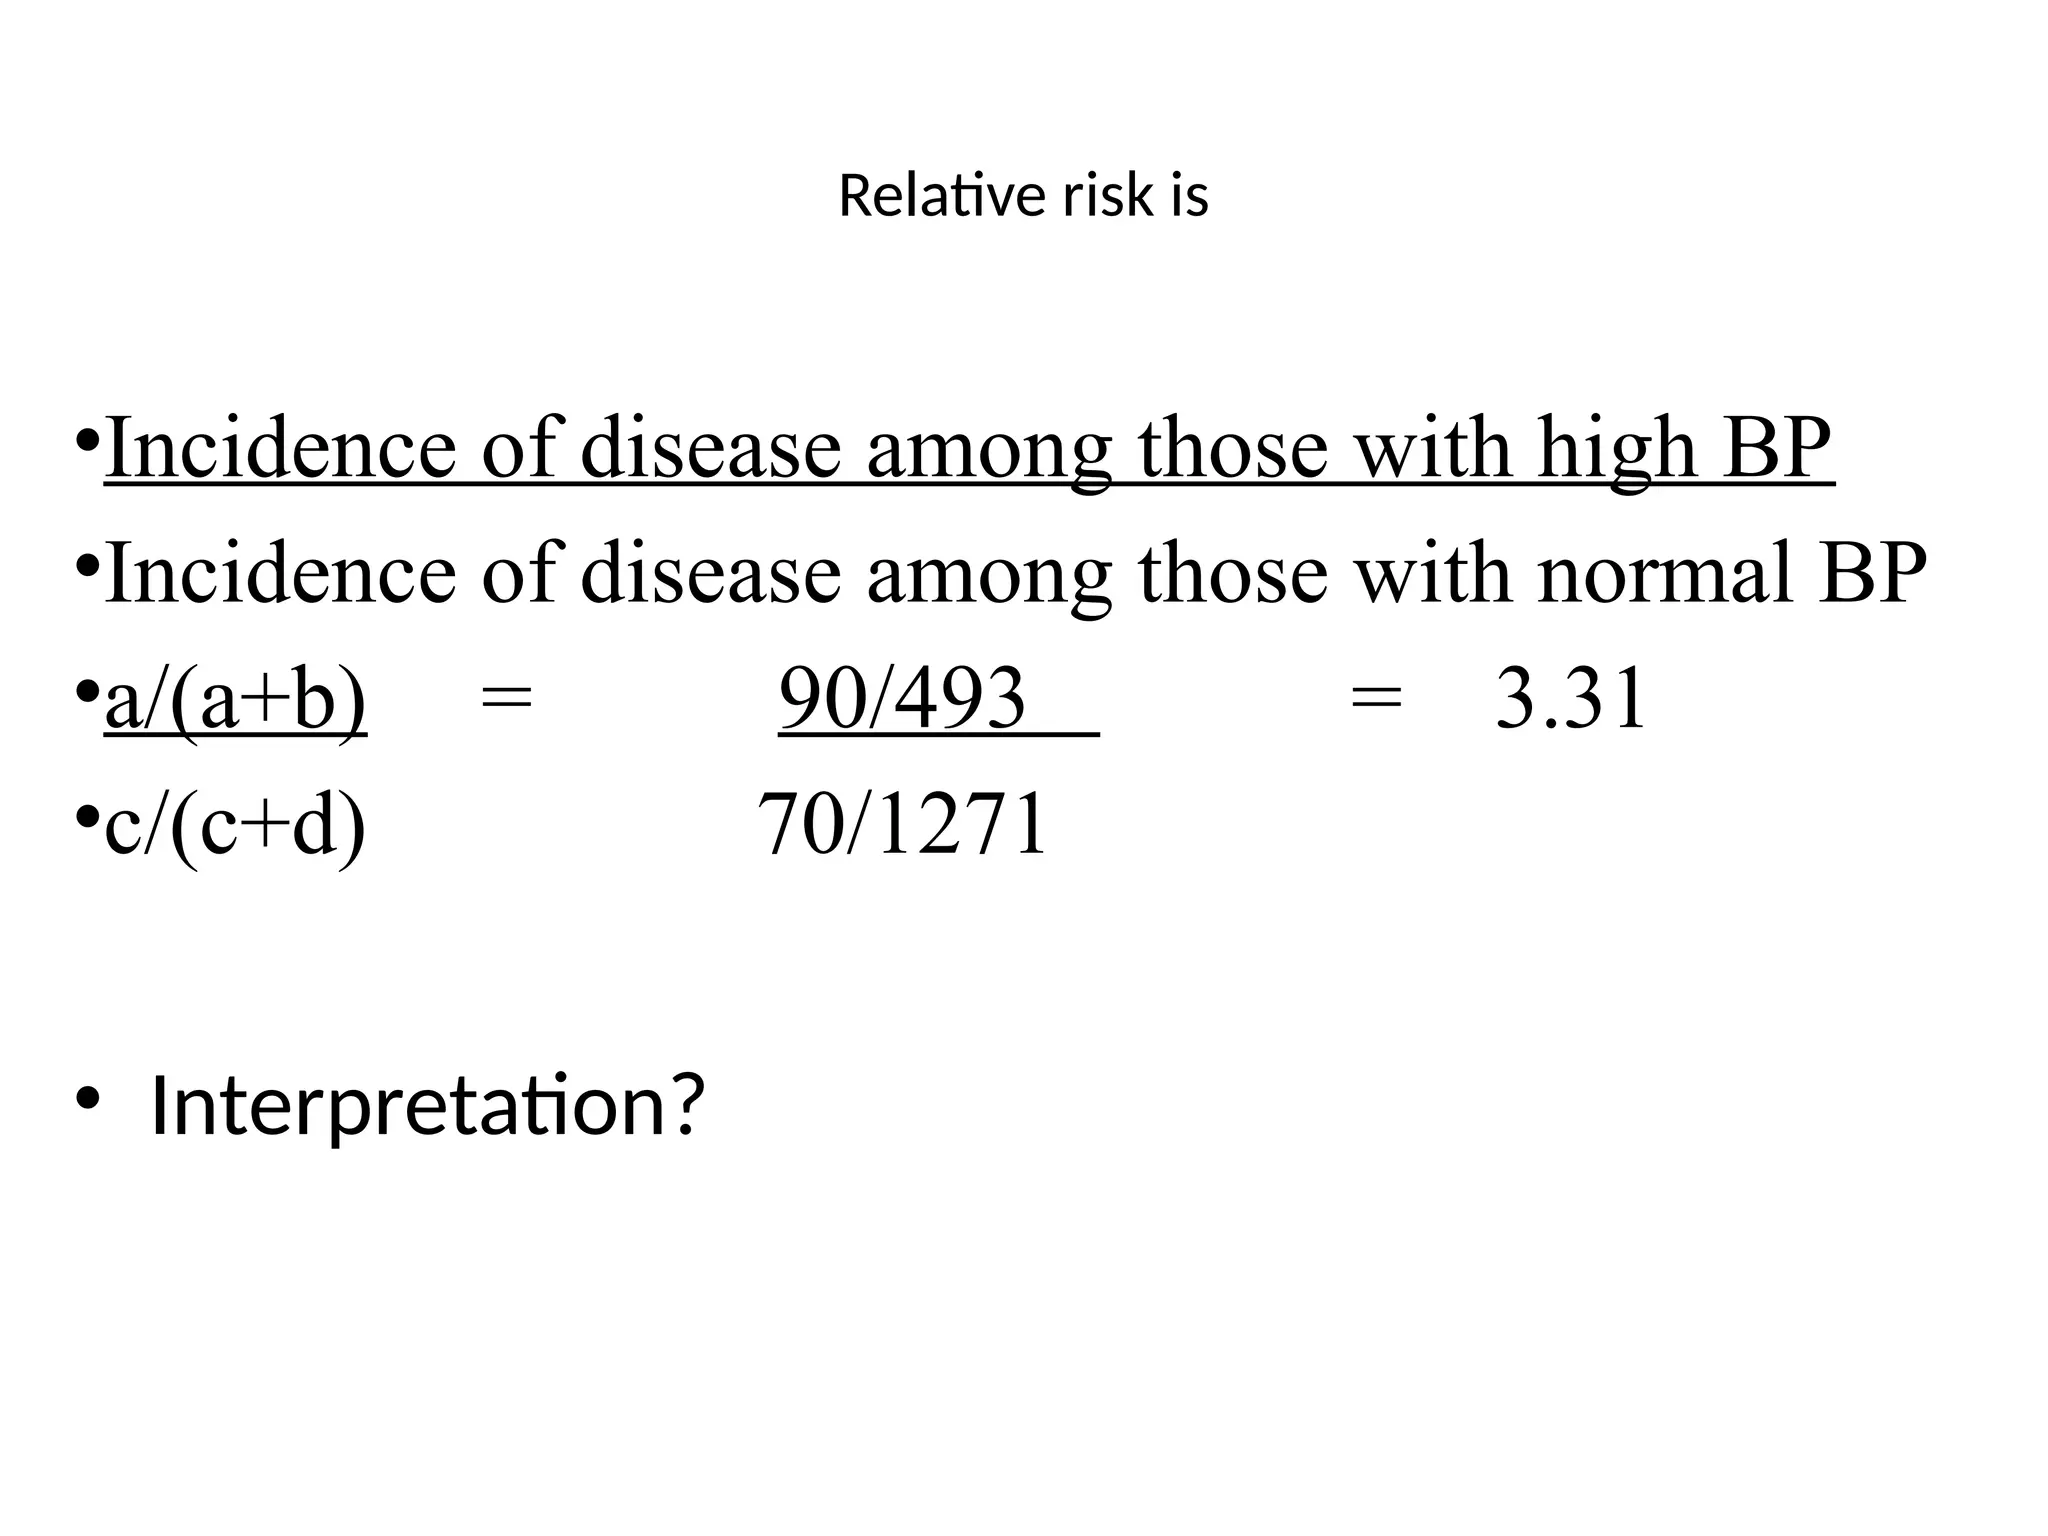
Study Variables
Biostatistics
Sep-Dec, 2020
Tekeste
Variables
• A variable is a measurable characteristic that
varies.
• It may change from group to group, person to
person, or even within one person over time.
• Variables are things that we measure, control, or
manipulate in research.
E.g. time students spent on social media and their
academic performance.
Outcome – dependent – Predictand (Y)
Exposure – independent – Predictors (X)
What are the different types of variables used in
research?
There are six common variable types:
1. DEPENDENT VARIABLES.
2. INDEPENDENT VARIABLES.
3. INTERVENING VARIABLES.
4. MODERATOR VARIABLES.
5. CONTROL VARIABLES.
6. EXTRANEOUS VARIABLES.
IVs and DVs
• Independent variables (IVs) are experimental
variables over which the investigator has control.
• You can be able to manipulate or vary the
variables.
• Dependent variables (DVs) are those that are
associated with or related to the changes
introduced by varying the independent variables.
Variable
 Independent variable – In an
experiment, the treatment or
condition manipulated by the
experimenter.
 Dependent variable – In an
experiment, any aspect of a subject's
behaviour that is measured after the
administration of a treatment; the
expected effect of a treatment.
INDEPENDENT (EXPOSURE) VARIABLES
Are those that the researcher has control over.
This "control" may involve manipulating existing
variables (e.g., modifying existing methods of
instruction) or introducing new variables (e.g.,
adopting a totally new method for some sections
of a class) in the research setting.
Whatever the case may be, the researcher
expects that the independent variable(s) will
have some effect on (or relationship with) the
dependent variables.
DEPENDENT VARIABLES
• Show the effect of manipulating or introducing
the independent variables. For example, if the
independent variable is the use or non-use of a
new language teaching procedure, then the
dependent variable might be students' scores on
a test of the content taught using that procedure.
• In other words, the variation in the dependent
variable depends on the variation in the
independent variable.
Dependent variable
• A dependent variable is a factor whose value
depends on the level of another factor, which is
the independent variable.
• In the example of cigarette smoking and lung
cancer mortality, duration and/or number of
cigarettes smoked are independent variables
upon which the lung cancer mortality depends
(thus, lung cancer mortality is the dependent
variable).
• Example: Assume you are interesting in
answering the question:” Does smoking cause
lung cancer?
• The presumed cause (smoking) is referred to
as independent variable as it can be varied.
• The presumed effects (lung cancer) is referred
to as the dependent variable.
EXTRANEOUS VARIABLES
• Are those factors in the research environment
which may have an effect on the dependent
variable(s) but which are not controlled.
• Extraneous variables are dangerous. They may
damage a study's validity, making it impossible
to know whether the effects were caused by the
independent or some extraneous factor.
• If they cannot be controlled, extraneous
variables must at least be taken into
consideration when interpreting results.
• A confounding variable is an outside influence
that changes the effect of a dependent and
independent variable.
• This extraneous influence is used to influence
the outcome of an experimental design. ...
• Confounding variables can ruin an experiment
and produce useless results
CONTROL VARIABLES
• It is not possible to consider every variable in a
single study. Therefore, the variables that are
not measured in a particular study must be held
constant, neutralized/balanced, or eliminated,
so they will not have a biasing effect on the
other variables.
• Variables that have been controlled in this way
are called control variables
Intervening/mediating variable
• A variable that explains a relation or provides a causal
link between other variables.
• Example: The statistical association between income
and longevity needs to be explained because just
having money does not make one live longer. Other
variables intervene between money and long life.
People with high incomes tend to have better medical
care than those with low incomes. Medical care is an
intervening variable.
• It mediates the relation between income and longevity.
Moderator variable
• A moderator variable is a third variable that affects the
strength of the relationship between a dependent and
independent variable.
• In correlation, a moderator is a third variable that
affects the correlation of two variables.
• In a causal relationship, if x is the predictor variable and
y is an outcome variable, then z is the moderator
variable that affects the casual relationship of x and y.
• Most of the moderator variables measure causal
relationship using regression coefficient. The moderator
variable, if found to be significant, can cause an
amplifying or weakening effect between x and y.
• A mediating variable explains the relation
between the predictor (independent) and the
criterion (dependent). It is often depicted as the
following figure where MV is the mediator.
• A mediator can be a potential mechanism by
which an independent variable can produce
changes on a dependent variable.
• When you remove the effect of the mediator, the
relation between independent and dependent
variables may go away.
A moderator is a variable that affects the
strength of the relation between the predictor
and criterion variable. Moderators specify when
a relation will hold. It can be qualitative (e.g.,
sex, race, class…) or quantitative (e.g., dosage or
level of reward).
A moderator variable alters the effect that an independent variable has on a
dependent variable, on the basis of the moderator’s value. The moderator
thus changes the effect component of the cause-effect relationship between
the two variables. This moderation is also referred to as the interaction effect.
Study designs and Variables
• The observational studies are distinguished by the point
in time when measurements are made on the
dependent and independent variables, as illustrated
below.
In cross-sectional studies, both the dependent and
independent (outcome and exposure) variables are
measured at the same time, in the present.
In case-control studies, the outcome is measured now
and exposure is estimated from the past.
In prospective studies, exposure (the independent
variable) is measured now and the outcome is measured
in the future.
Measures of Relative Risk:
• Risk is the likelihood that a particular event will
occur within a particular population.
• The relative risk compares the likelihood that a
disease or outcome will occur among individuals
who have a particular characteristic, exposure,
or risk factor with the likelihood that the
outcome will occur in individuals who do not
have it.
Relative risk and Study Design
• For prospective studies, the calculation of
relative risk is straight forward e.g. eating carrots
and poor eyesight, smoking and developing lung
cancer
Case-control studies.
• Starts with patients already having poor vision,
sorts them according to who consumes carrots,
and makes the comparison with an
independently selected control group.
Measures of Relative Risk:
• In epidemiologic studies, we are often interested
in knowing how much more likely an individual is
to develop a disease if he/she is exposed a
particular factor than the individual who is not
so exposed.
• A simple measure of such likelihood is called
relative risk (RR).
Relative Risk
• Relative Risk is the ratio of two incidence rates:
the rate of development of the disease for people
with the exposure factor, divided by the rate of
development of the disease for people without
the exposure factor.
• Suppose we wish to determine the effect of high
blood pressure (hypertension) on the
development of cardiovascular disease (CVD). To
obtain the relative risk, we need to calculate the
incidence rates. We can use the data from a classic
prospective study, the Framingham Heart Study.
• Among the most important predictive factors
identified in the Framingham study were
elevated blood pressure, elevated serum
cholesterol and cigarette smoking.
• Elevated blood glucose and abnormal resting
electrocardiogram findings are also predictive
of future cardiovascular disease.
Relative risk can be determined by the following calculation:
• Incidence rate of cardiovascular disease (new cases)
over a specified period of time among people free
of CVD at beginning of the study period who have
the risk factor in question (e.g., high blood
pressure).
OVER
• Incidence rate of CVD in the given time period
among people free of CVD initially, who do not have
the risk factor in question (normal blood pressure).
Table 1: Relative Risk in Population-Based (Follow-up)
studies
Variables Present
Disease
Absent
Disease
Total
Factor present
High BP (100)
A=20
CVD
B = 80 A+B = 100
Factor absent
No BP (100)
C= 5
CVD
D = 80 C+D = 100
20/100/5/100 = 4
Interpretation: the likelihood/chance of developing CVDs is 4 times
higher for people with HTN than people without HTN.
Table 1: Relative Risk in Population-Based (Follow-up)
studies
Variables Disease
Present
Disease
Absent
Total
Factor present
High BP (100)
A=20
CVD
B = 80 A+B = 100
Factor absent
No BP (100)
C= 5
CVD
D = 95 C+D = 100
20/100/5/100 = 4
Interpretation: the likelihood/chance of developing CVDs is 4 times
higher for people with HTN than people without HTN.
From the Framingham data we calculate for men in the study the
RR of CVD within 18 years after first exam =
•353/10,000 persons at risk with definite hypertension 353.2 = 2.87
•123/10,000 persons at risk with no hypertension 123.9
•This means that a man with definite hypertension is 2.87
times more likely to develop CVD in an 18-year period
than a man who does not have hypertension.
•For women the relative risk is 187 = 3.28
57
Calculation of Relative Risk from Prospective
Studies:
• Calculation of Relative Risk from Prospective
Studies:
• Relative risk can be determined directly from
prospective studies by constructing a 2 × 2
table as follows:
DISEASE (developing in the specified period)
RISK
FACTOR
(determined
at beginning
of study
period)
Present
(high BP)
a = 90 b = 403 a + b = 493
(persons with
factor)
Absent
(normal BP)
c = 70 d = 1201 c + d = 1271
(persons
without factor)
Relative risk is
•Incidence of disease among those with high BP
•Incidence of disease among those with normal BP
•a/(a+b) = 90/493 = 3.31
•c/(c+d) 70/1271
• Interpretation?

2. IV-DV-Varibeles.pptx in Research methods

  • 1.
  • 3.
    Variables • A variableis a measurable characteristic that varies. • It may change from group to group, person to person, or even within one person over time. • Variables are things that we measure, control, or manipulate in research. E.g. time students spent on social media and their academic performance. Outcome – dependent – Predictand (Y) Exposure – independent – Predictors (X)
  • 4.
    What are thedifferent types of variables used in research? There are six common variable types: 1. DEPENDENT VARIABLES. 2. INDEPENDENT VARIABLES. 3. INTERVENING VARIABLES. 4. MODERATOR VARIABLES. 5. CONTROL VARIABLES. 6. EXTRANEOUS VARIABLES.
  • 5.
    IVs and DVs •Independent variables (IVs) are experimental variables over which the investigator has control. • You can be able to manipulate or vary the variables. • Dependent variables (DVs) are those that are associated with or related to the changes introduced by varying the independent variables.
  • 6.
    Variable  Independent variable– In an experiment, the treatment or condition manipulated by the experimenter.  Dependent variable – In an experiment, any aspect of a subject's behaviour that is measured after the administration of a treatment; the expected effect of a treatment.
  • 7.
    INDEPENDENT (EXPOSURE) VARIABLES Arethose that the researcher has control over. This "control" may involve manipulating existing variables (e.g., modifying existing methods of instruction) or introducing new variables (e.g., adopting a totally new method for some sections of a class) in the research setting. Whatever the case may be, the researcher expects that the independent variable(s) will have some effect on (or relationship with) the dependent variables.
  • 8.
    DEPENDENT VARIABLES • Showthe effect of manipulating or introducing the independent variables. For example, if the independent variable is the use or non-use of a new language teaching procedure, then the dependent variable might be students' scores on a test of the content taught using that procedure. • In other words, the variation in the dependent variable depends on the variation in the independent variable.
  • 9.
    Dependent variable • Adependent variable is a factor whose value depends on the level of another factor, which is the independent variable. • In the example of cigarette smoking and lung cancer mortality, duration and/or number of cigarettes smoked are independent variables upon which the lung cancer mortality depends (thus, lung cancer mortality is the dependent variable).
  • 10.
    • Example: Assumeyou are interesting in answering the question:” Does smoking cause lung cancer? • The presumed cause (smoking) is referred to as independent variable as it can be varied. • The presumed effects (lung cancer) is referred to as the dependent variable.
  • 11.
    EXTRANEOUS VARIABLES • Arethose factors in the research environment which may have an effect on the dependent variable(s) but which are not controlled. • Extraneous variables are dangerous. They may damage a study's validity, making it impossible to know whether the effects were caused by the independent or some extraneous factor. • If they cannot be controlled, extraneous variables must at least be taken into consideration when interpreting results.
  • 12.
    • A confoundingvariable is an outside influence that changes the effect of a dependent and independent variable. • This extraneous influence is used to influence the outcome of an experimental design. ... • Confounding variables can ruin an experiment and produce useless results
  • 13.
    CONTROL VARIABLES • Itis not possible to consider every variable in a single study. Therefore, the variables that are not measured in a particular study must be held constant, neutralized/balanced, or eliminated, so they will not have a biasing effect on the other variables. • Variables that have been controlled in this way are called control variables
  • 14.
    Intervening/mediating variable • Avariable that explains a relation or provides a causal link between other variables. • Example: The statistical association between income and longevity needs to be explained because just having money does not make one live longer. Other variables intervene between money and long life. People with high incomes tend to have better medical care than those with low incomes. Medical care is an intervening variable. • It mediates the relation between income and longevity.
  • 15.
    Moderator variable • Amoderator variable is a third variable that affects the strength of the relationship between a dependent and independent variable. • In correlation, a moderator is a third variable that affects the correlation of two variables. • In a causal relationship, if x is the predictor variable and y is an outcome variable, then z is the moderator variable that affects the casual relationship of x and y. • Most of the moderator variables measure causal relationship using regression coefficient. The moderator variable, if found to be significant, can cause an amplifying or weakening effect between x and y.
  • 16.
    • A mediatingvariable explains the relation between the predictor (independent) and the criterion (dependent). It is often depicted as the following figure where MV is the mediator. • A mediator can be a potential mechanism by which an independent variable can produce changes on a dependent variable. • When you remove the effect of the mediator, the relation between independent and dependent variables may go away.
  • 17.
    A moderator isa variable that affects the strength of the relation between the predictor and criterion variable. Moderators specify when a relation will hold. It can be qualitative (e.g., sex, race, class…) or quantitative (e.g., dosage or level of reward).
  • 18.
    A moderator variablealters the effect that an independent variable has on a dependent variable, on the basis of the moderator’s value. The moderator thus changes the effect component of the cause-effect relationship between the two variables. This moderation is also referred to as the interaction effect.
  • 20.
    Study designs andVariables • The observational studies are distinguished by the point in time when measurements are made on the dependent and independent variables, as illustrated below. In cross-sectional studies, both the dependent and independent (outcome and exposure) variables are measured at the same time, in the present. In case-control studies, the outcome is measured now and exposure is estimated from the past. In prospective studies, exposure (the independent variable) is measured now and the outcome is measured in the future.
  • 21.
    Measures of RelativeRisk: • Risk is the likelihood that a particular event will occur within a particular population. • The relative risk compares the likelihood that a disease or outcome will occur among individuals who have a particular characteristic, exposure, or risk factor with the likelihood that the outcome will occur in individuals who do not have it.
  • 22.
    Relative risk andStudy Design • For prospective studies, the calculation of relative risk is straight forward e.g. eating carrots and poor eyesight, smoking and developing lung cancer Case-control studies. • Starts with patients already having poor vision, sorts them according to who consumes carrots, and makes the comparison with an independently selected control group.
  • 23.
    Measures of RelativeRisk: • In epidemiologic studies, we are often interested in knowing how much more likely an individual is to develop a disease if he/she is exposed a particular factor than the individual who is not so exposed. • A simple measure of such likelihood is called relative risk (RR).
  • 24.
    Relative Risk • RelativeRisk is the ratio of two incidence rates: the rate of development of the disease for people with the exposure factor, divided by the rate of development of the disease for people without the exposure factor. • Suppose we wish to determine the effect of high blood pressure (hypertension) on the development of cardiovascular disease (CVD). To obtain the relative risk, we need to calculate the incidence rates. We can use the data from a classic prospective study, the Framingham Heart Study.
  • 25.
    • Among themost important predictive factors identified in the Framingham study were elevated blood pressure, elevated serum cholesterol and cigarette smoking. • Elevated blood glucose and abnormal resting electrocardiogram findings are also predictive of future cardiovascular disease.
  • 26.
    Relative risk canbe determined by the following calculation: • Incidence rate of cardiovascular disease (new cases) over a specified period of time among people free of CVD at beginning of the study period who have the risk factor in question (e.g., high blood pressure). OVER • Incidence rate of CVD in the given time period among people free of CVD initially, who do not have the risk factor in question (normal blood pressure).
  • 27.
    Table 1: RelativeRisk in Population-Based (Follow-up) studies Variables Present Disease Absent Disease Total Factor present High BP (100) A=20 CVD B = 80 A+B = 100 Factor absent No BP (100) C= 5 CVD D = 80 C+D = 100 20/100/5/100 = 4 Interpretation: the likelihood/chance of developing CVDs is 4 times higher for people with HTN than people without HTN.
  • 28.
    Table 1: RelativeRisk in Population-Based (Follow-up) studies Variables Disease Present Disease Absent Total Factor present High BP (100) A=20 CVD B = 80 A+B = 100 Factor absent No BP (100) C= 5 CVD D = 95 C+D = 100 20/100/5/100 = 4 Interpretation: the likelihood/chance of developing CVDs is 4 times higher for people with HTN than people without HTN.
  • 29.
    From the Framinghamdata we calculate for men in the study the RR of CVD within 18 years after first exam = •353/10,000 persons at risk with definite hypertension 353.2 = 2.87 •123/10,000 persons at risk with no hypertension 123.9 •This means that a man with definite hypertension is 2.87 times more likely to develop CVD in an 18-year period than a man who does not have hypertension. •For women the relative risk is 187 = 3.28 57
  • 30.
    Calculation of RelativeRisk from Prospective Studies: • Calculation of Relative Risk from Prospective Studies: • Relative risk can be determined directly from prospective studies by constructing a 2 × 2 table as follows:
  • 31.
    DISEASE (developing inthe specified period) RISK FACTOR (determined at beginning of study period) Present (high BP) a = 90 b = 403 a + b = 493 (persons with factor) Absent (normal BP) c = 70 d = 1201 c + d = 1271 (persons without factor)
  • 32.
    Relative risk is •Incidenceof disease among those with high BP •Incidence of disease among those with normal BP •a/(a+b) = 90/493 = 3.31 •c/(c+d) 70/1271 • Interpretation?