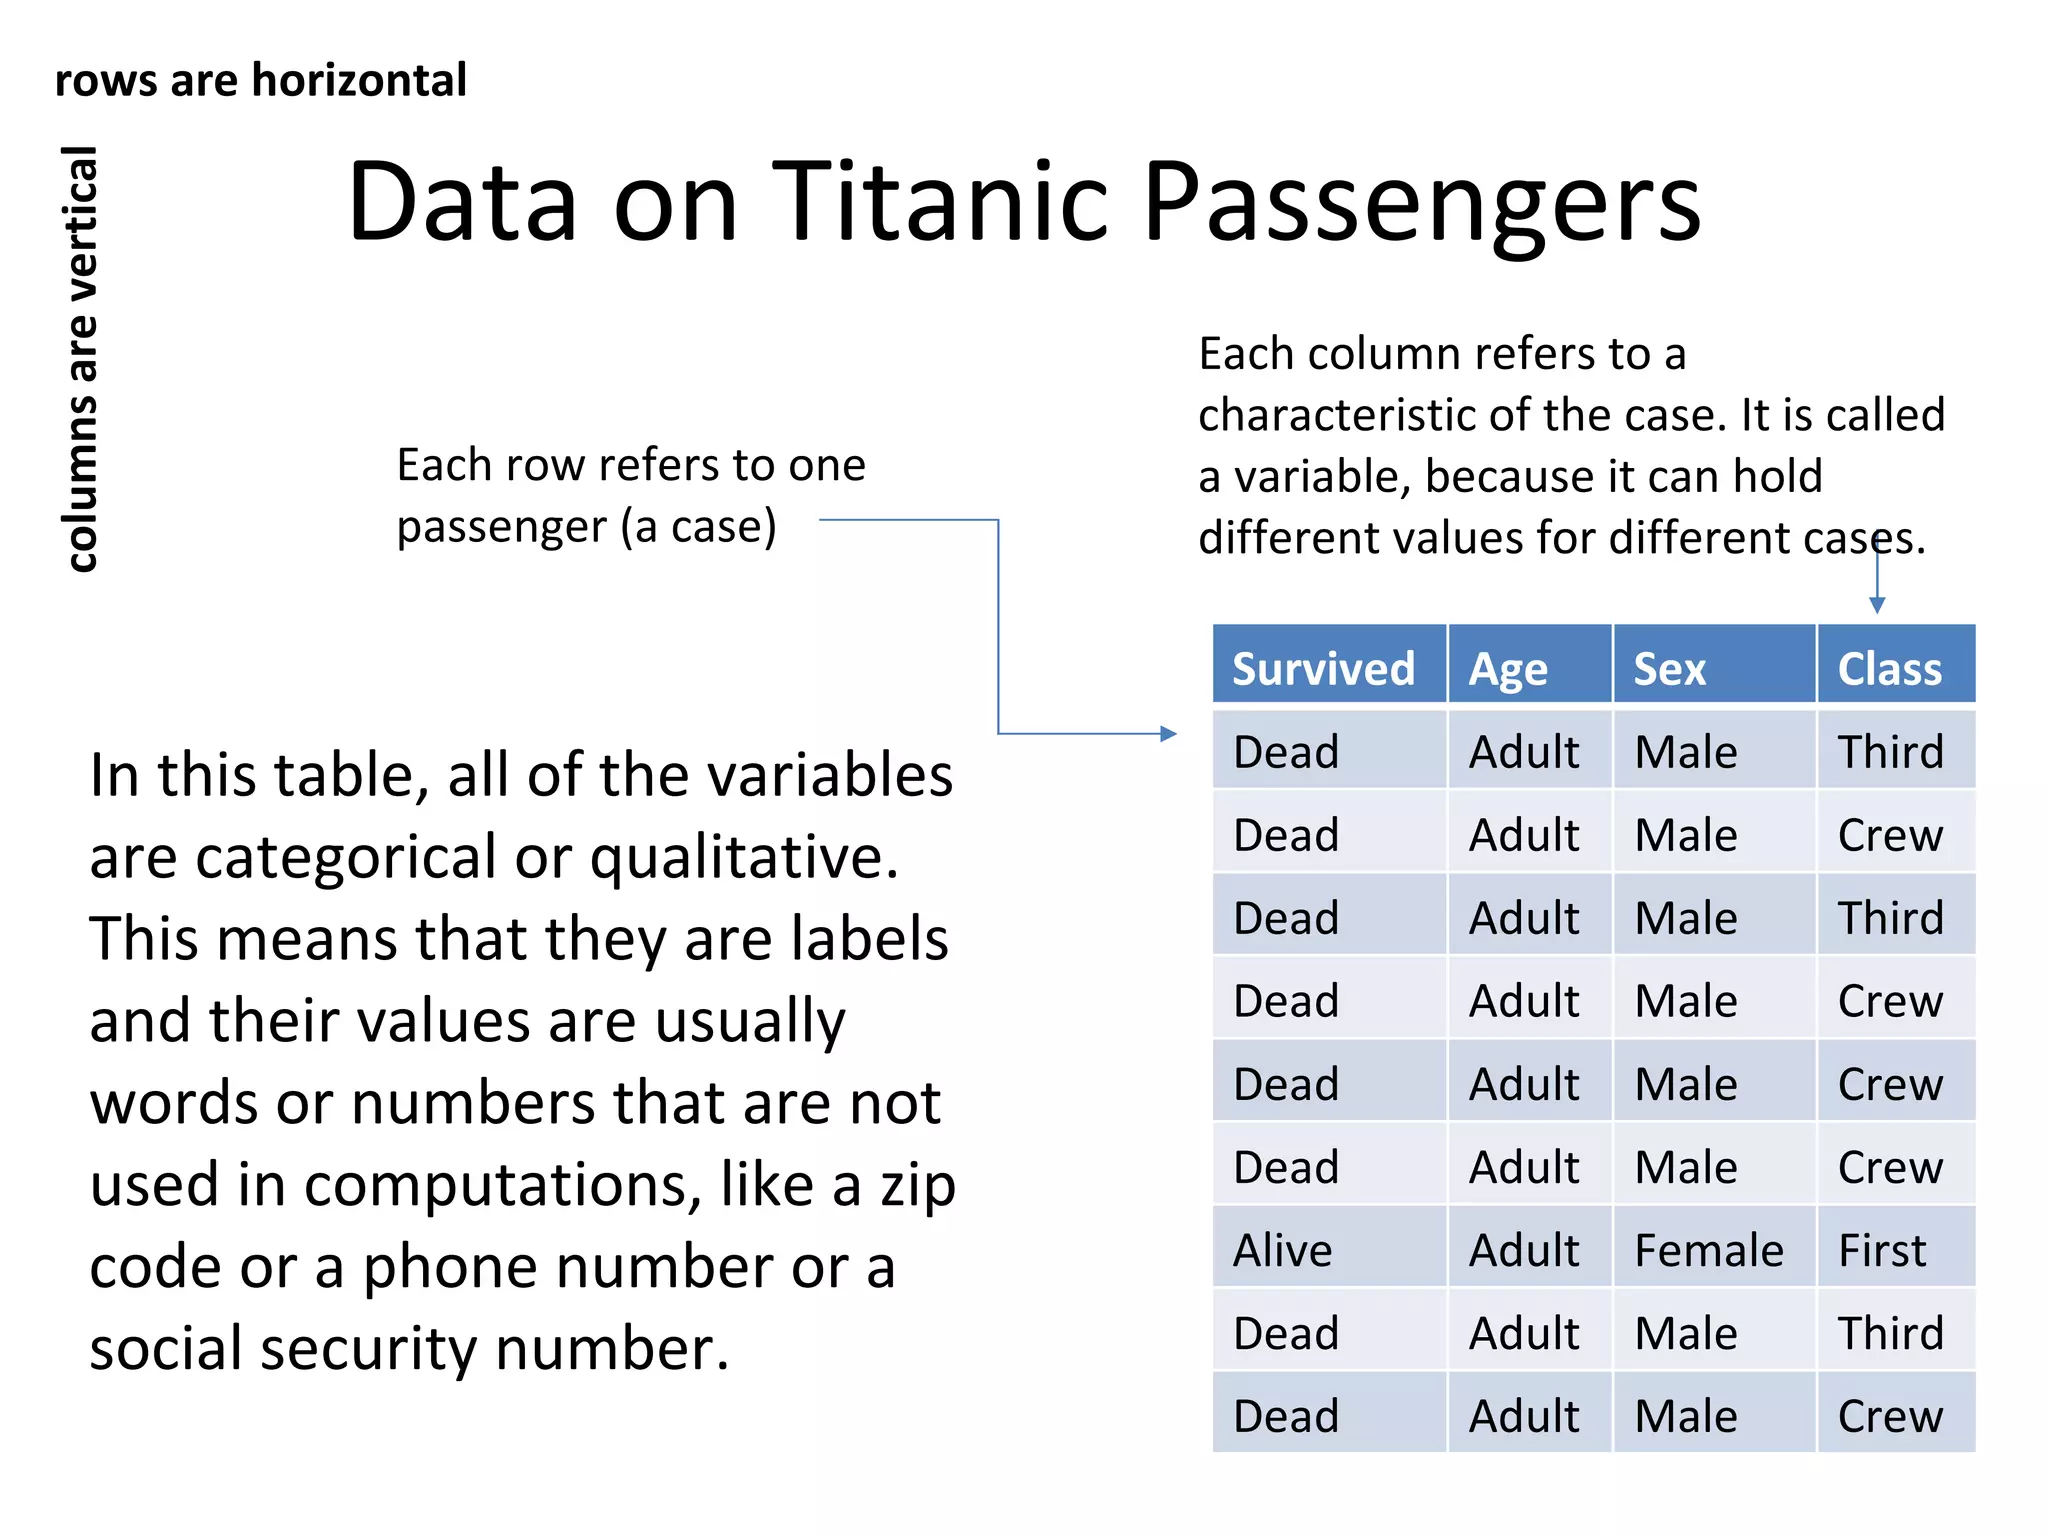
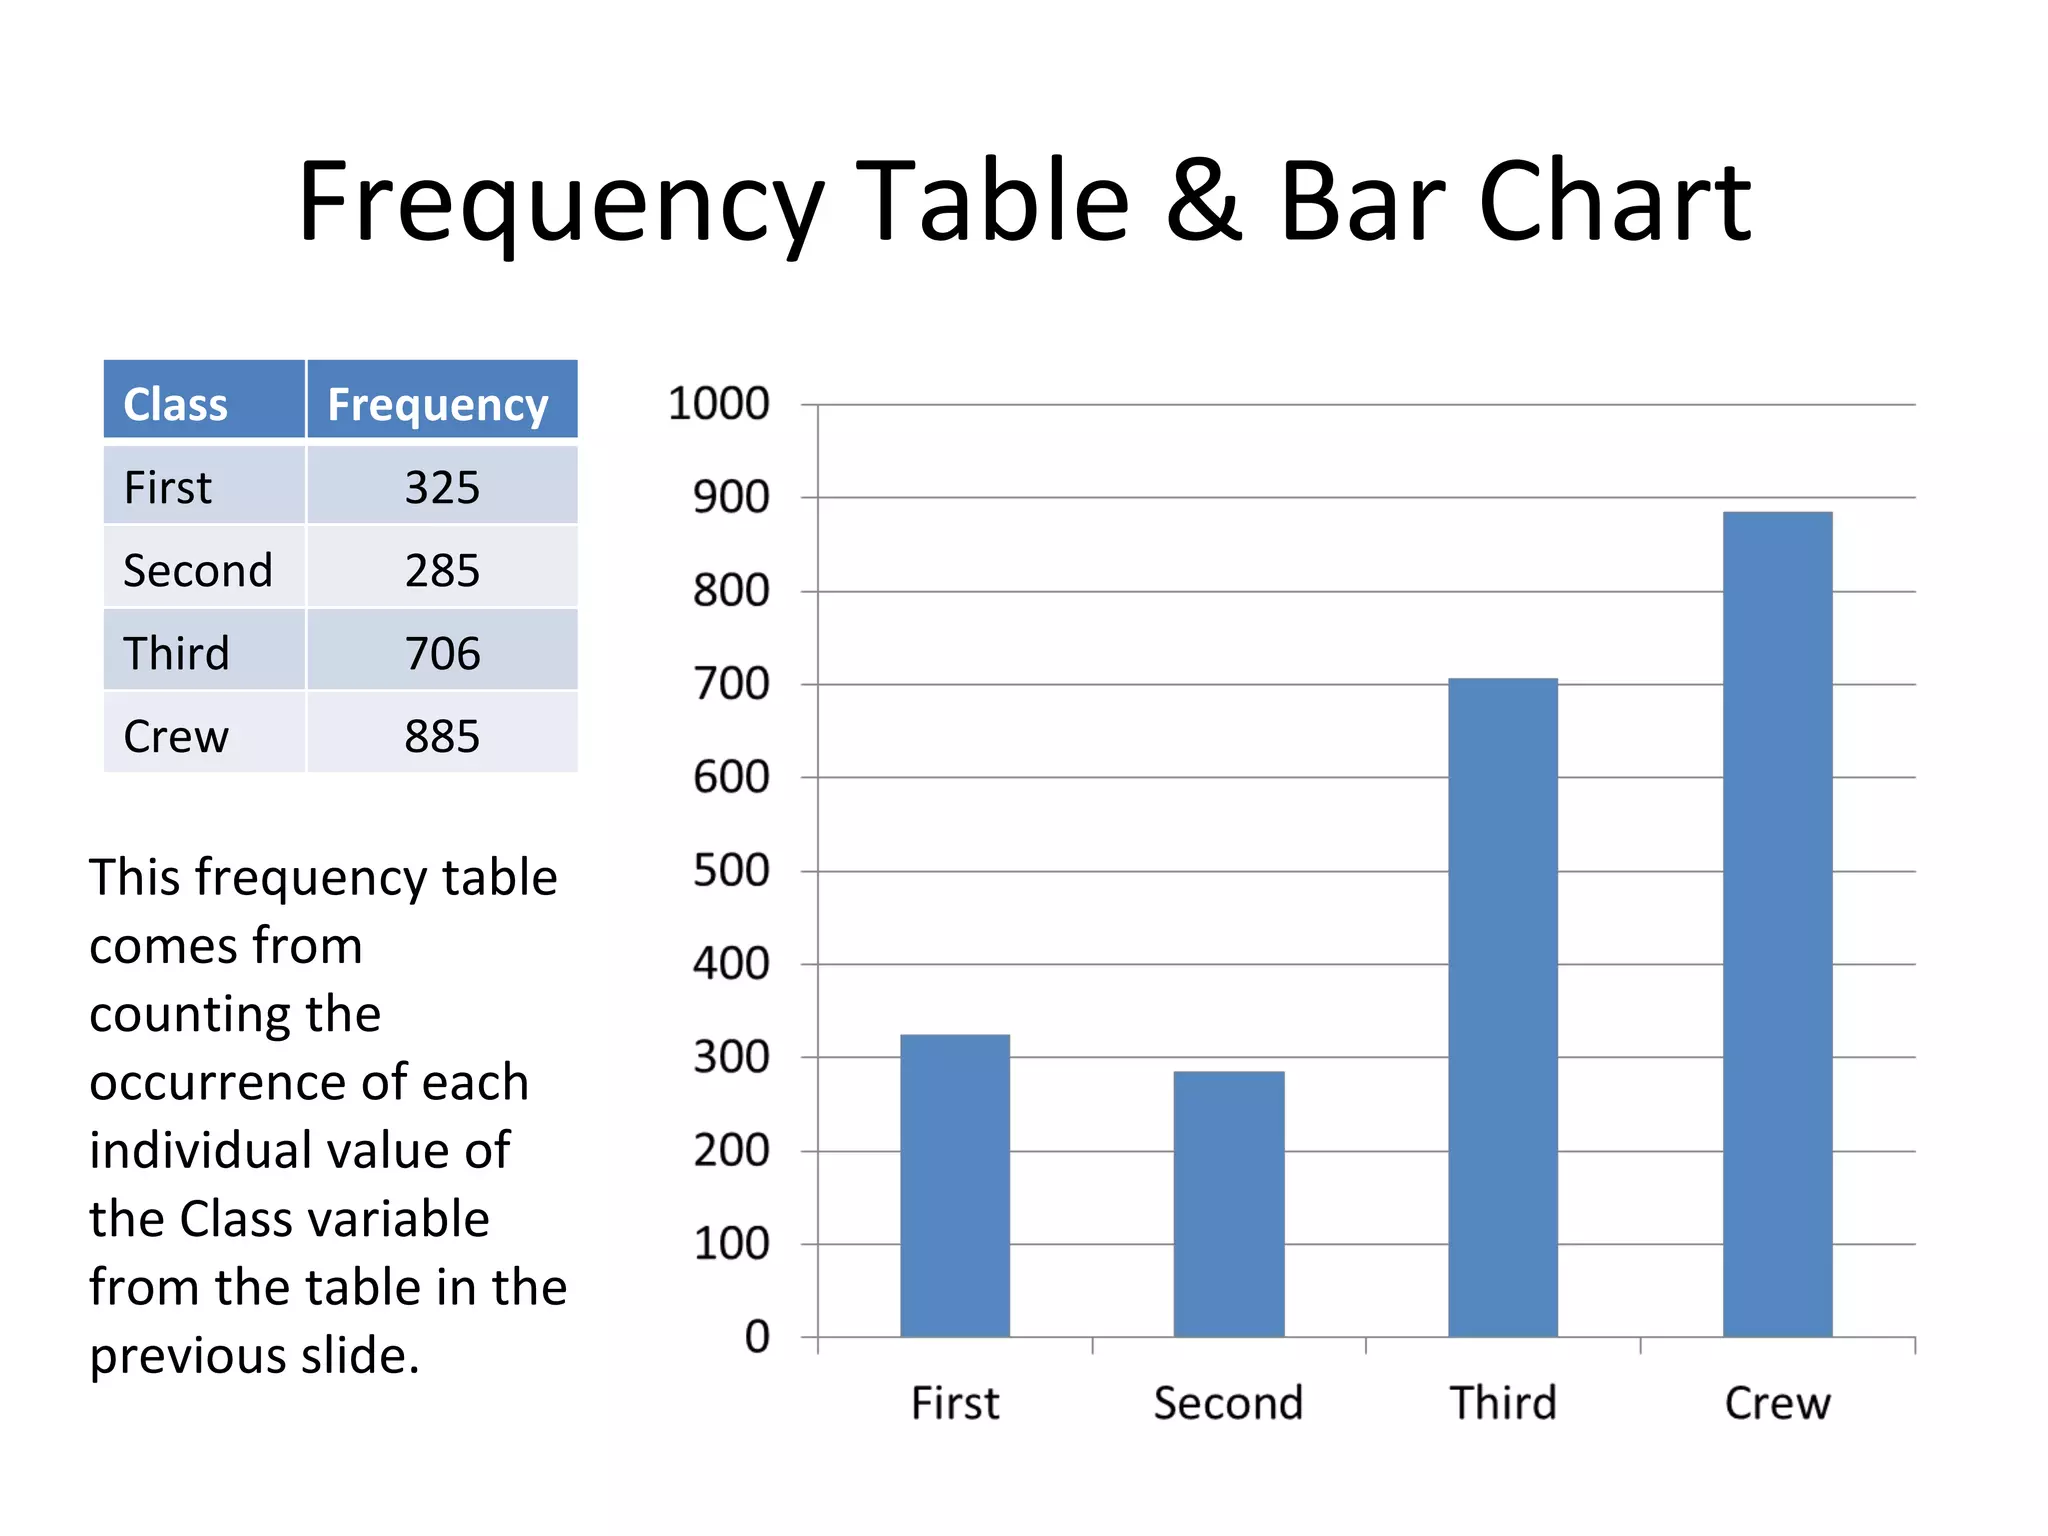
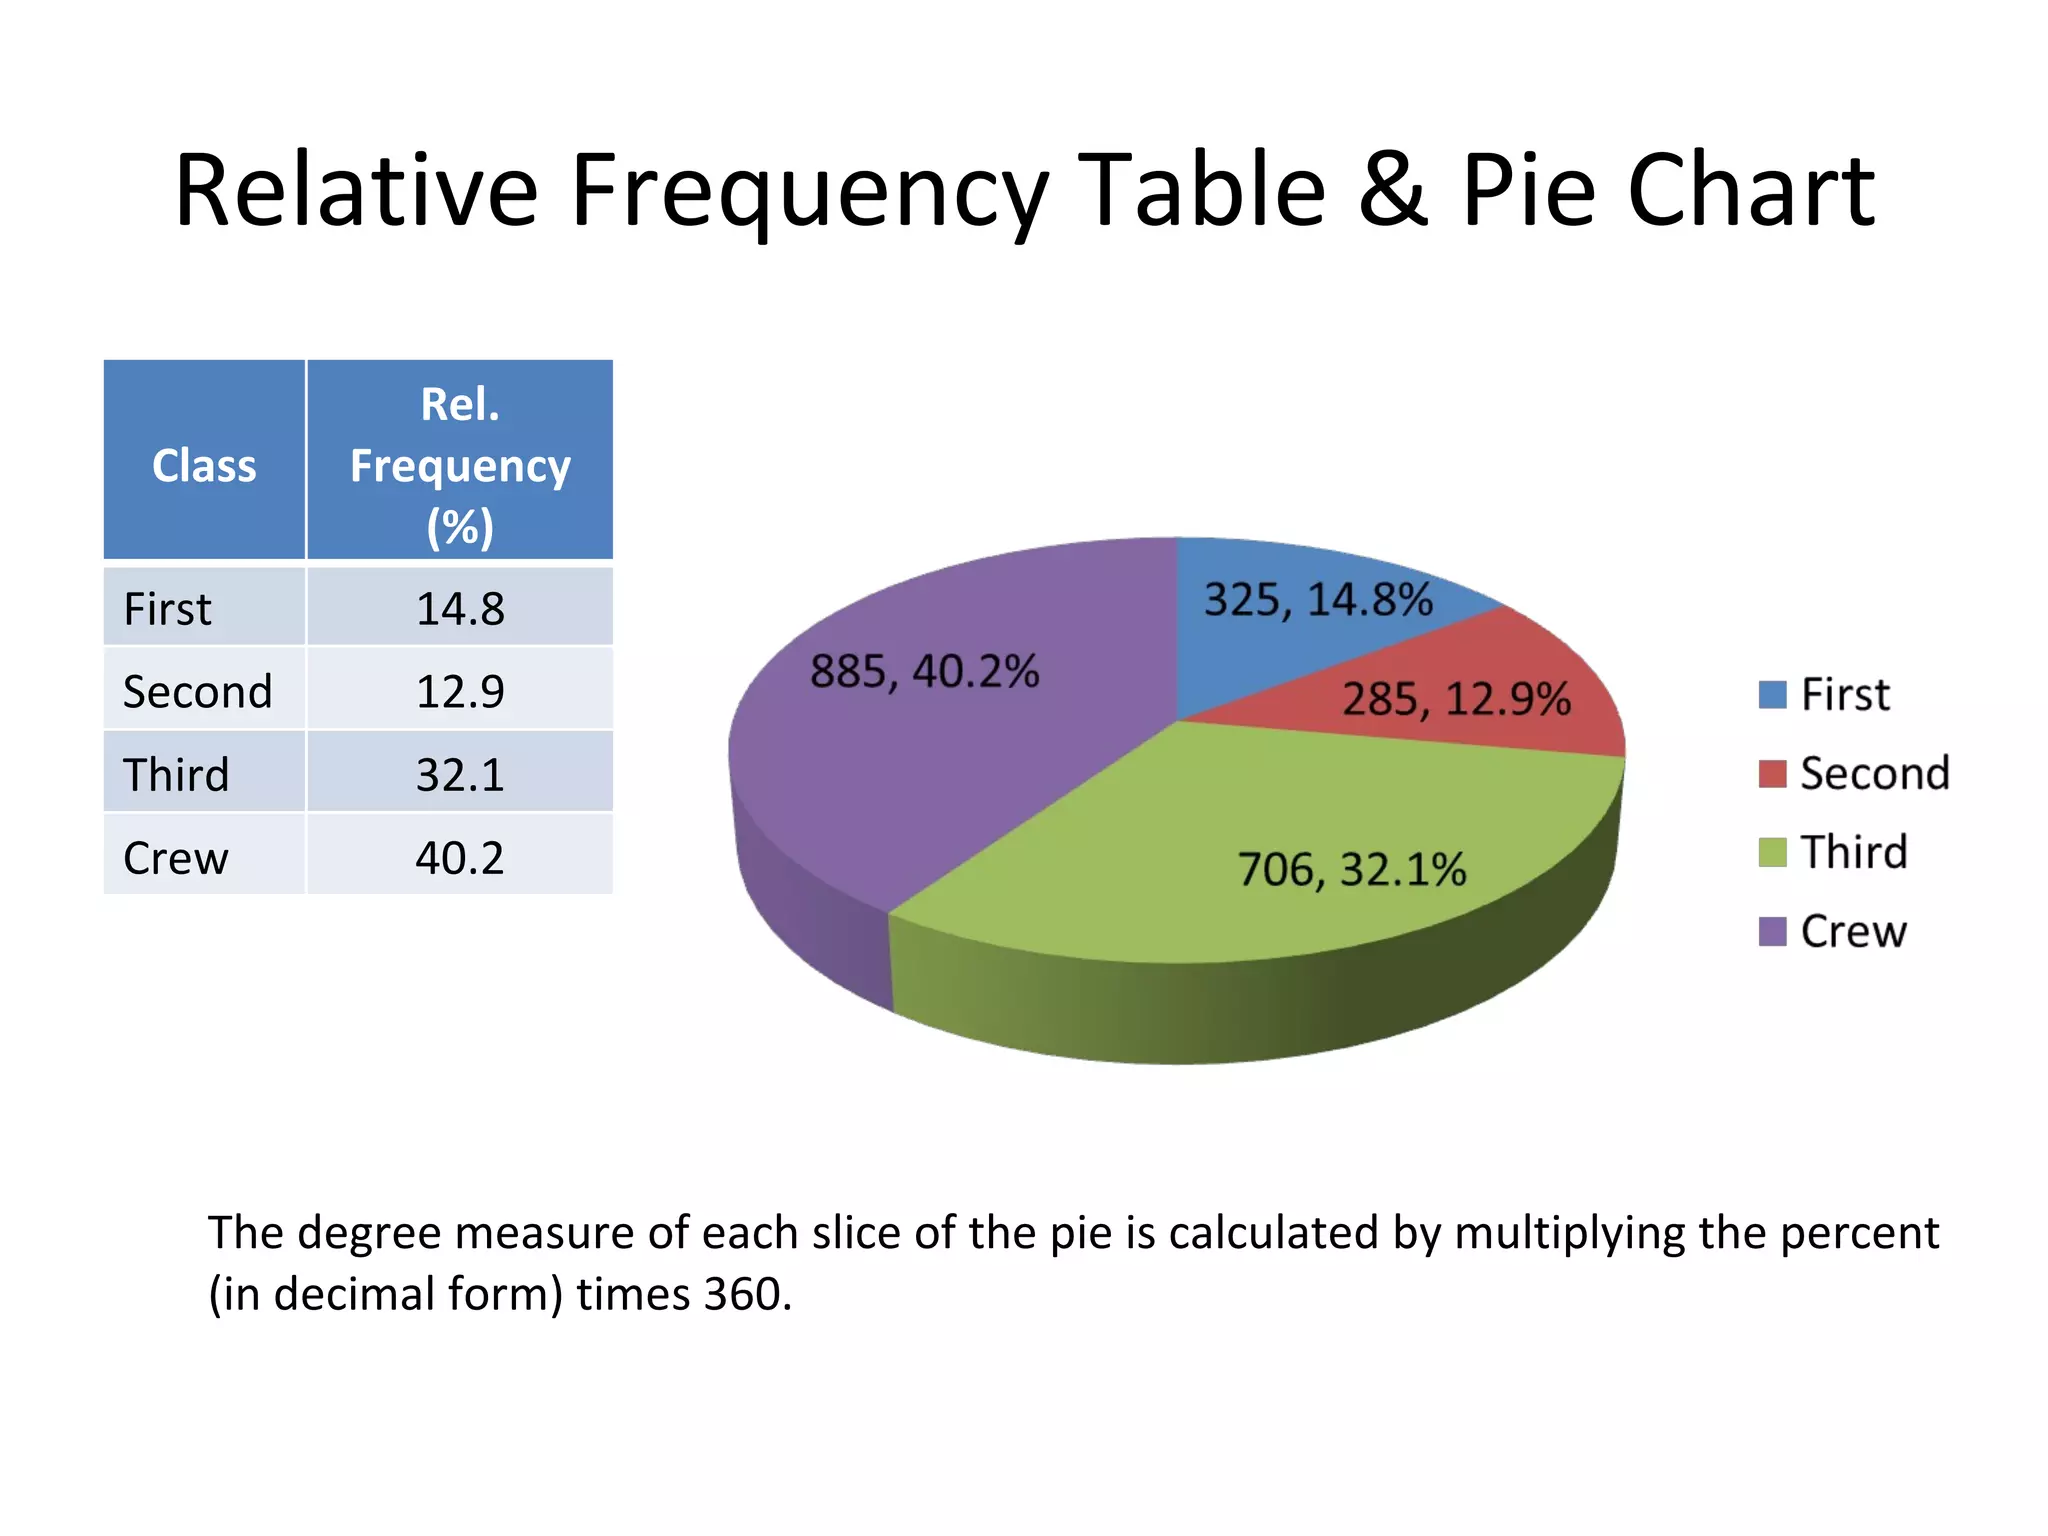
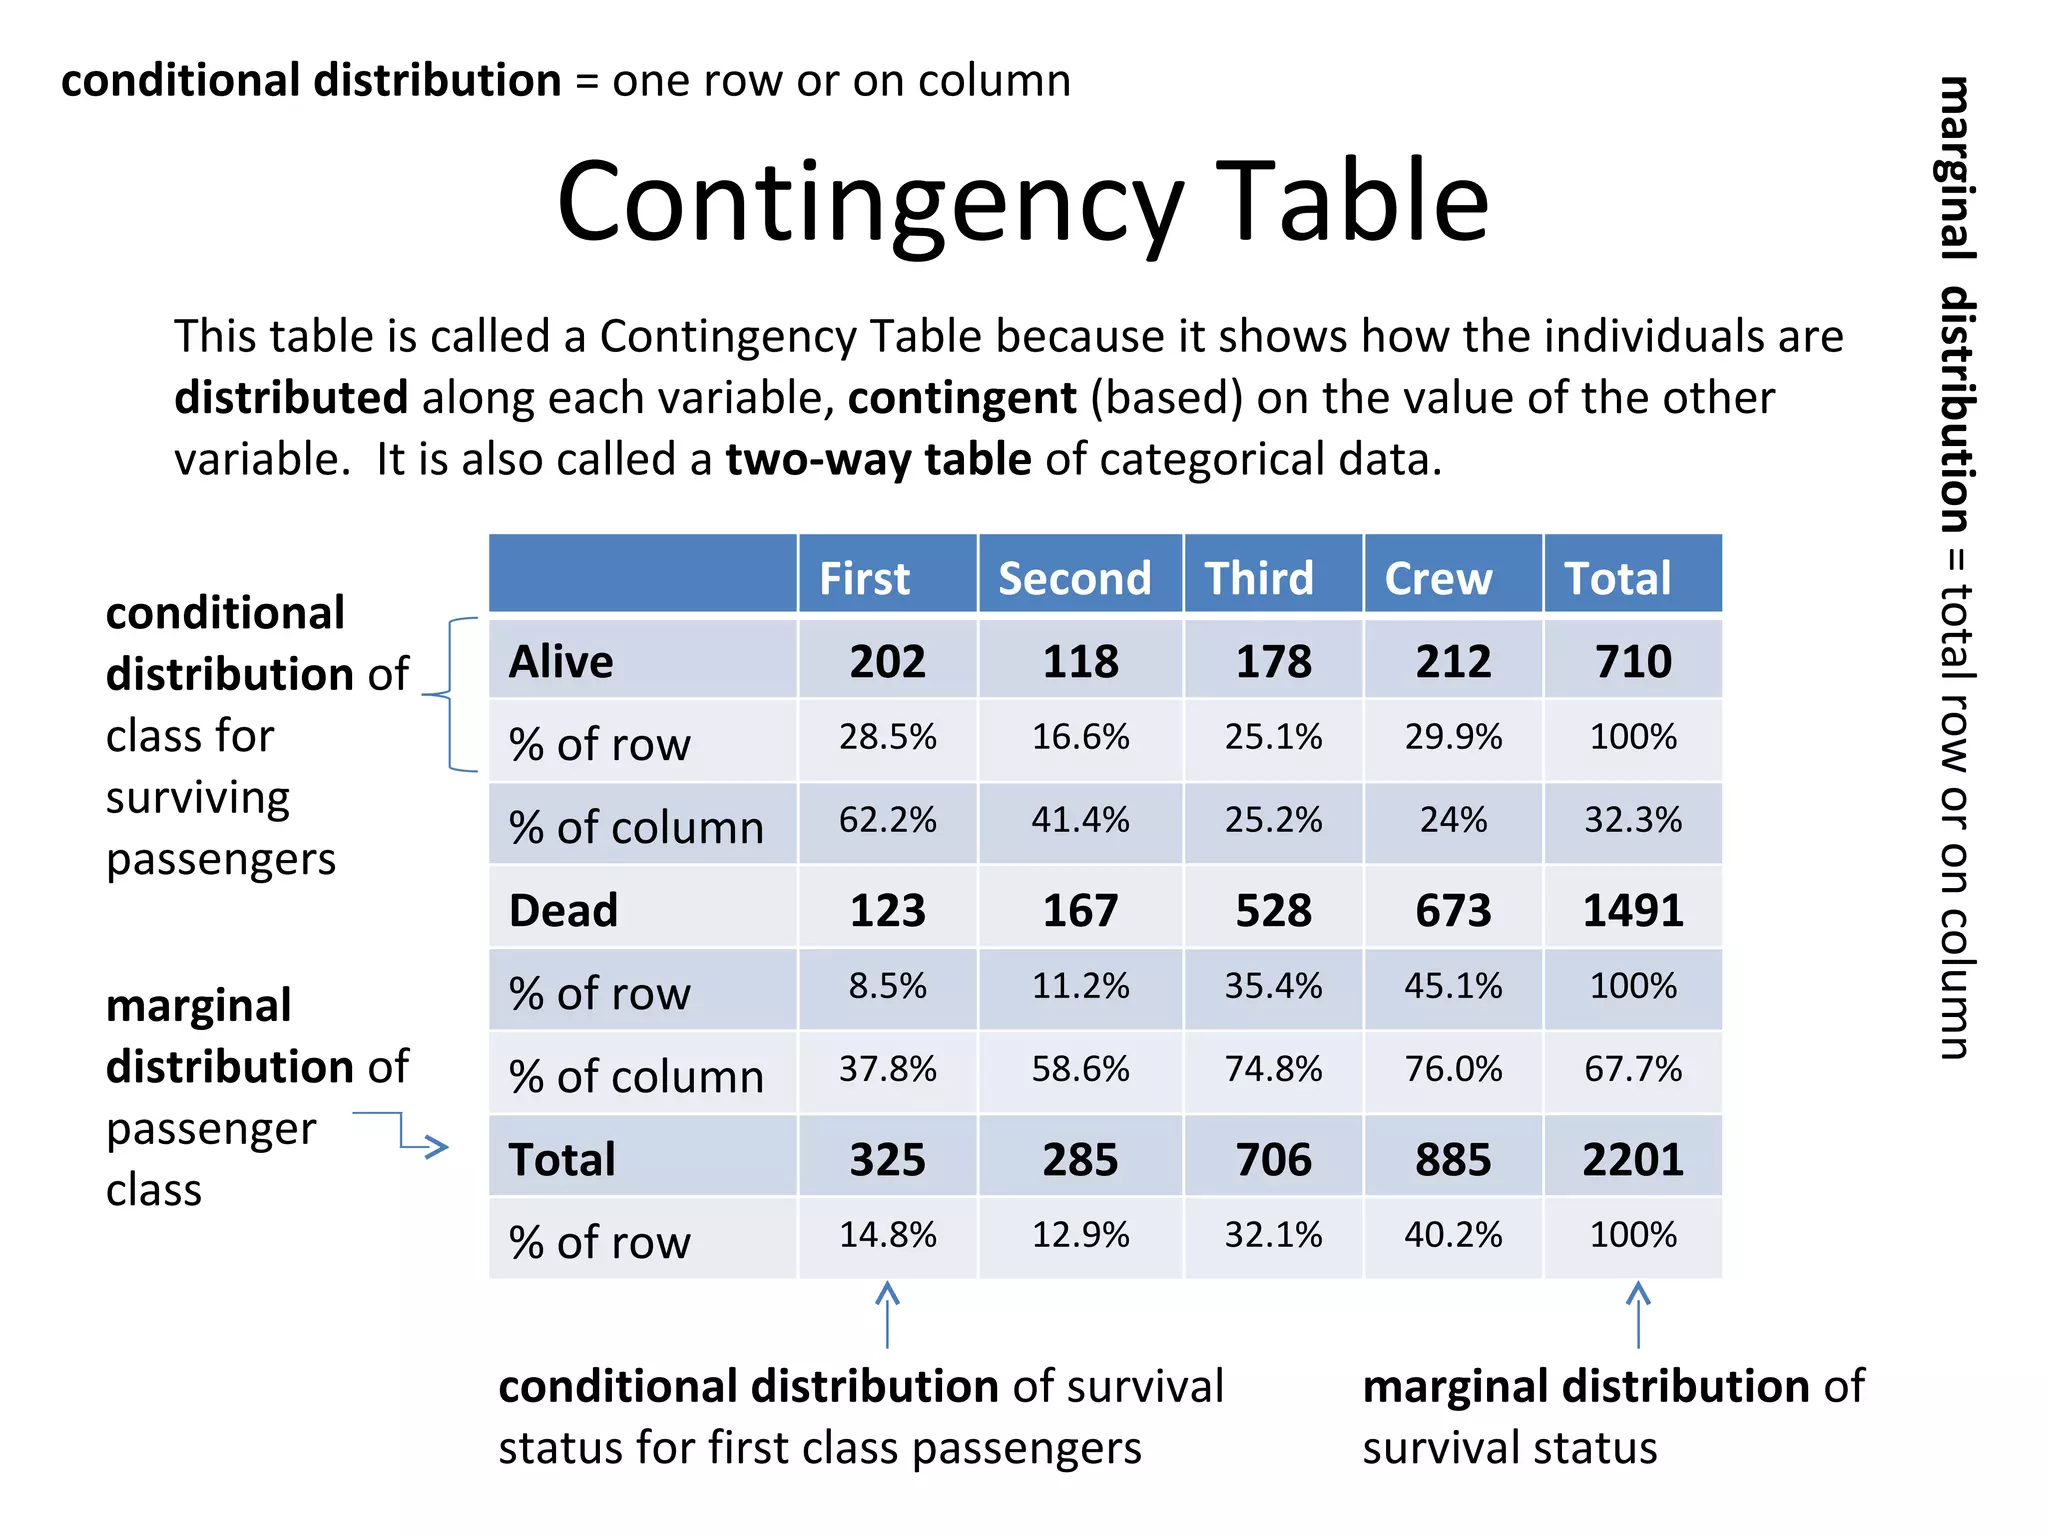
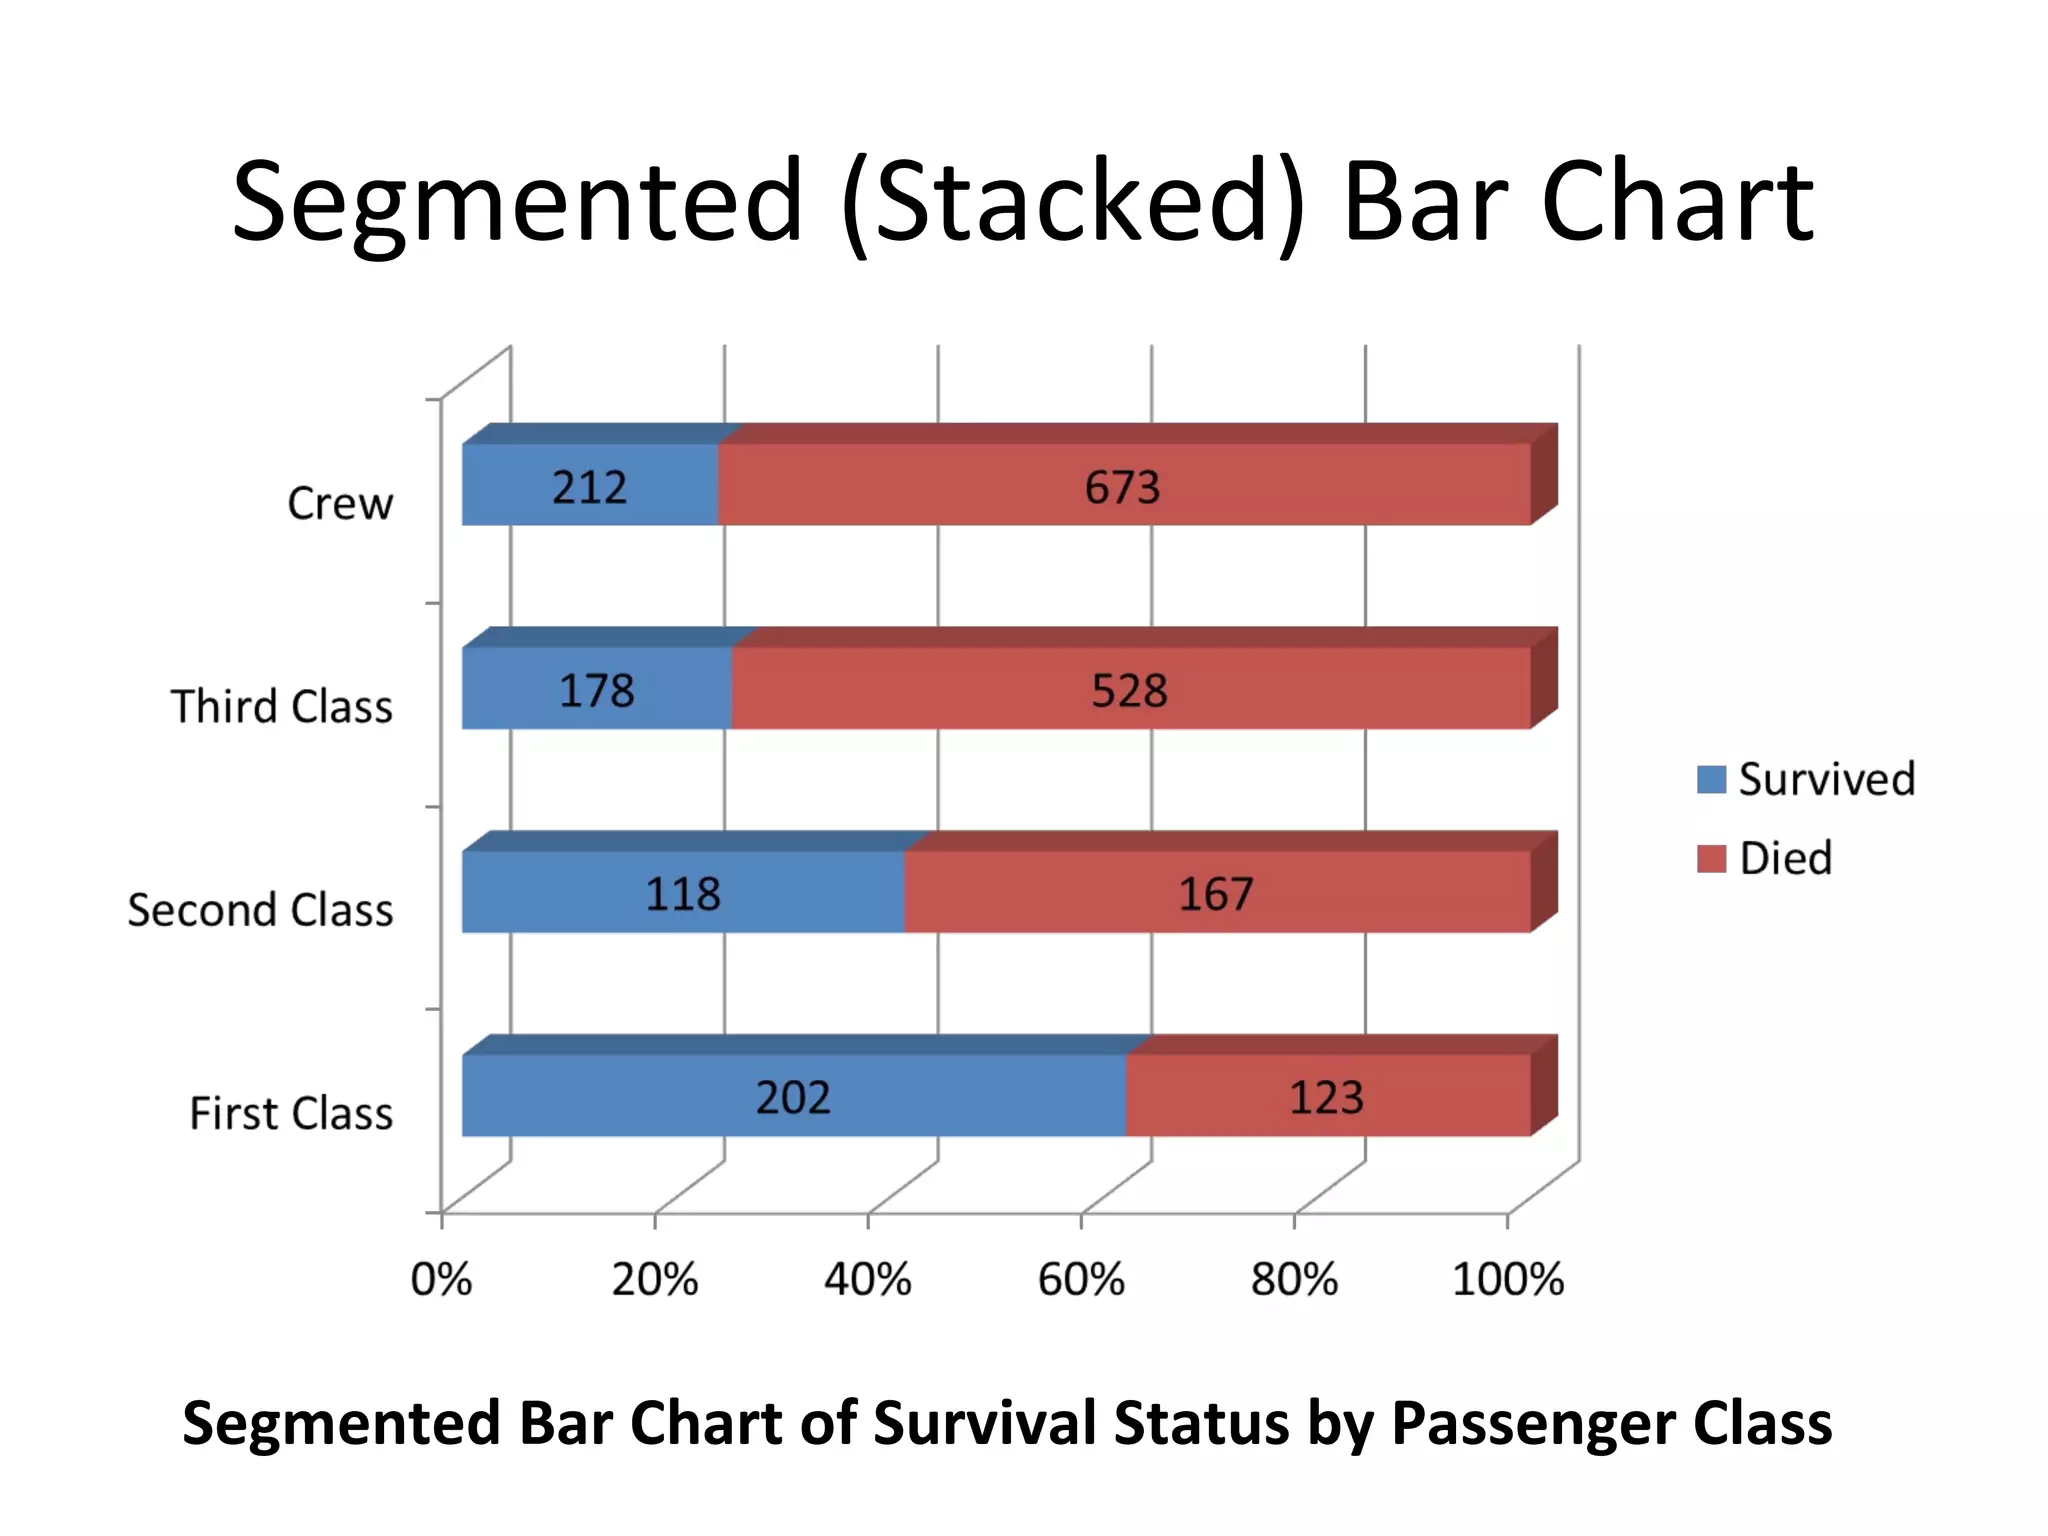
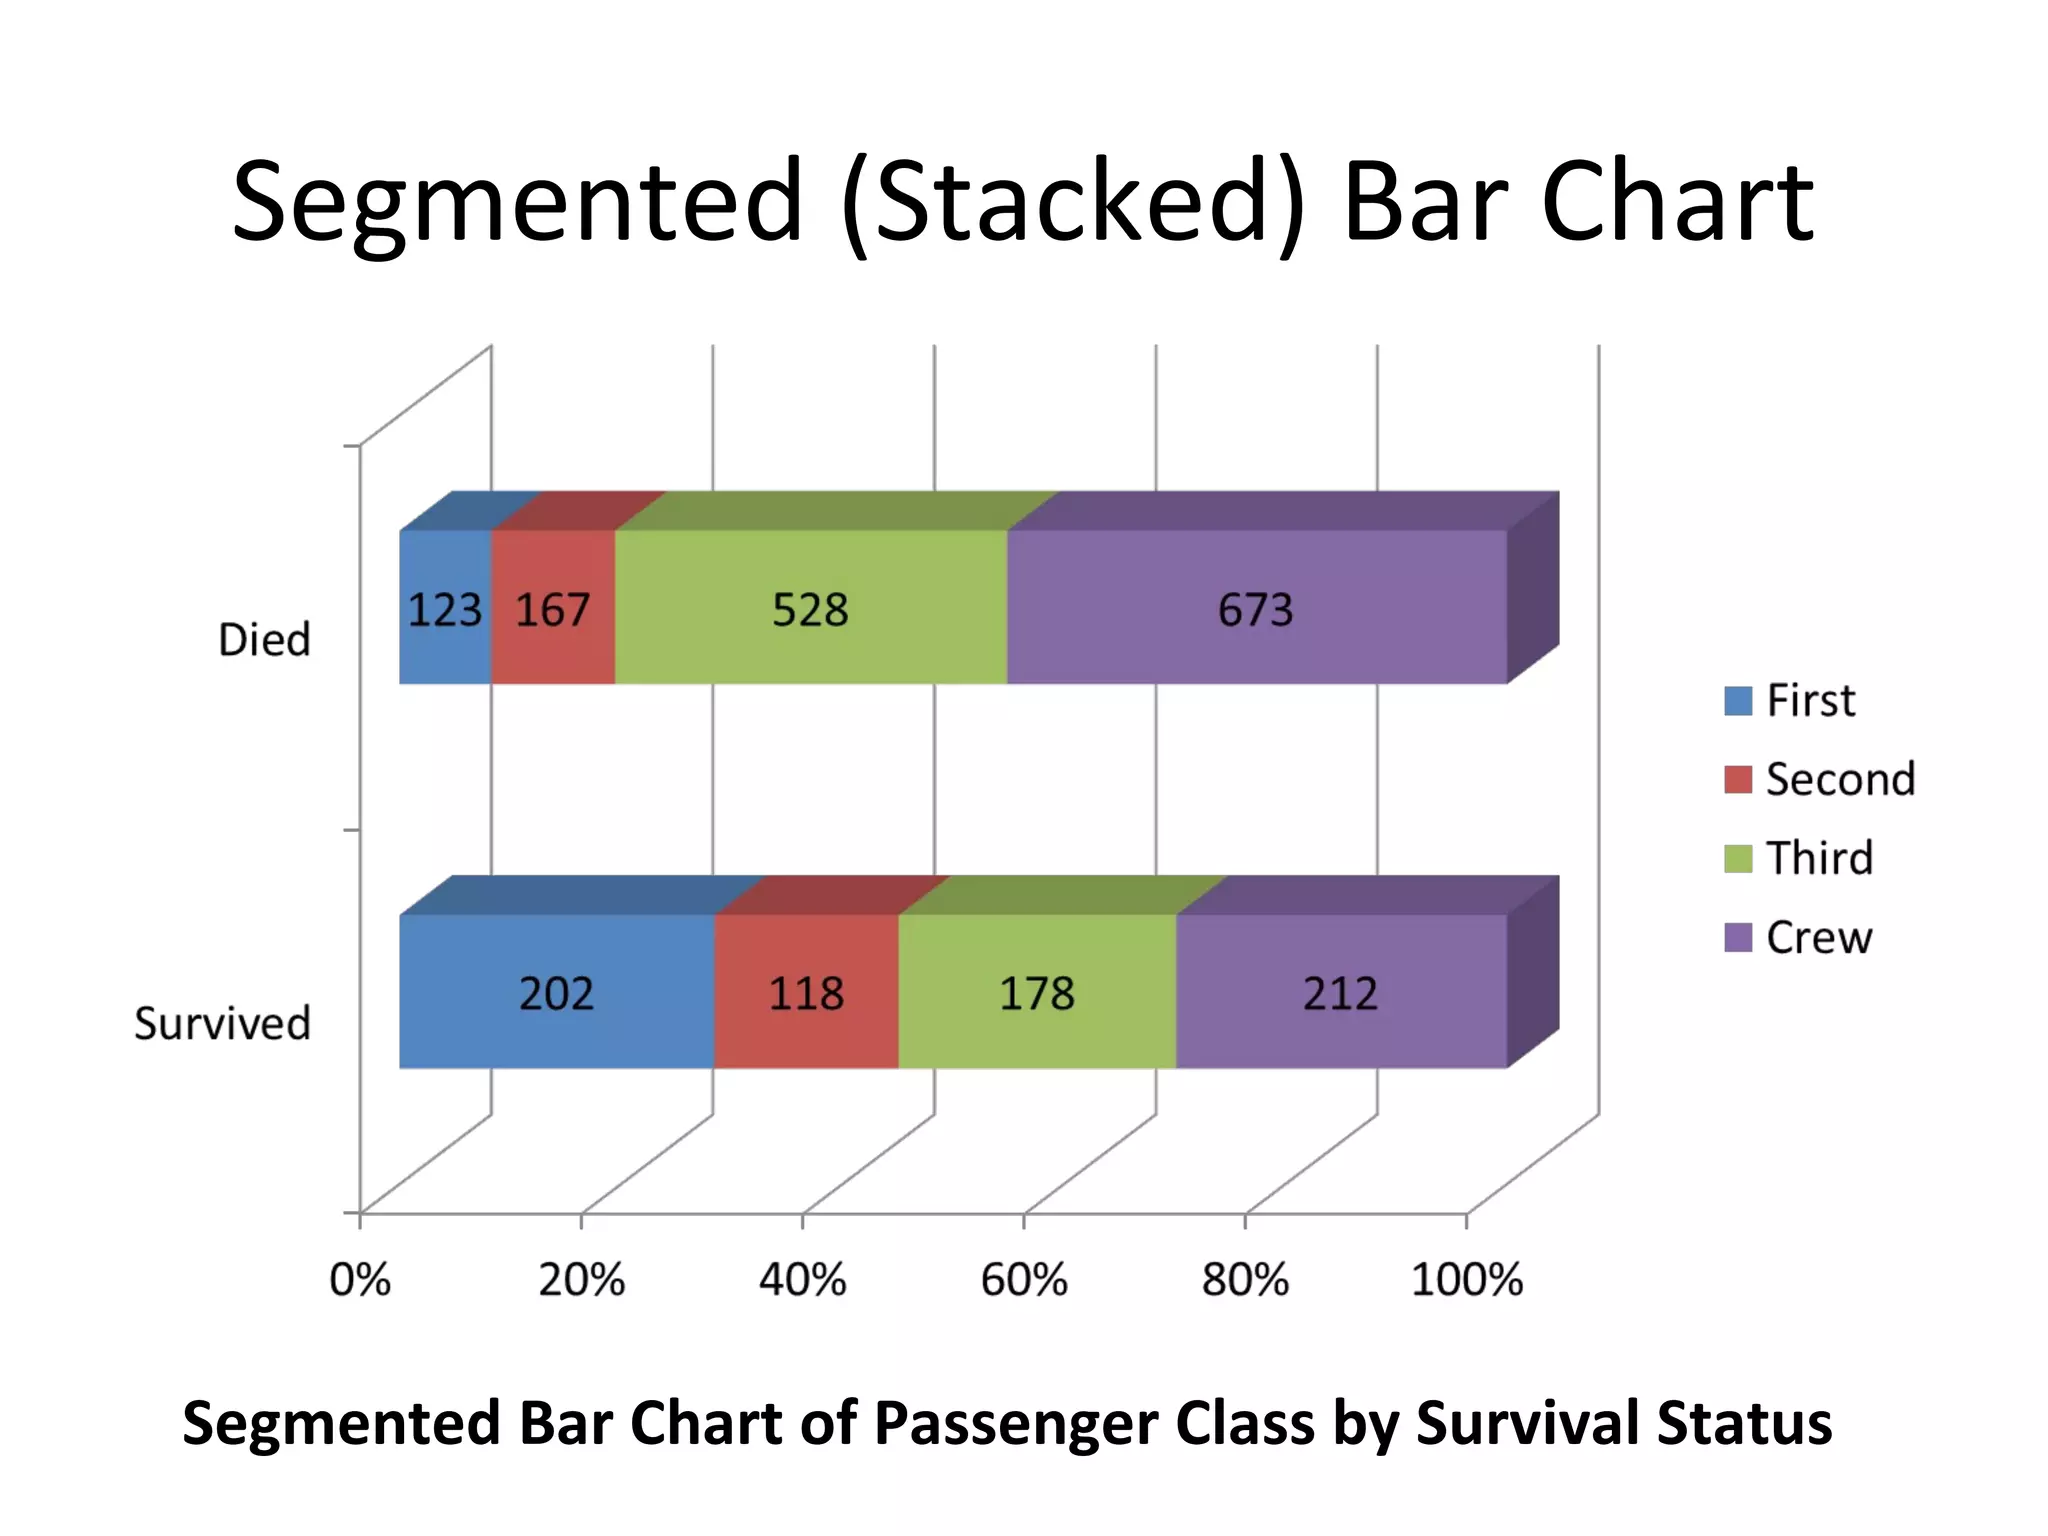
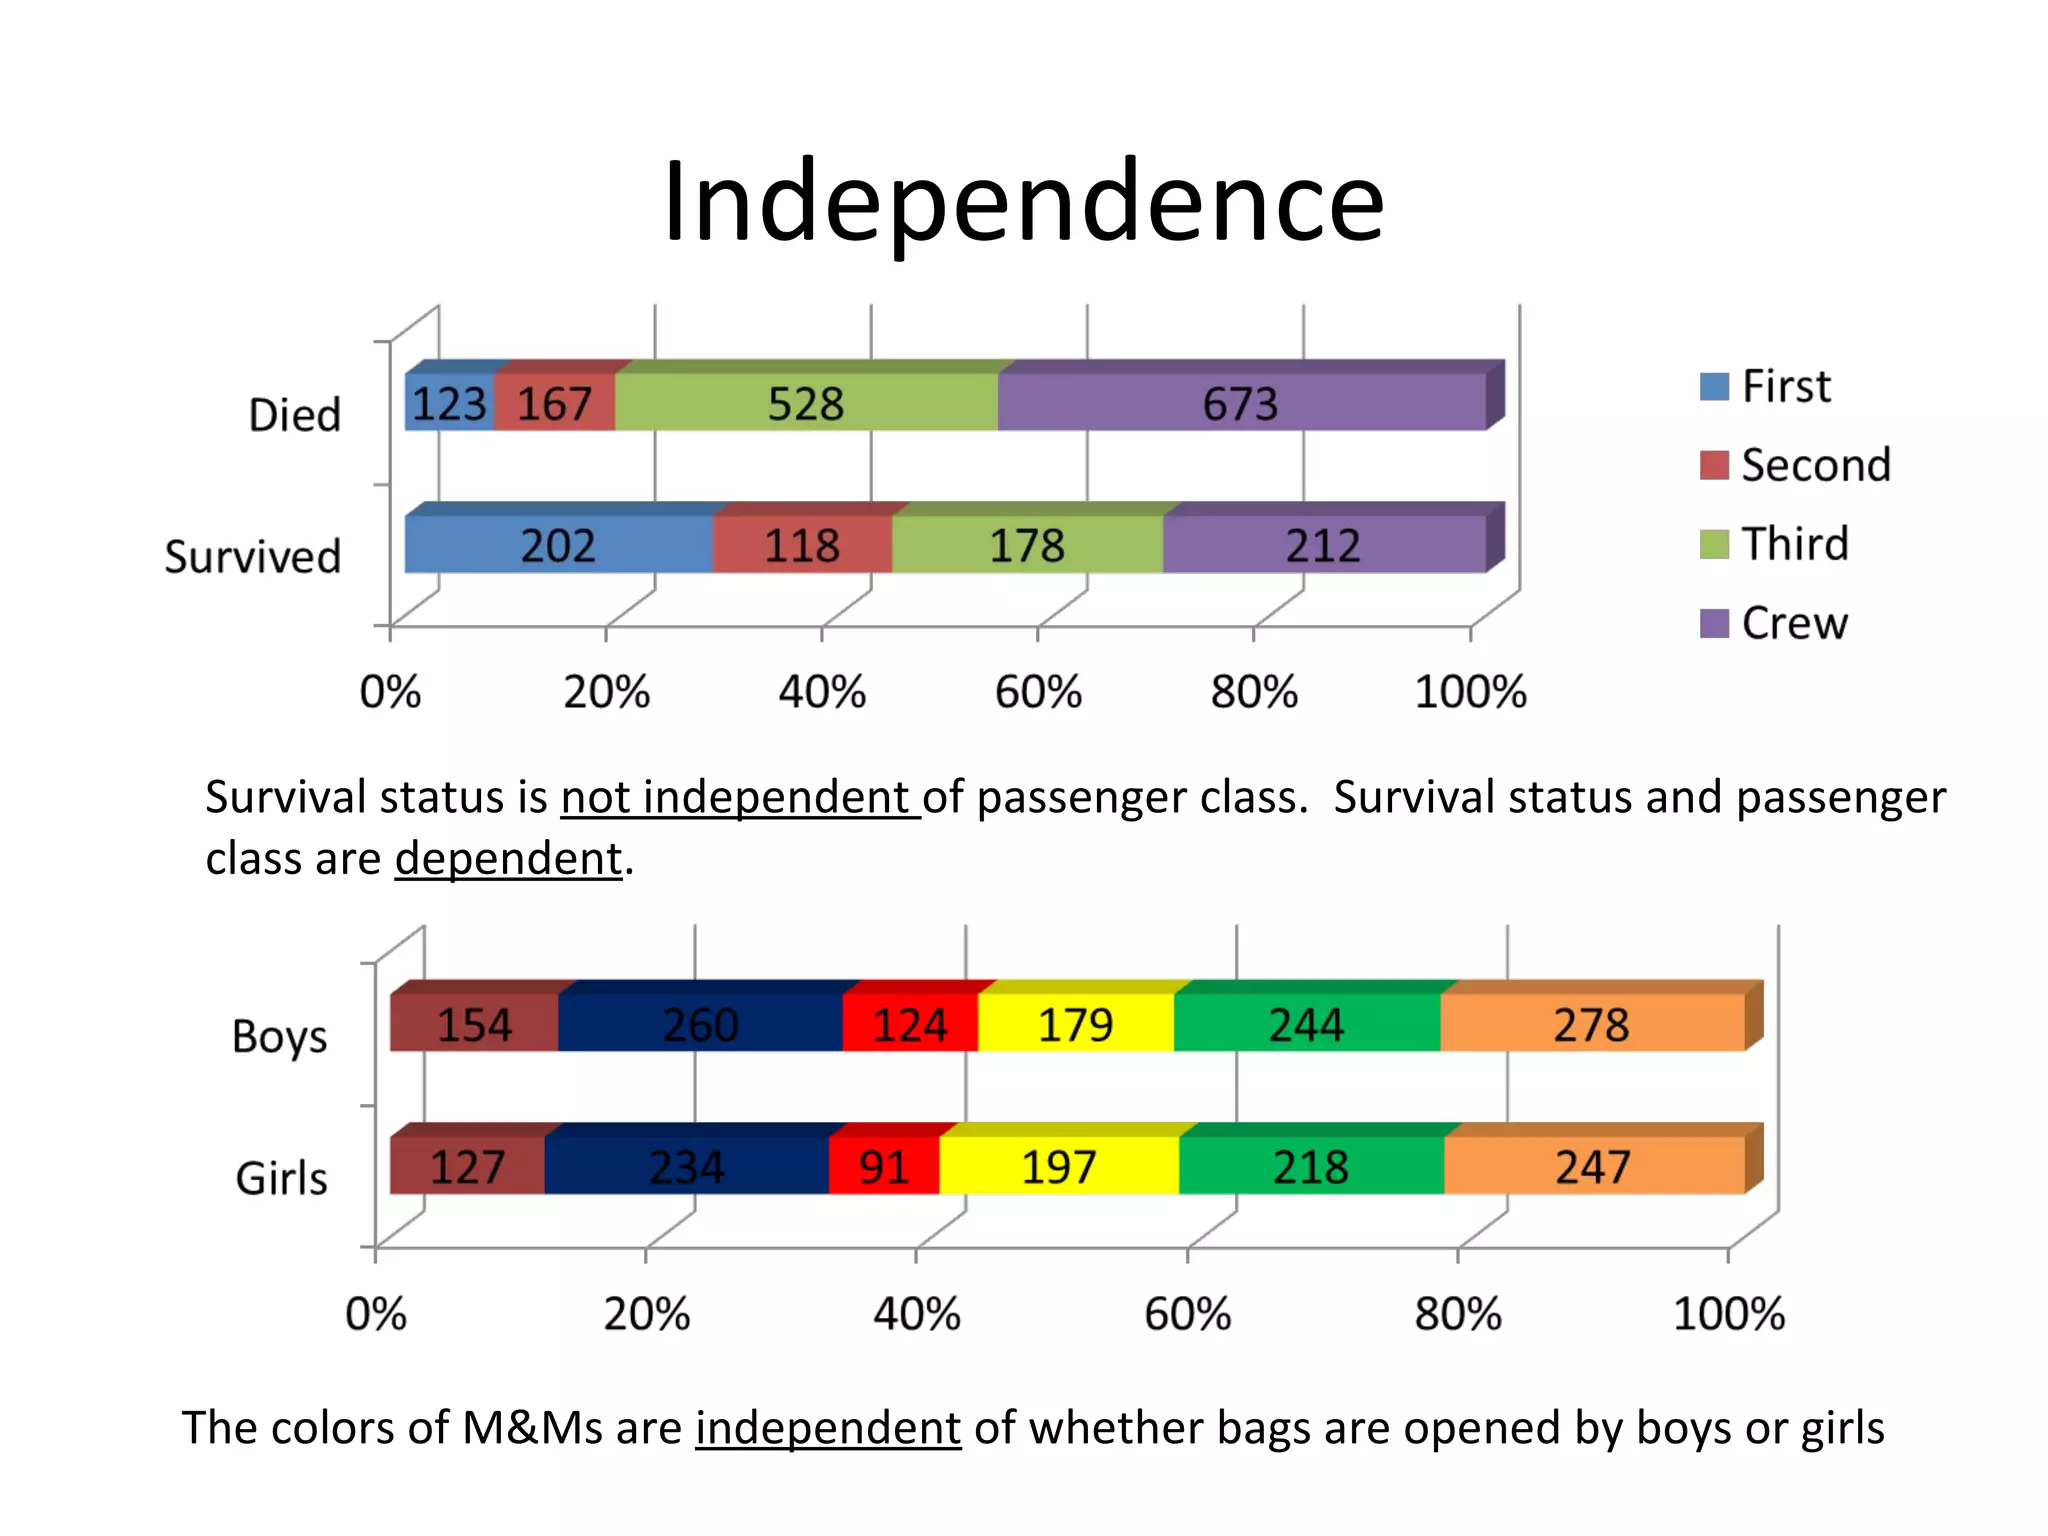
This document discusses statistical measures for working with categorical data. It provides an example dataset on Titanic passengers with variables like class, gender, and survival status. It then shows how to organize this data into frequency tables, contingency tables, bar charts, and segmented bar charts. These visualizations allow examining relationships between the categorical variables like the dependence between passenger class and survival status. The document also discusses concepts like conditional and marginal distributions, independence, and dependence.