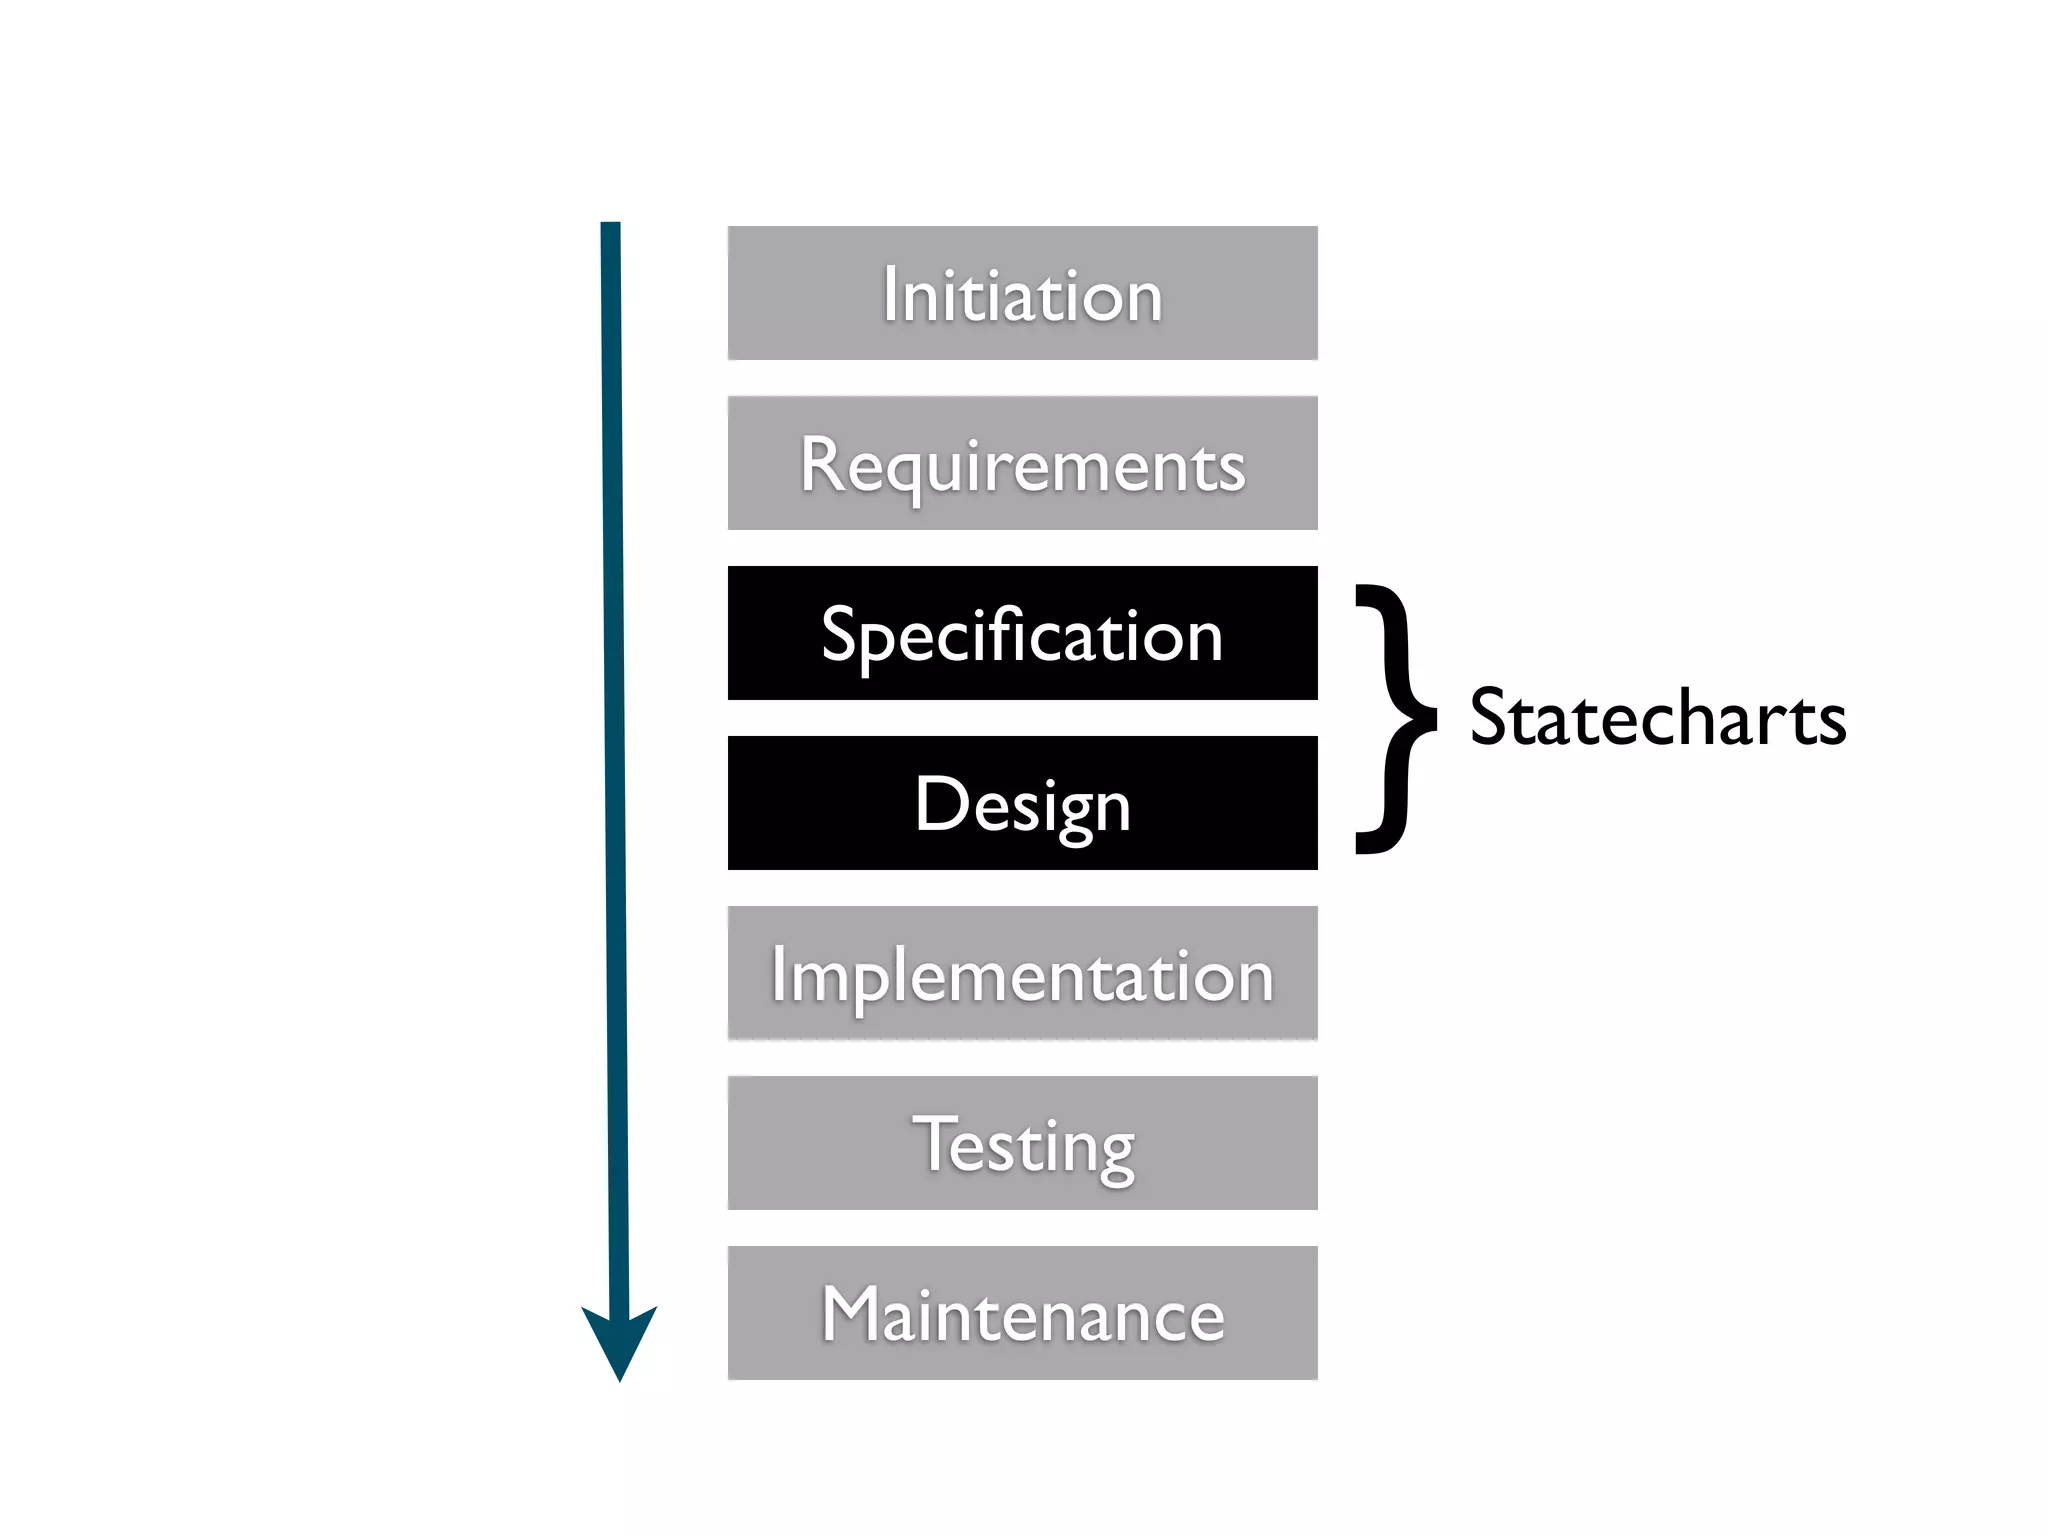
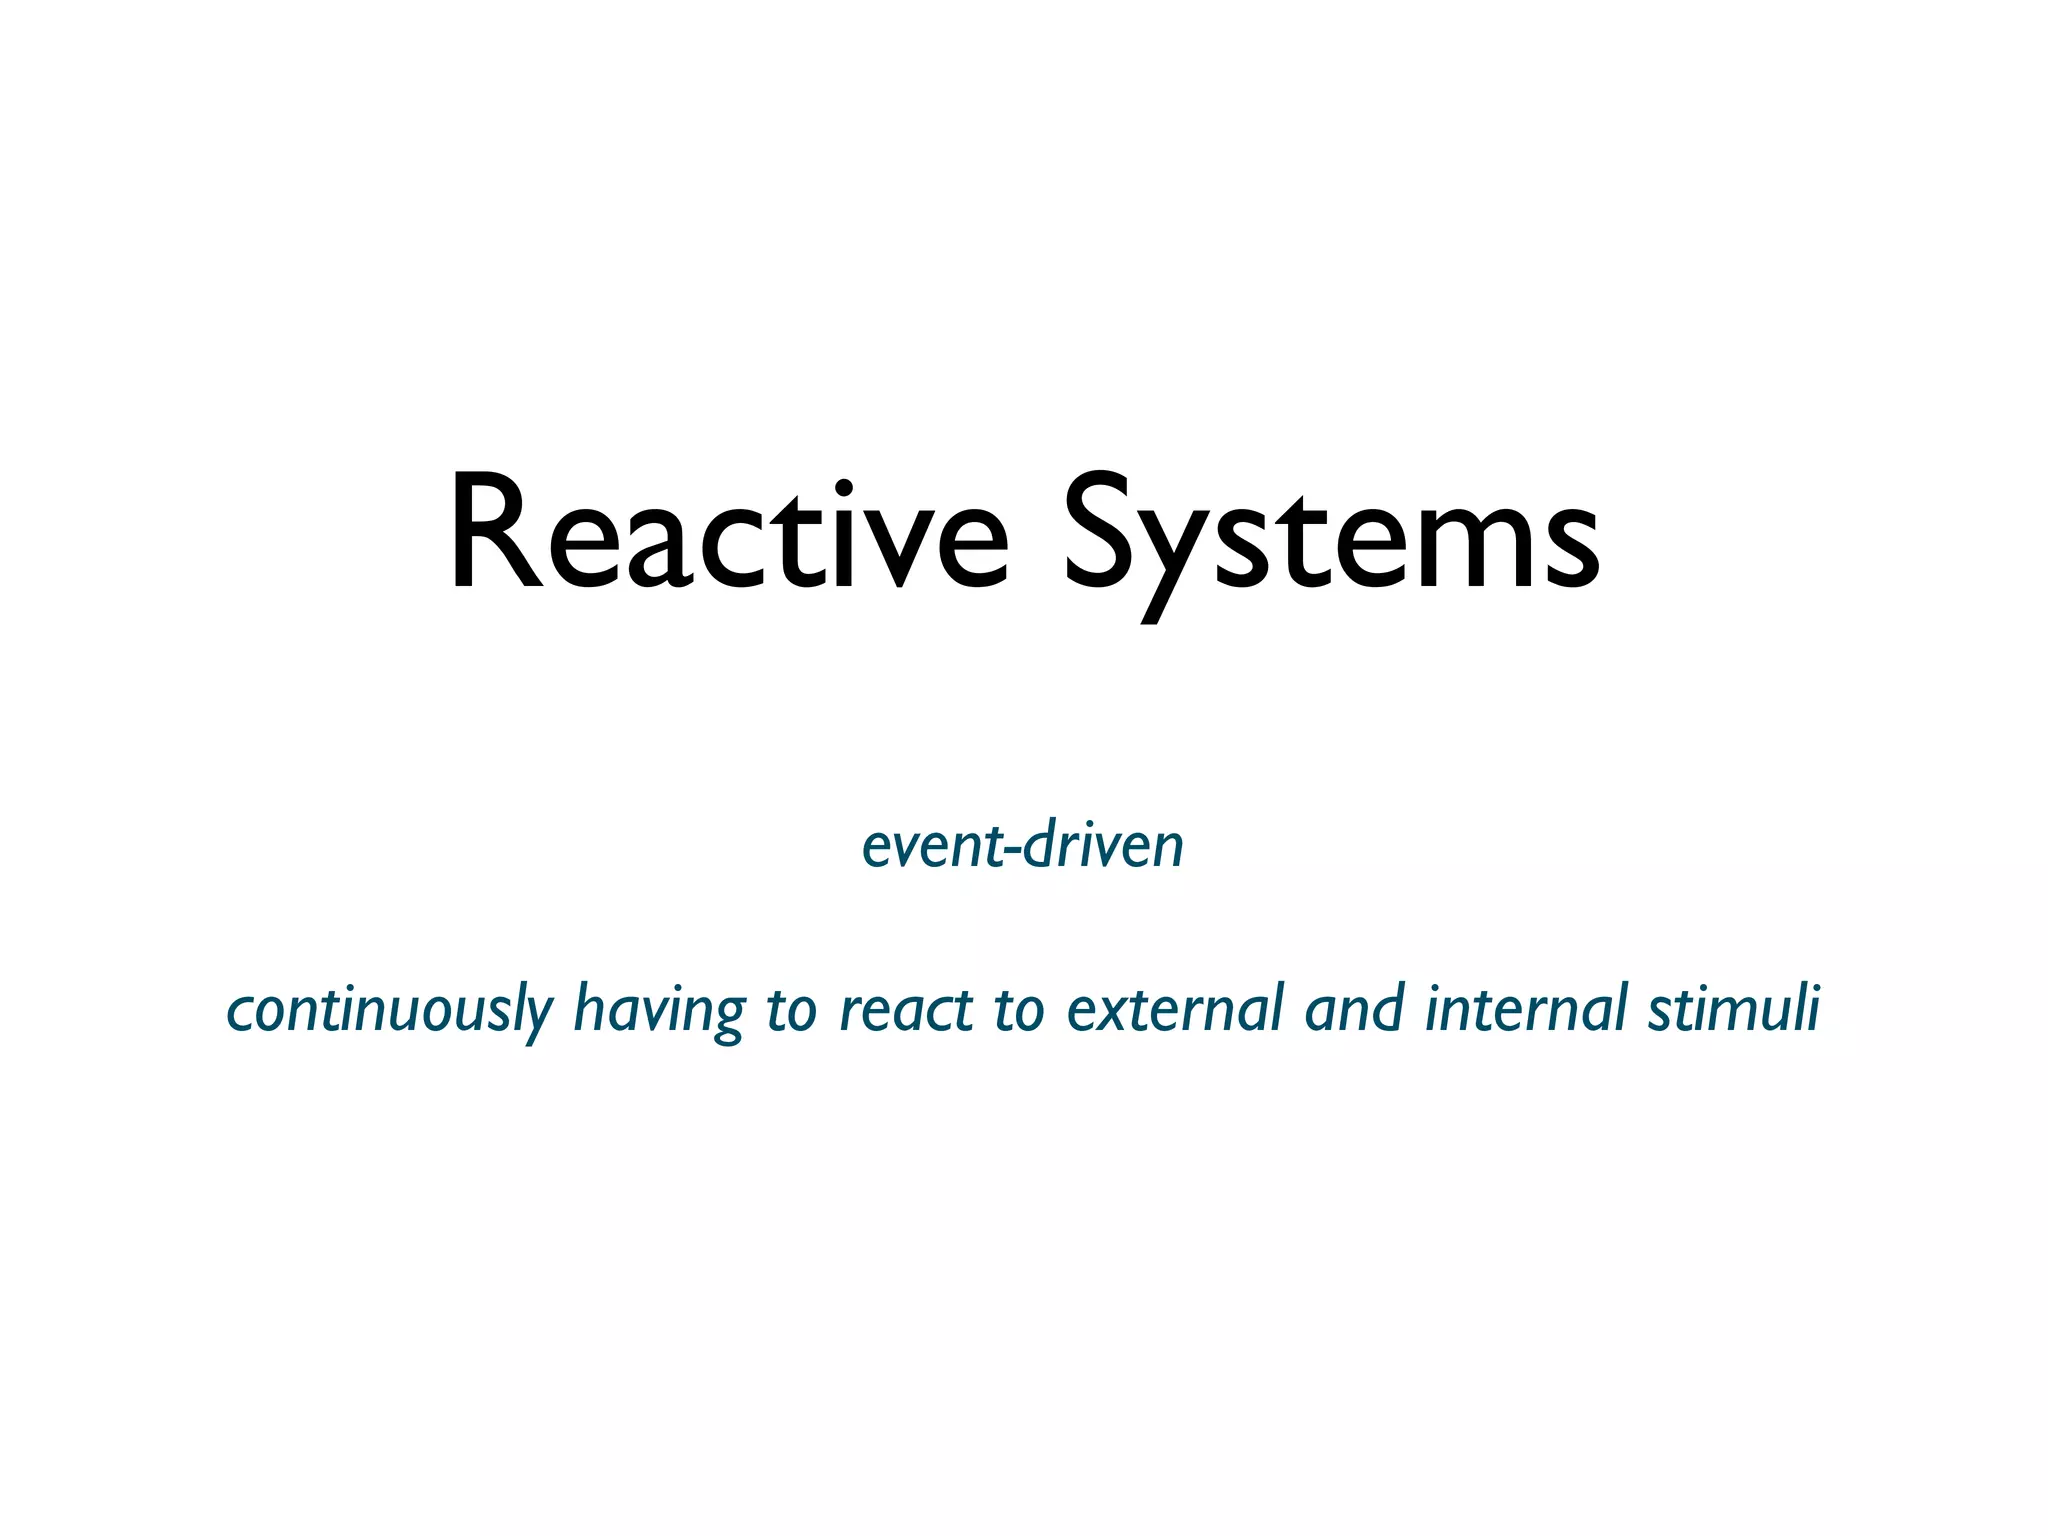
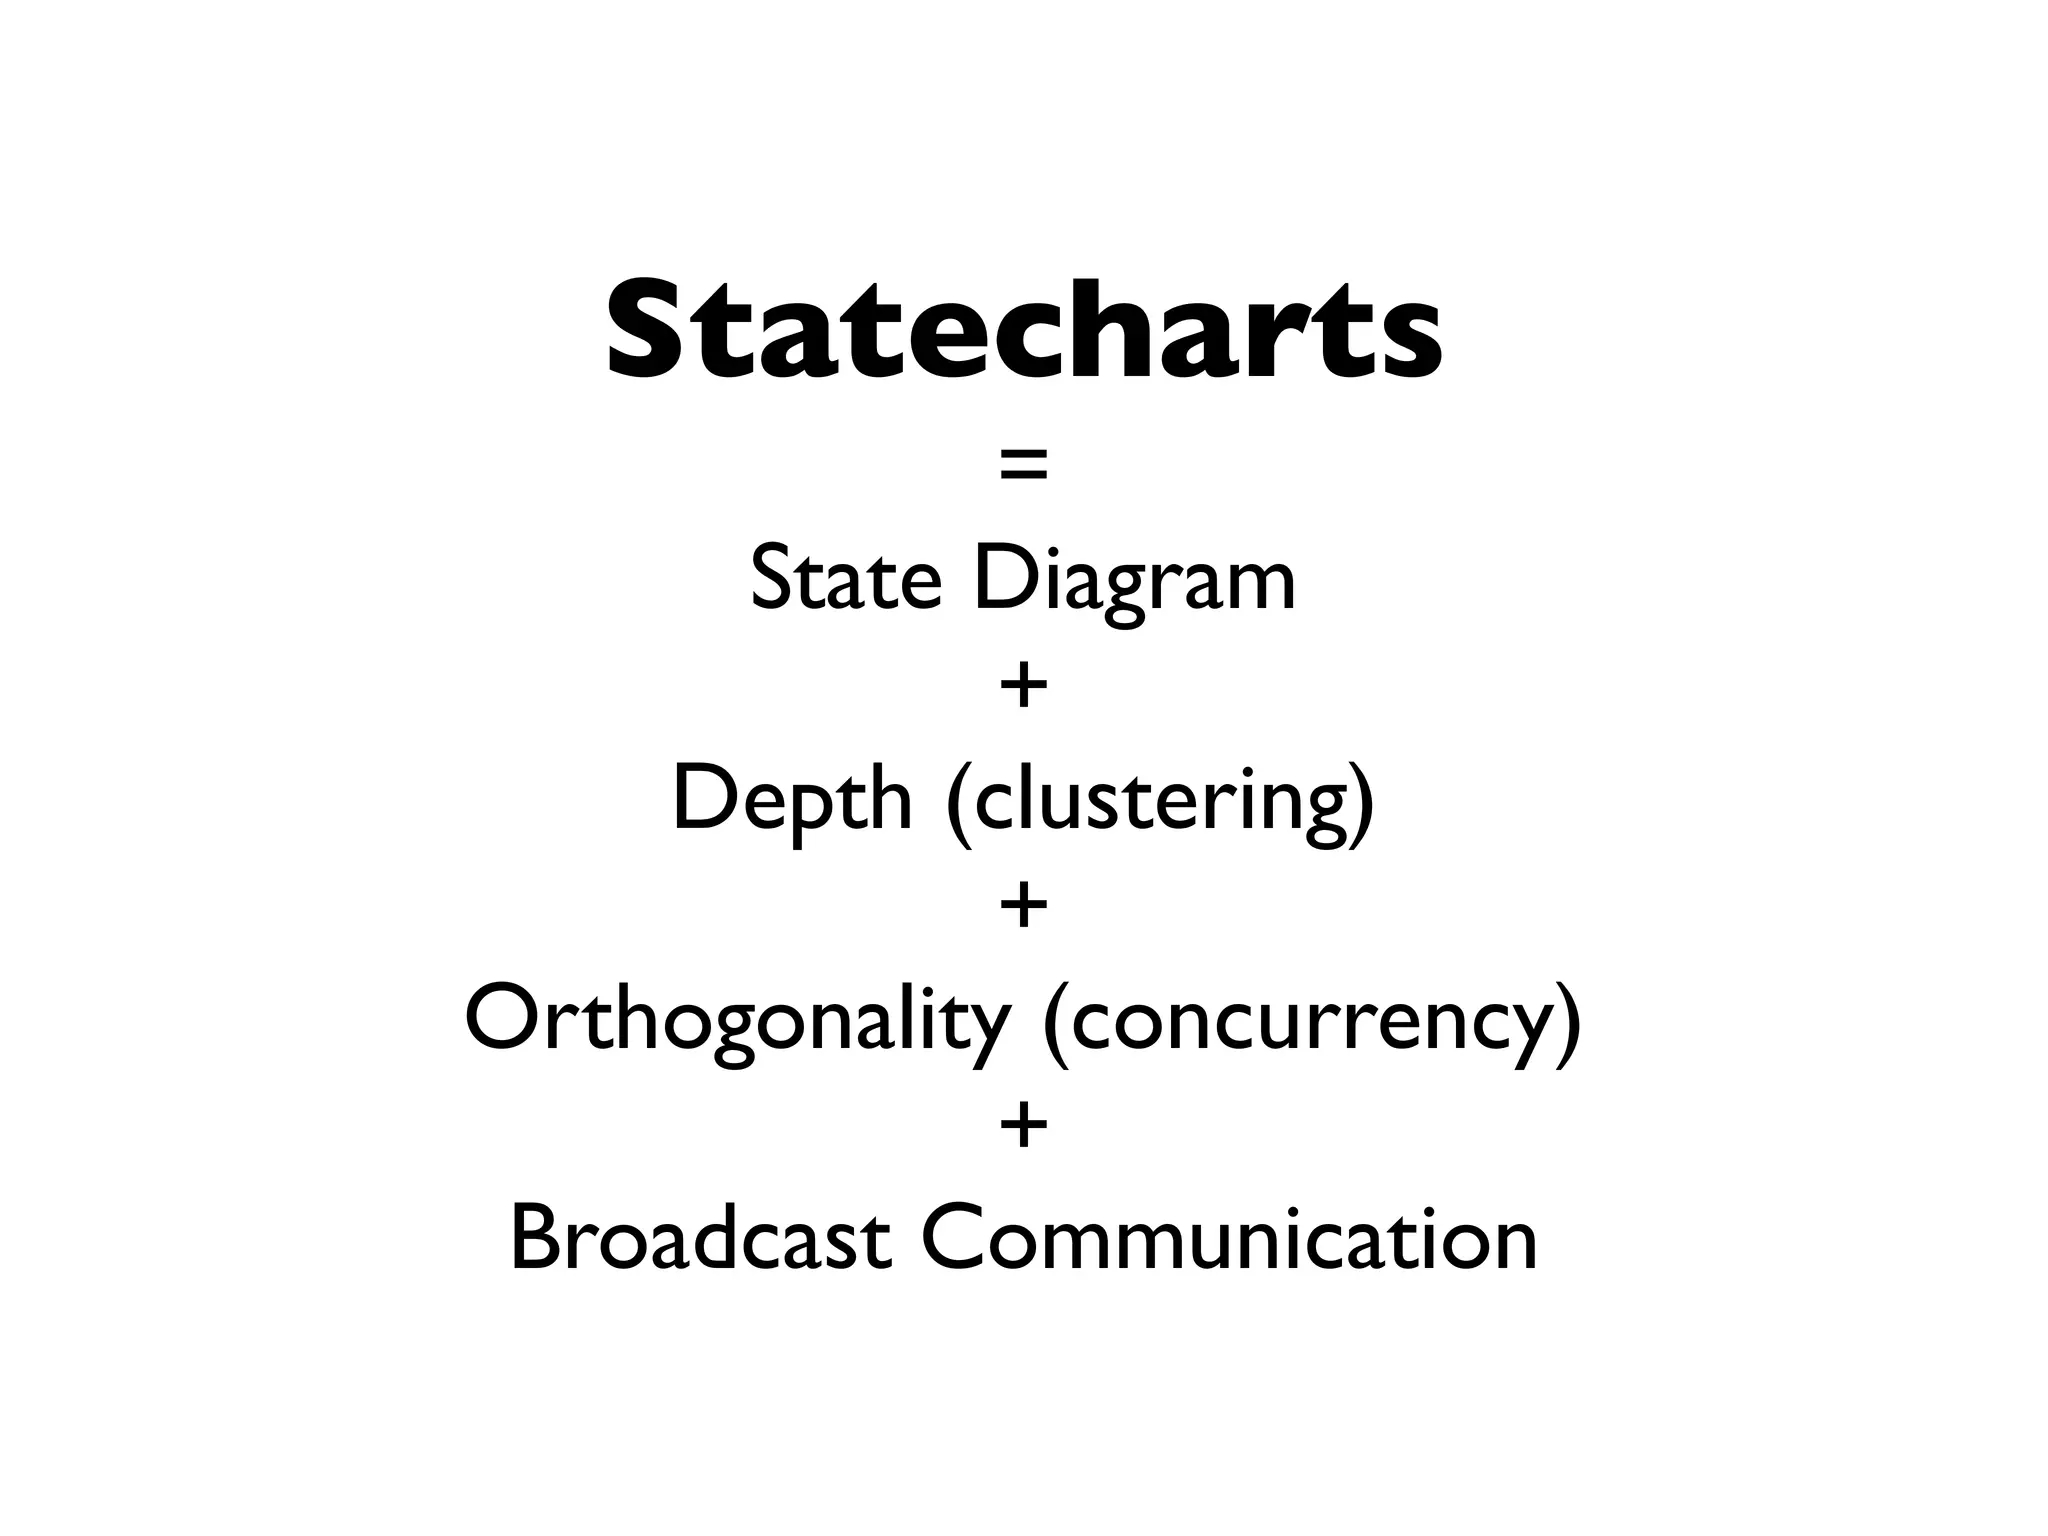
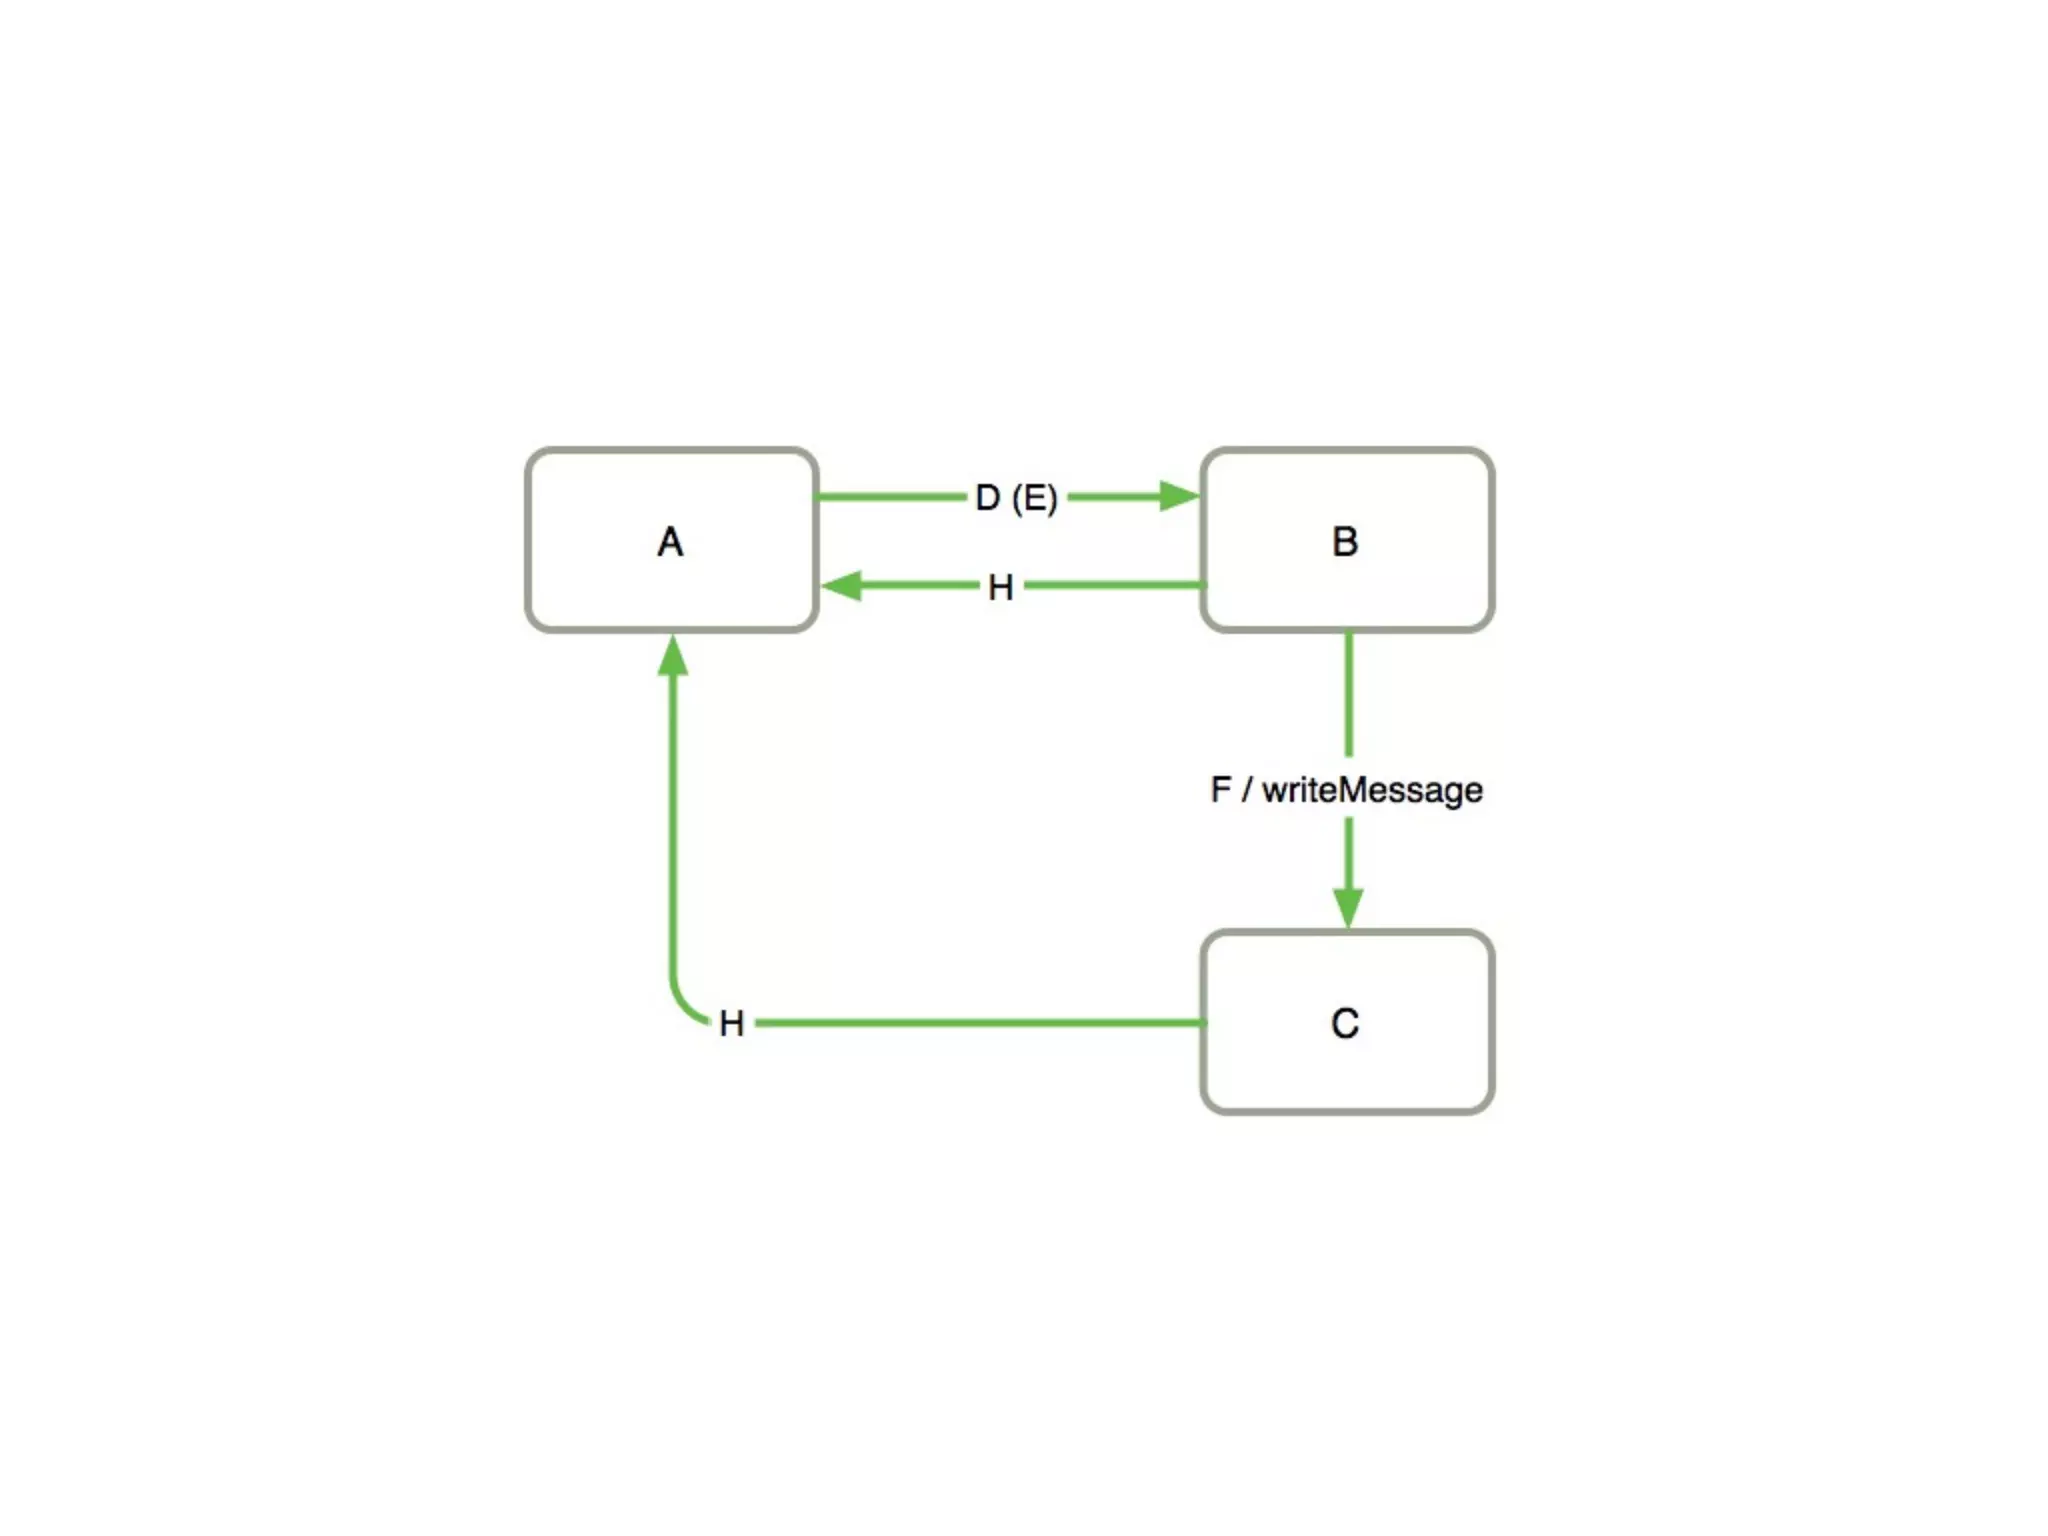
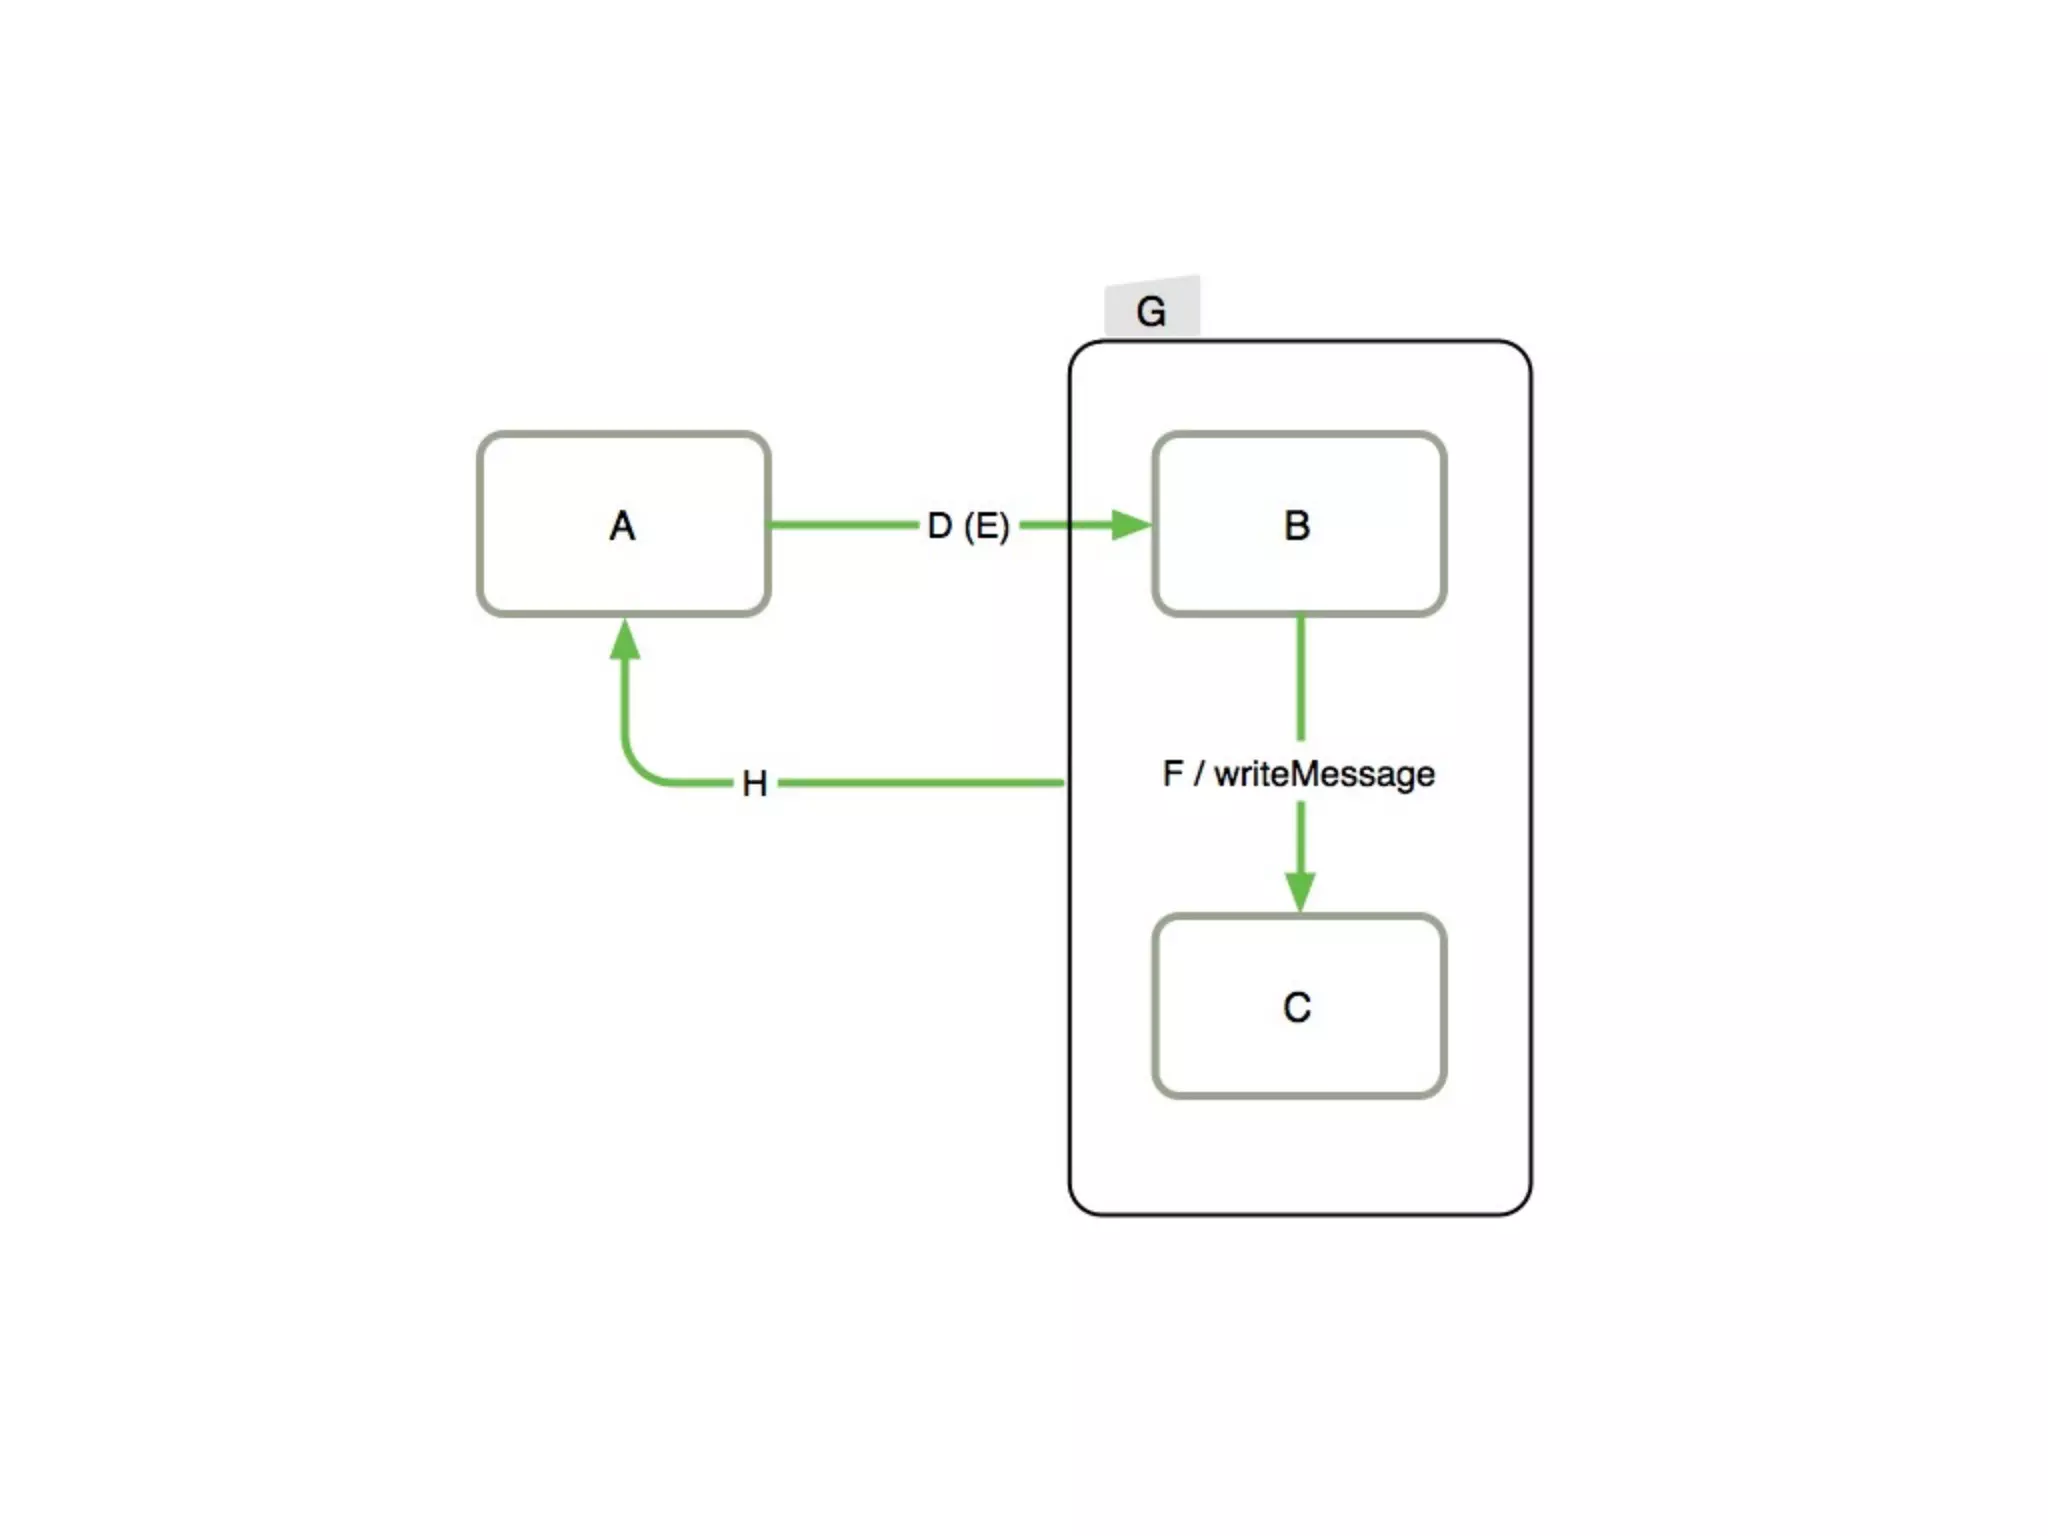
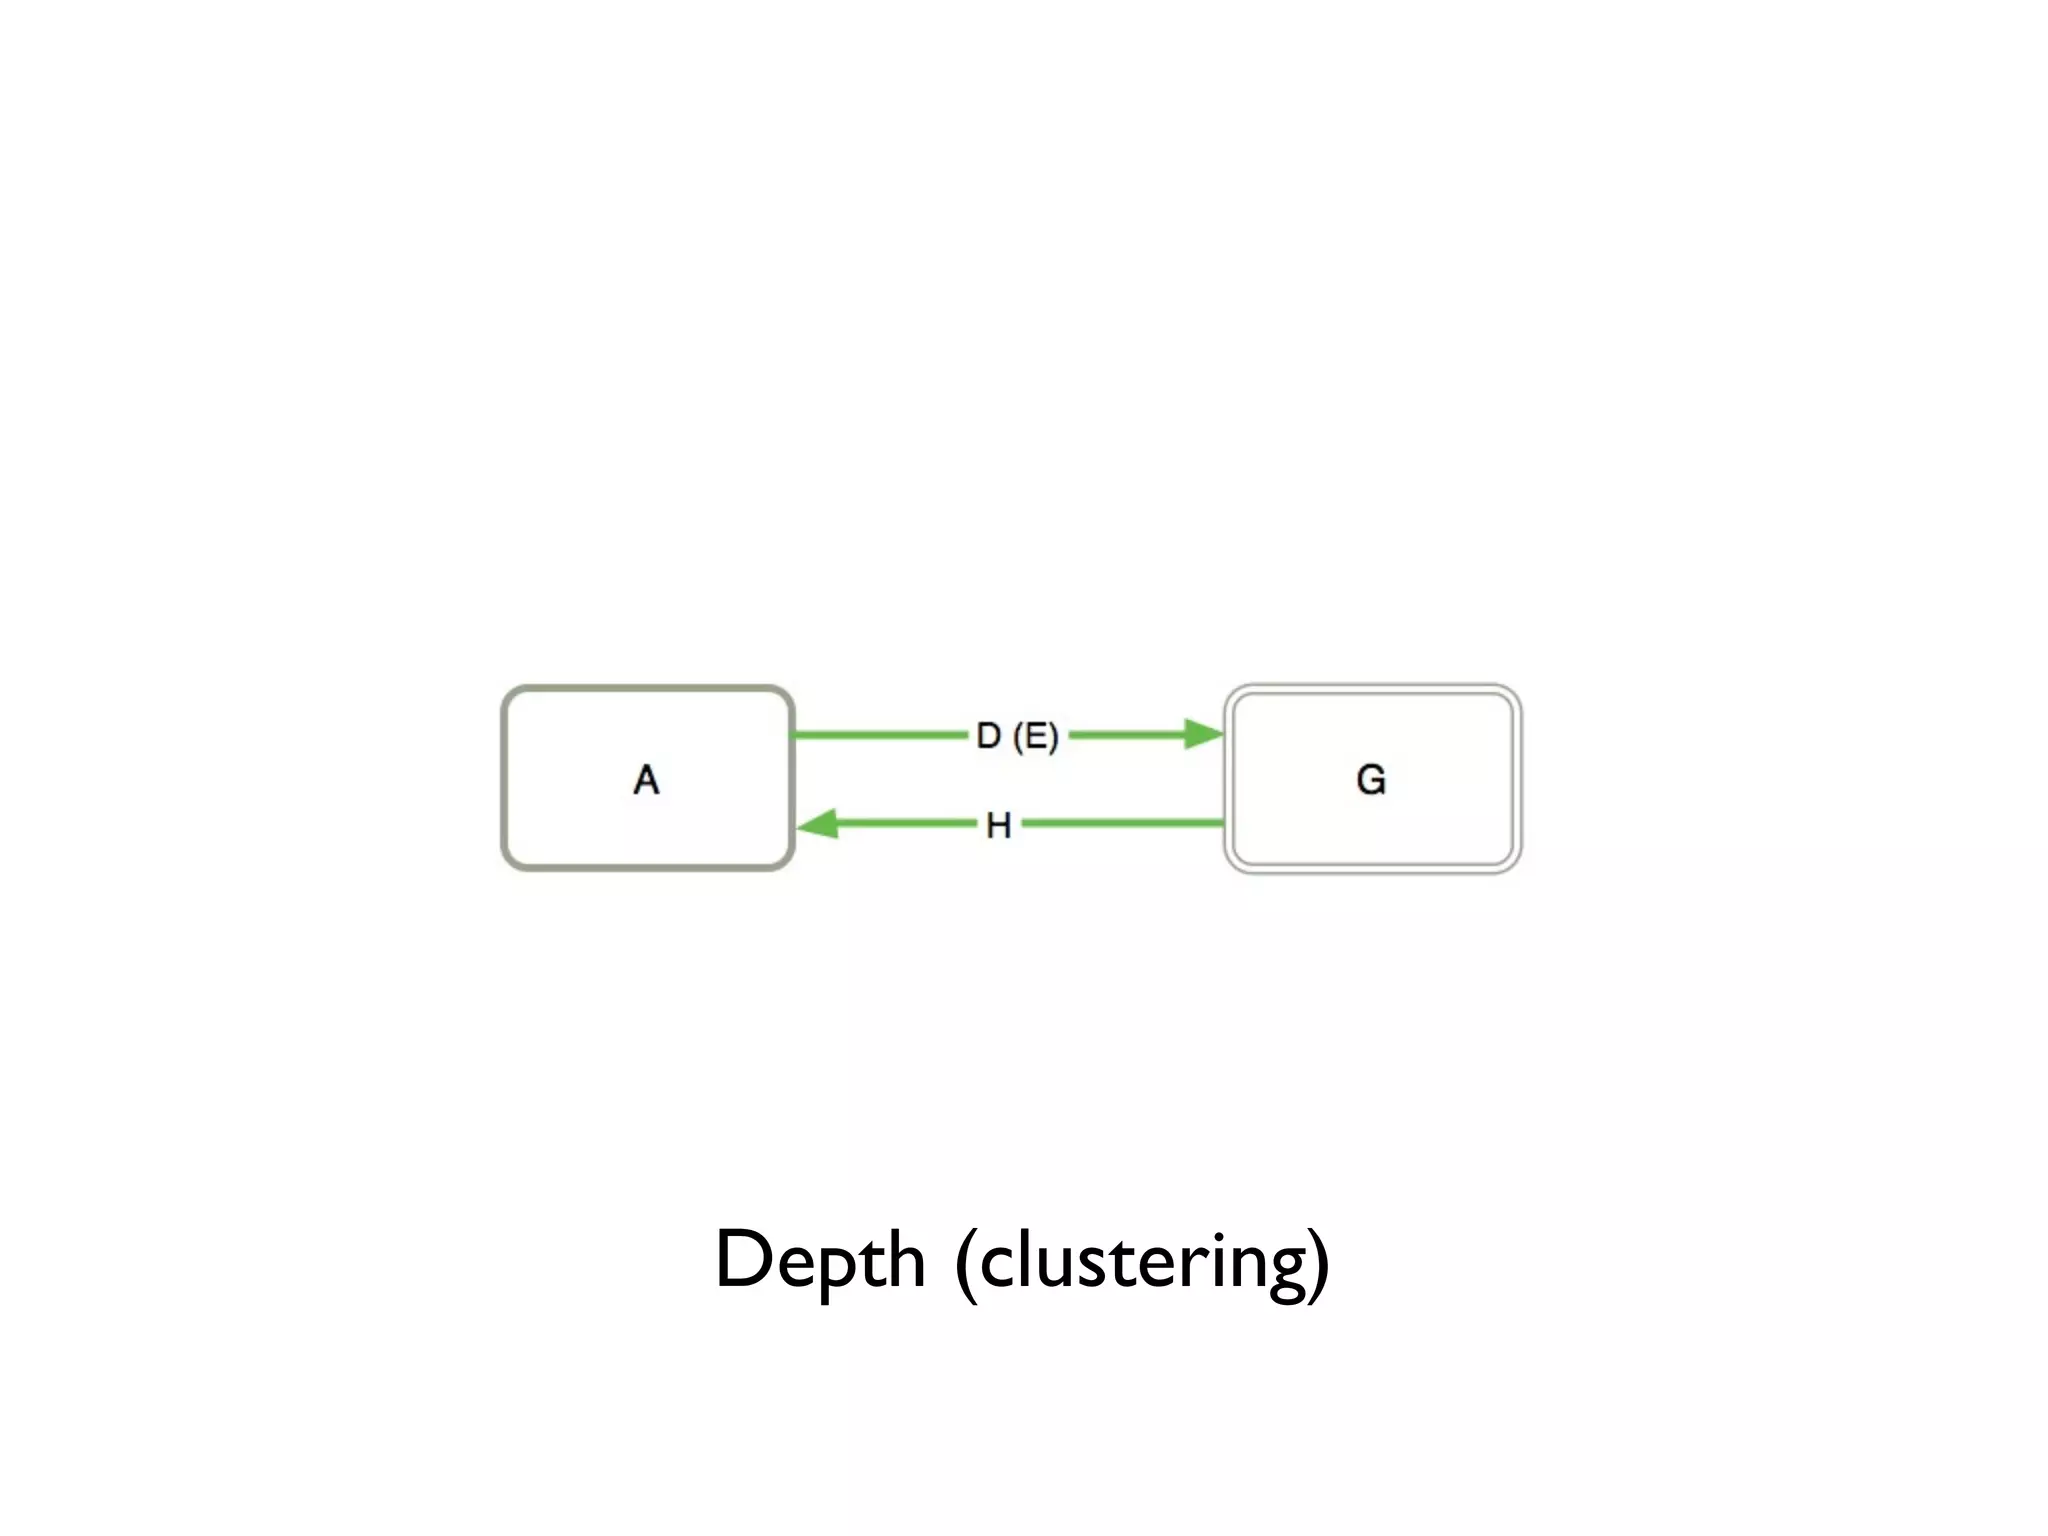
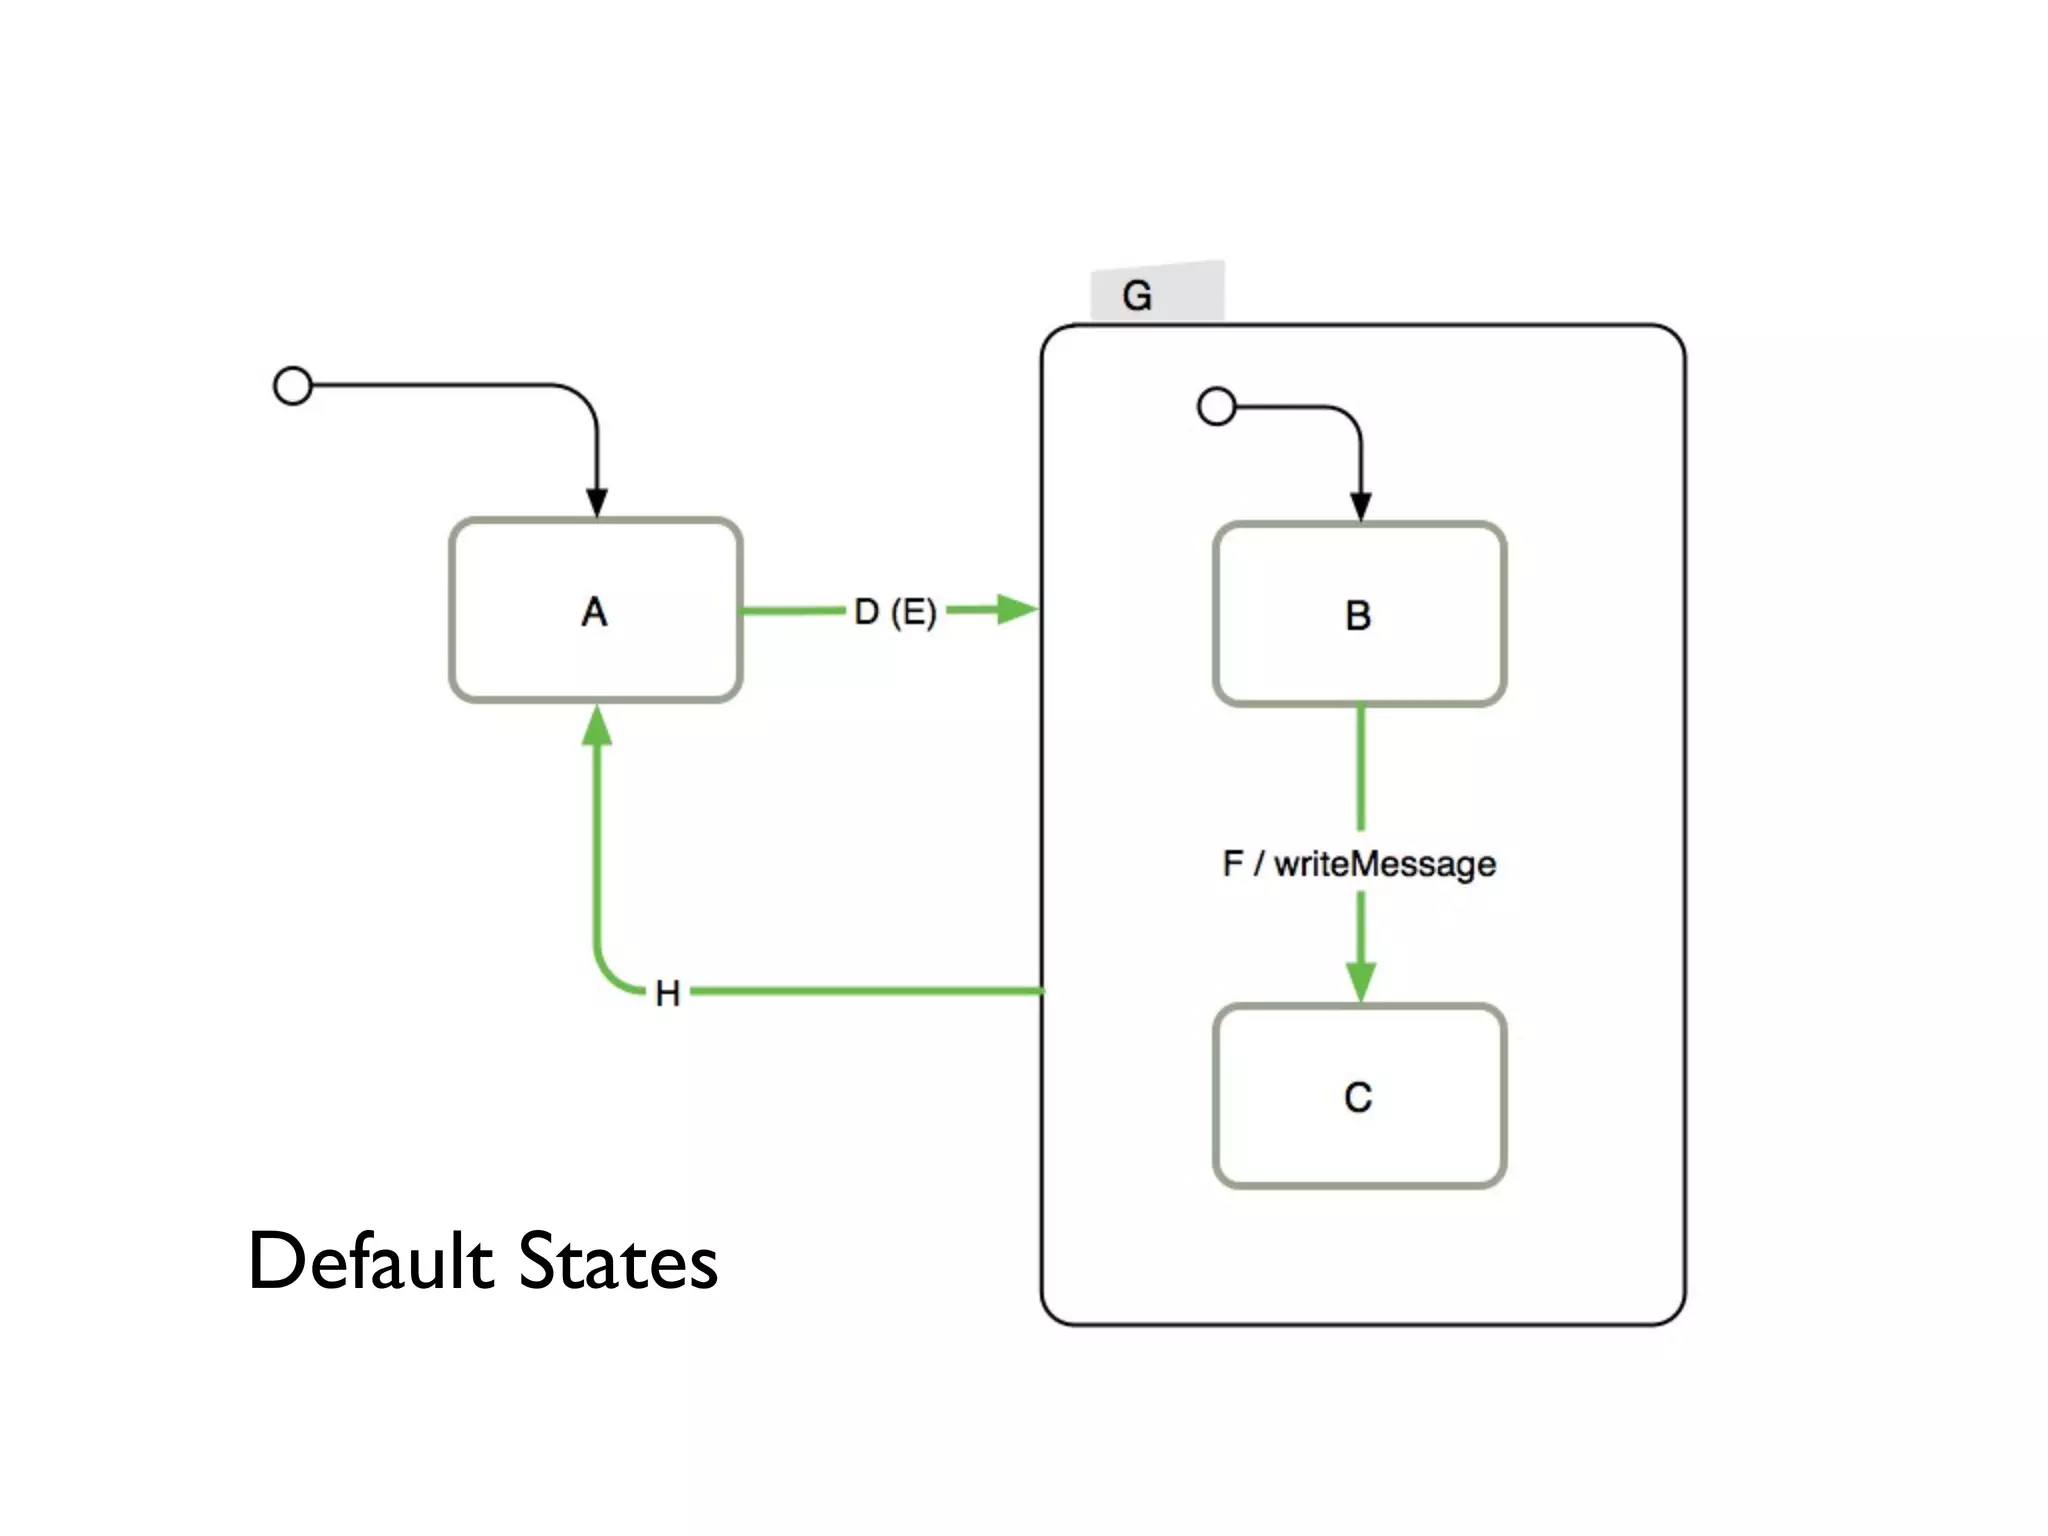
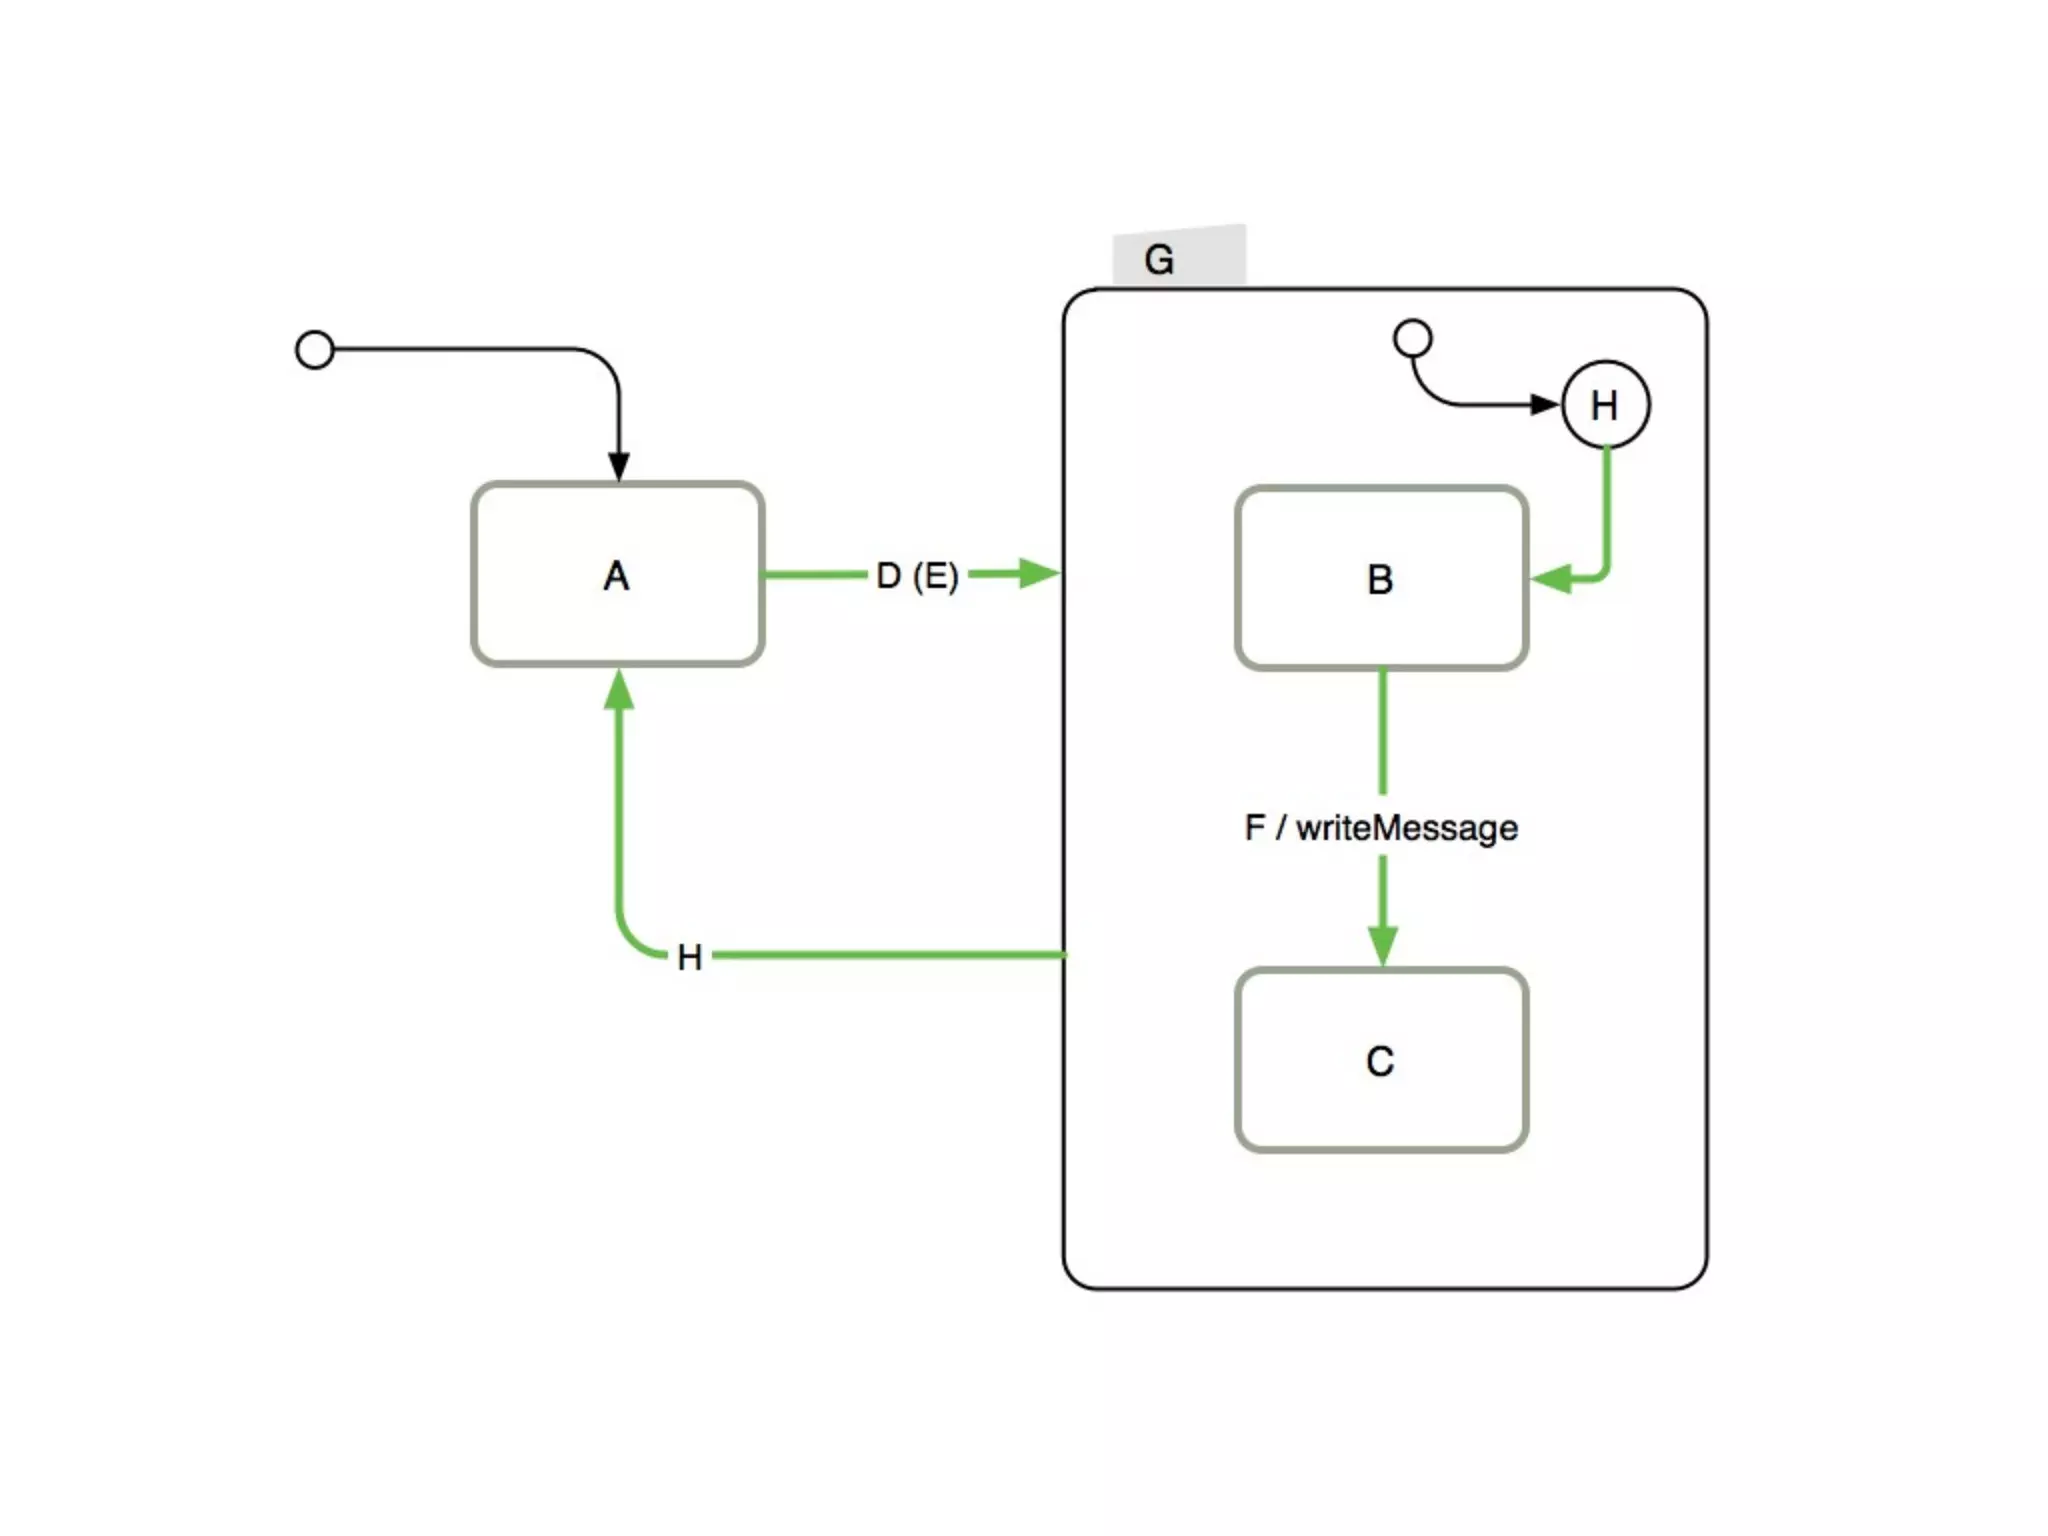
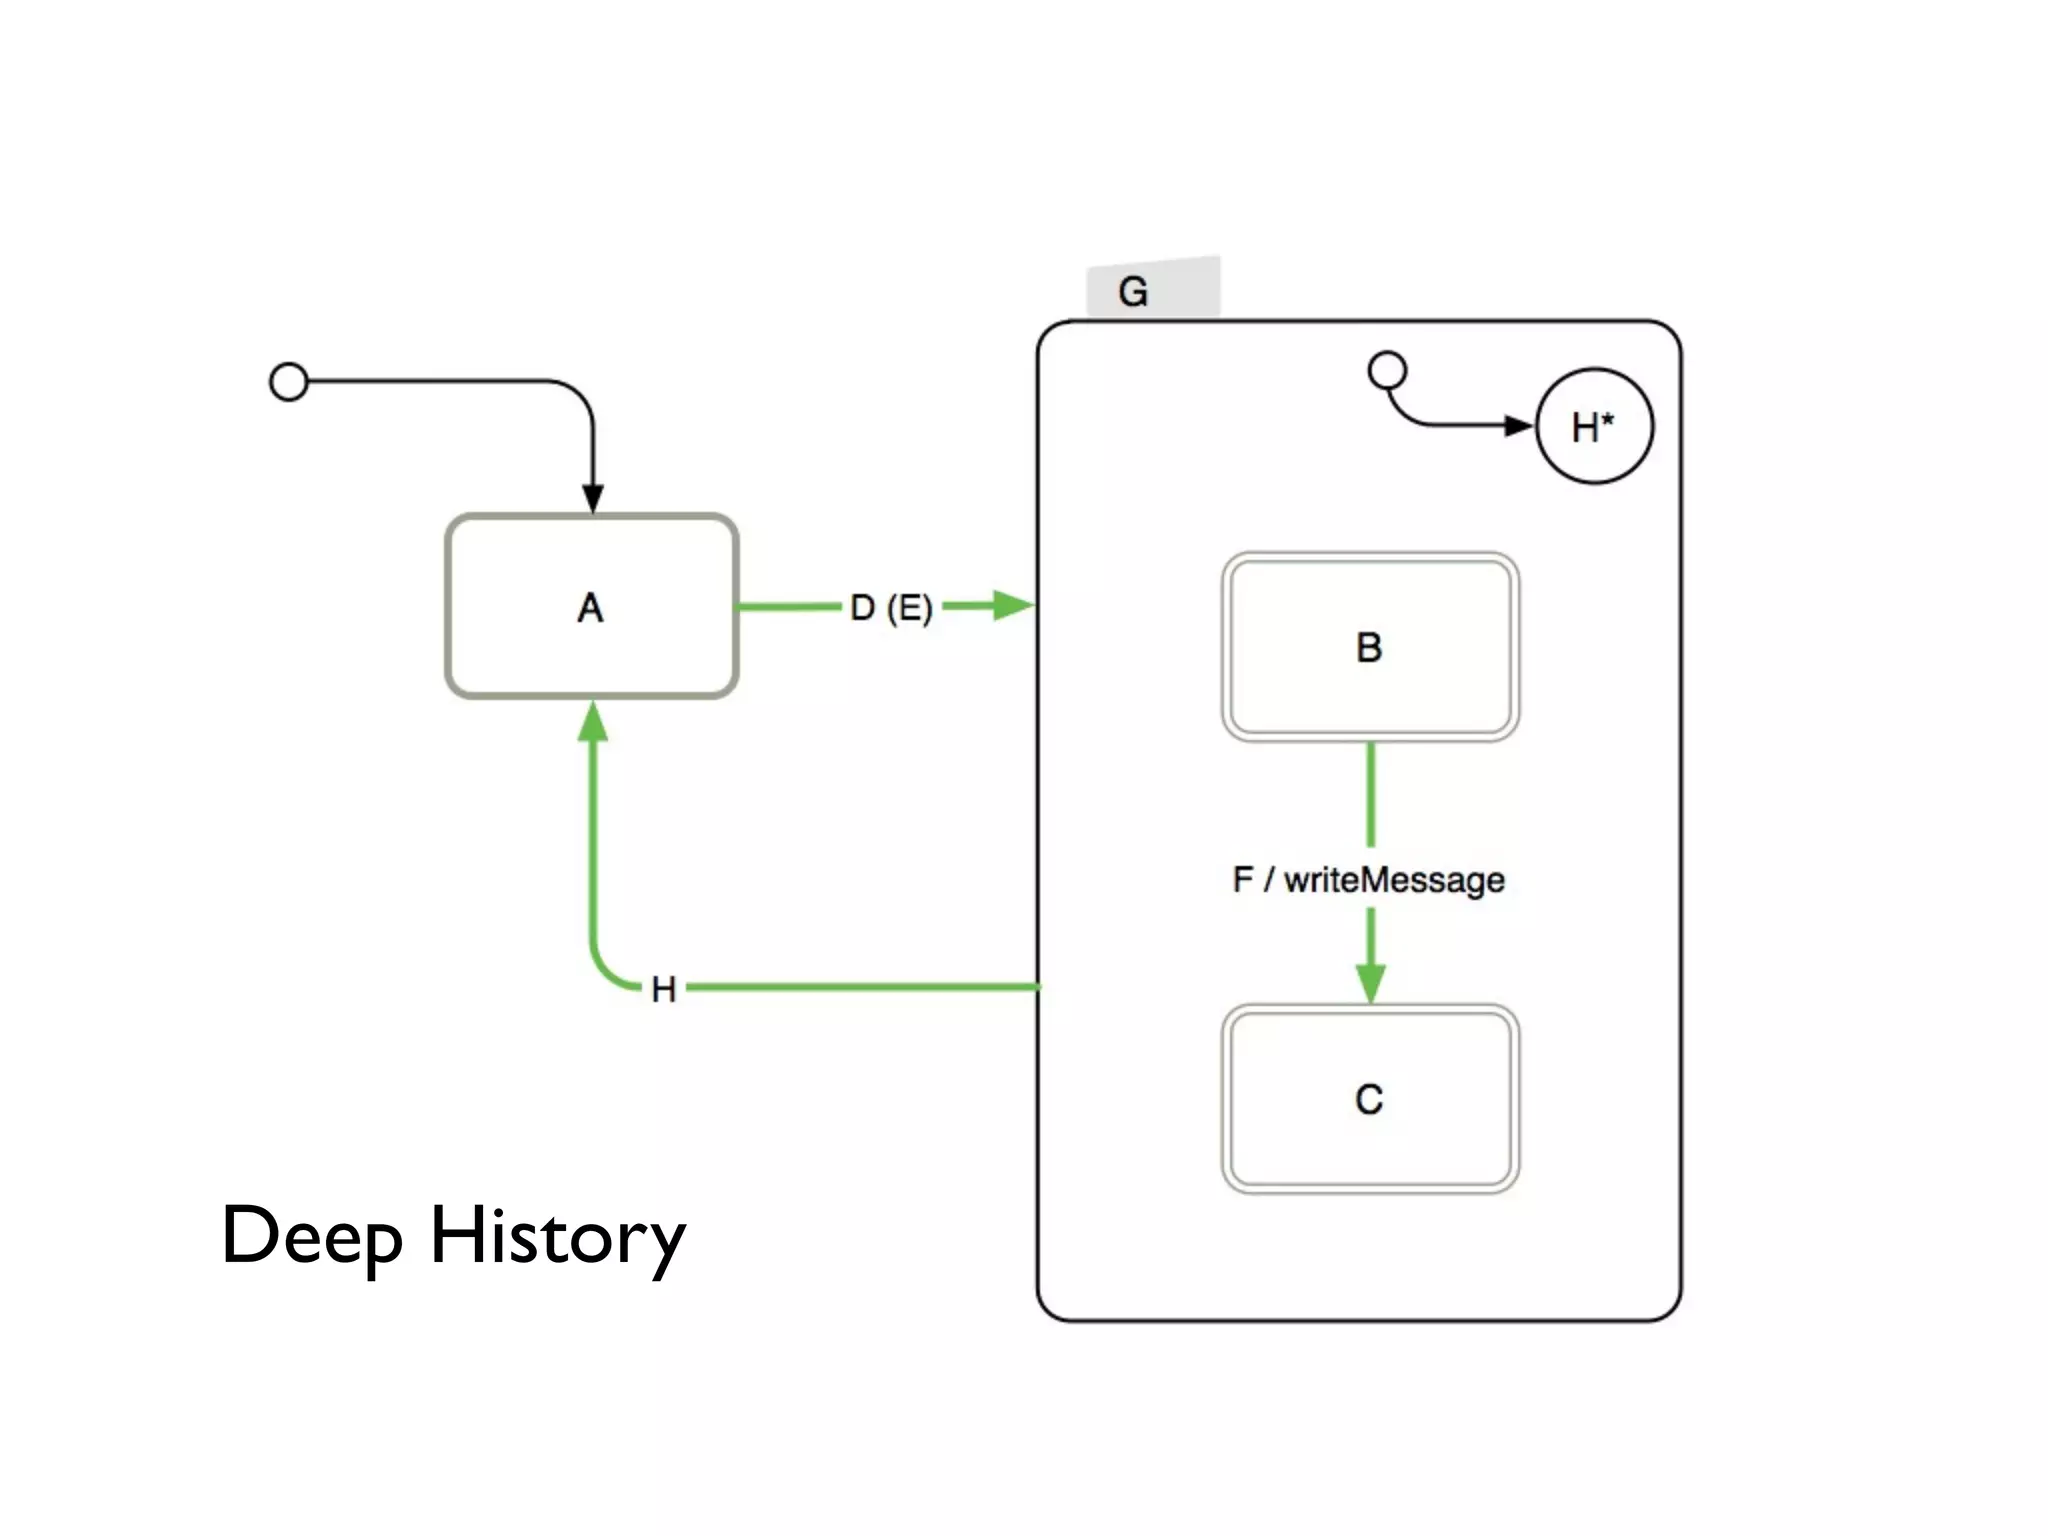
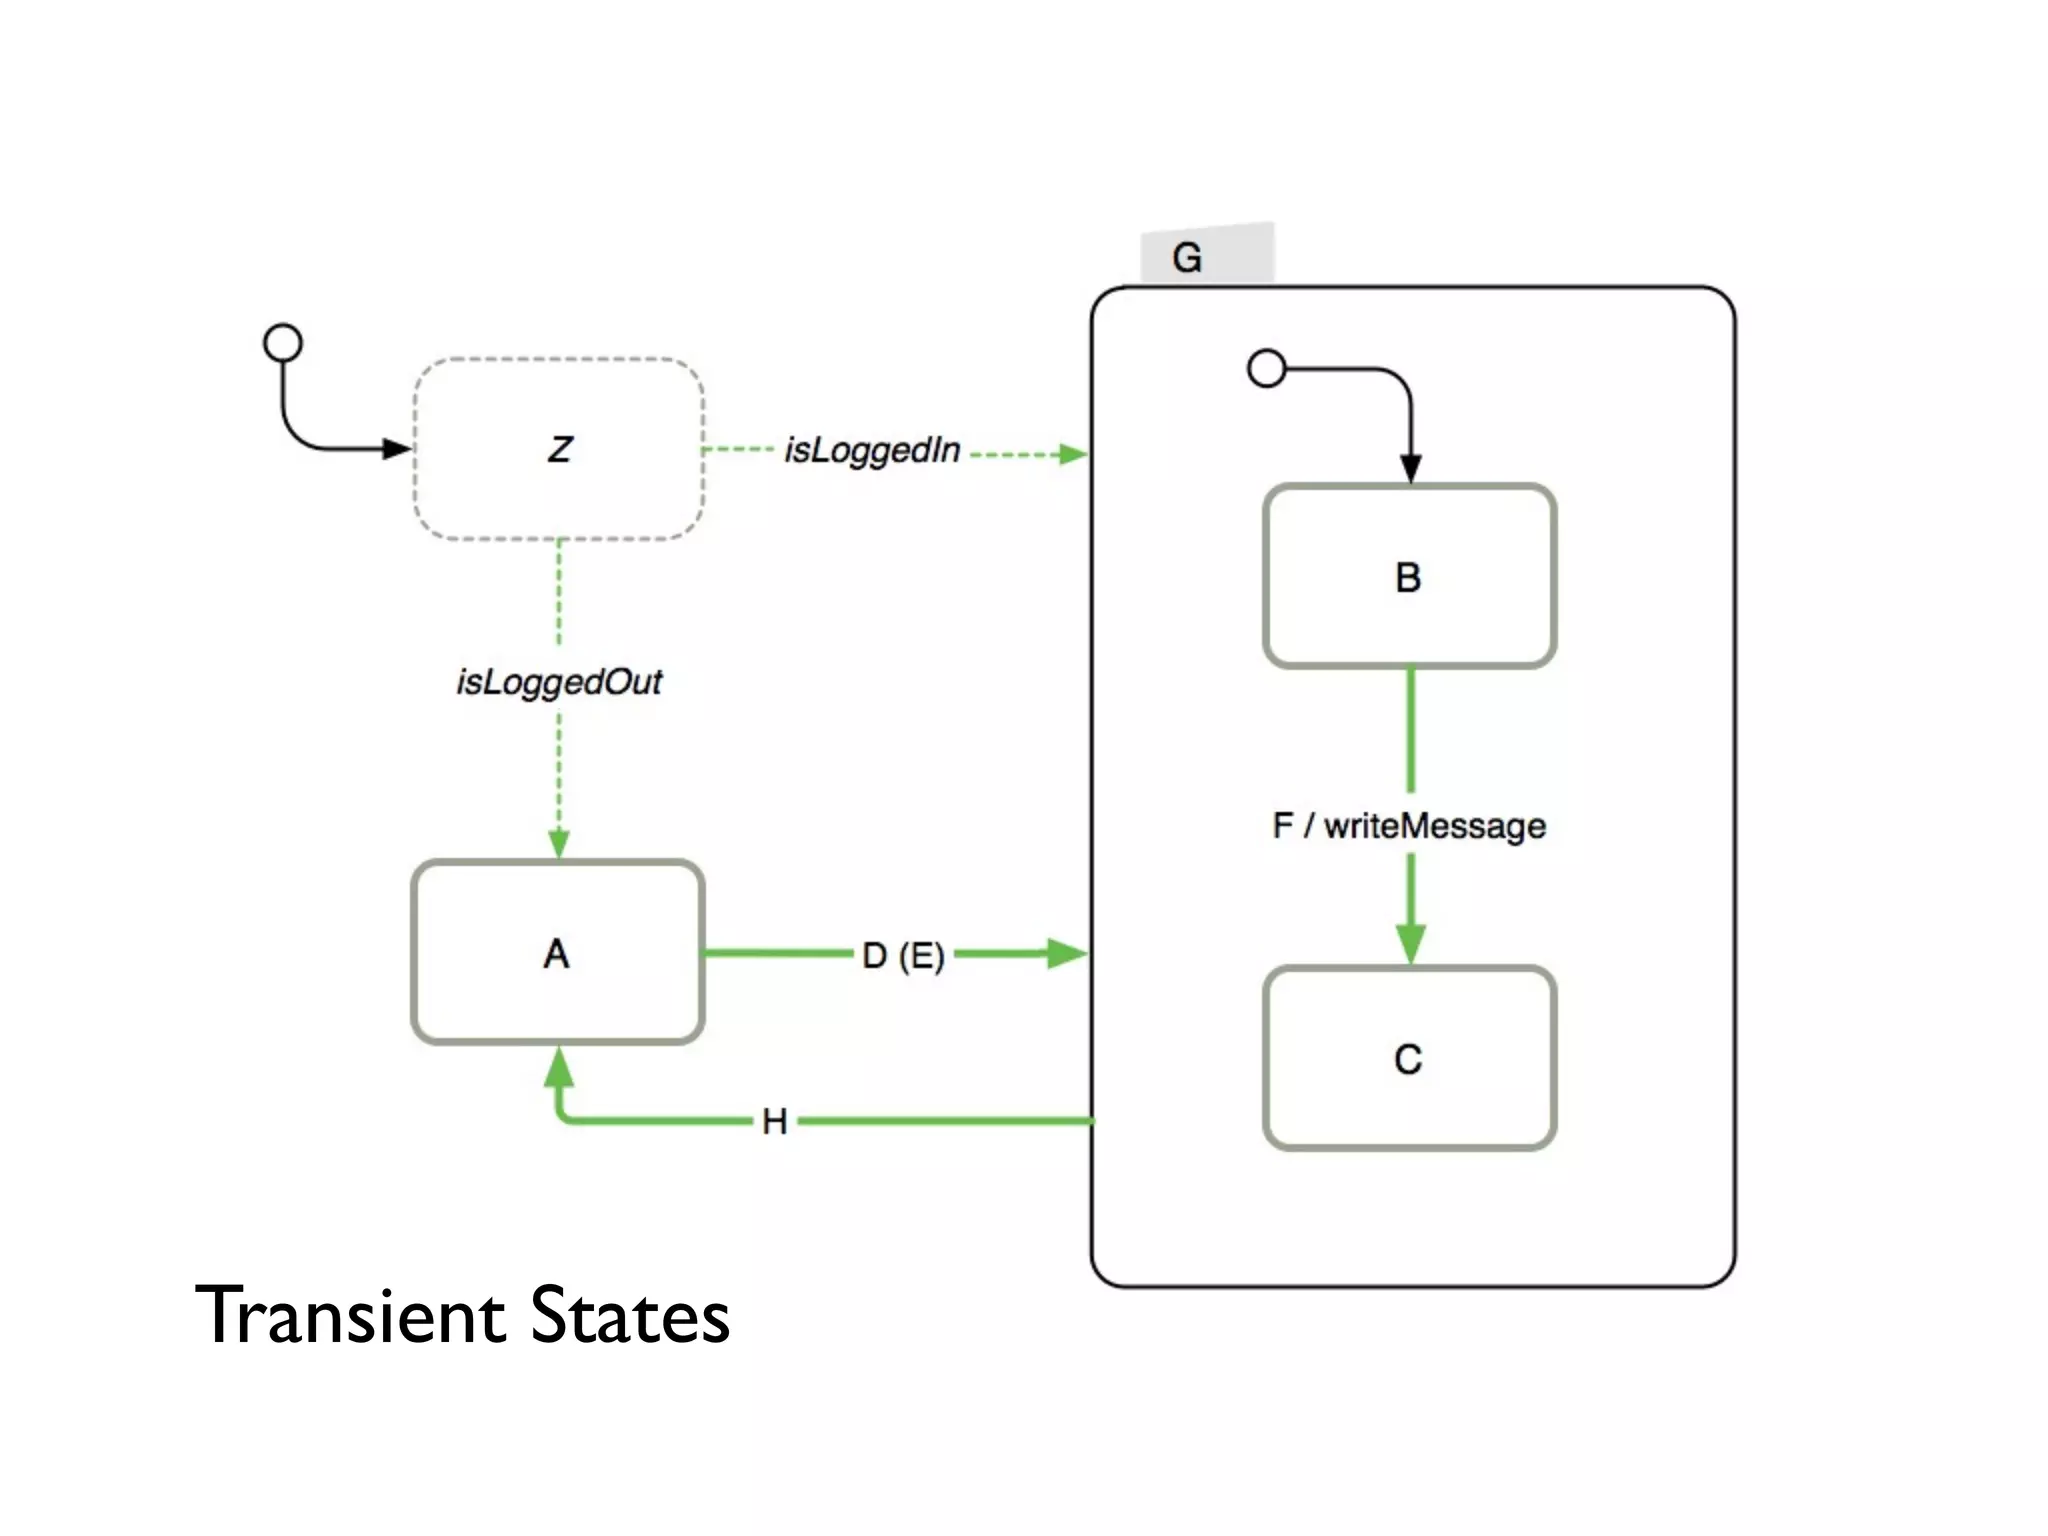
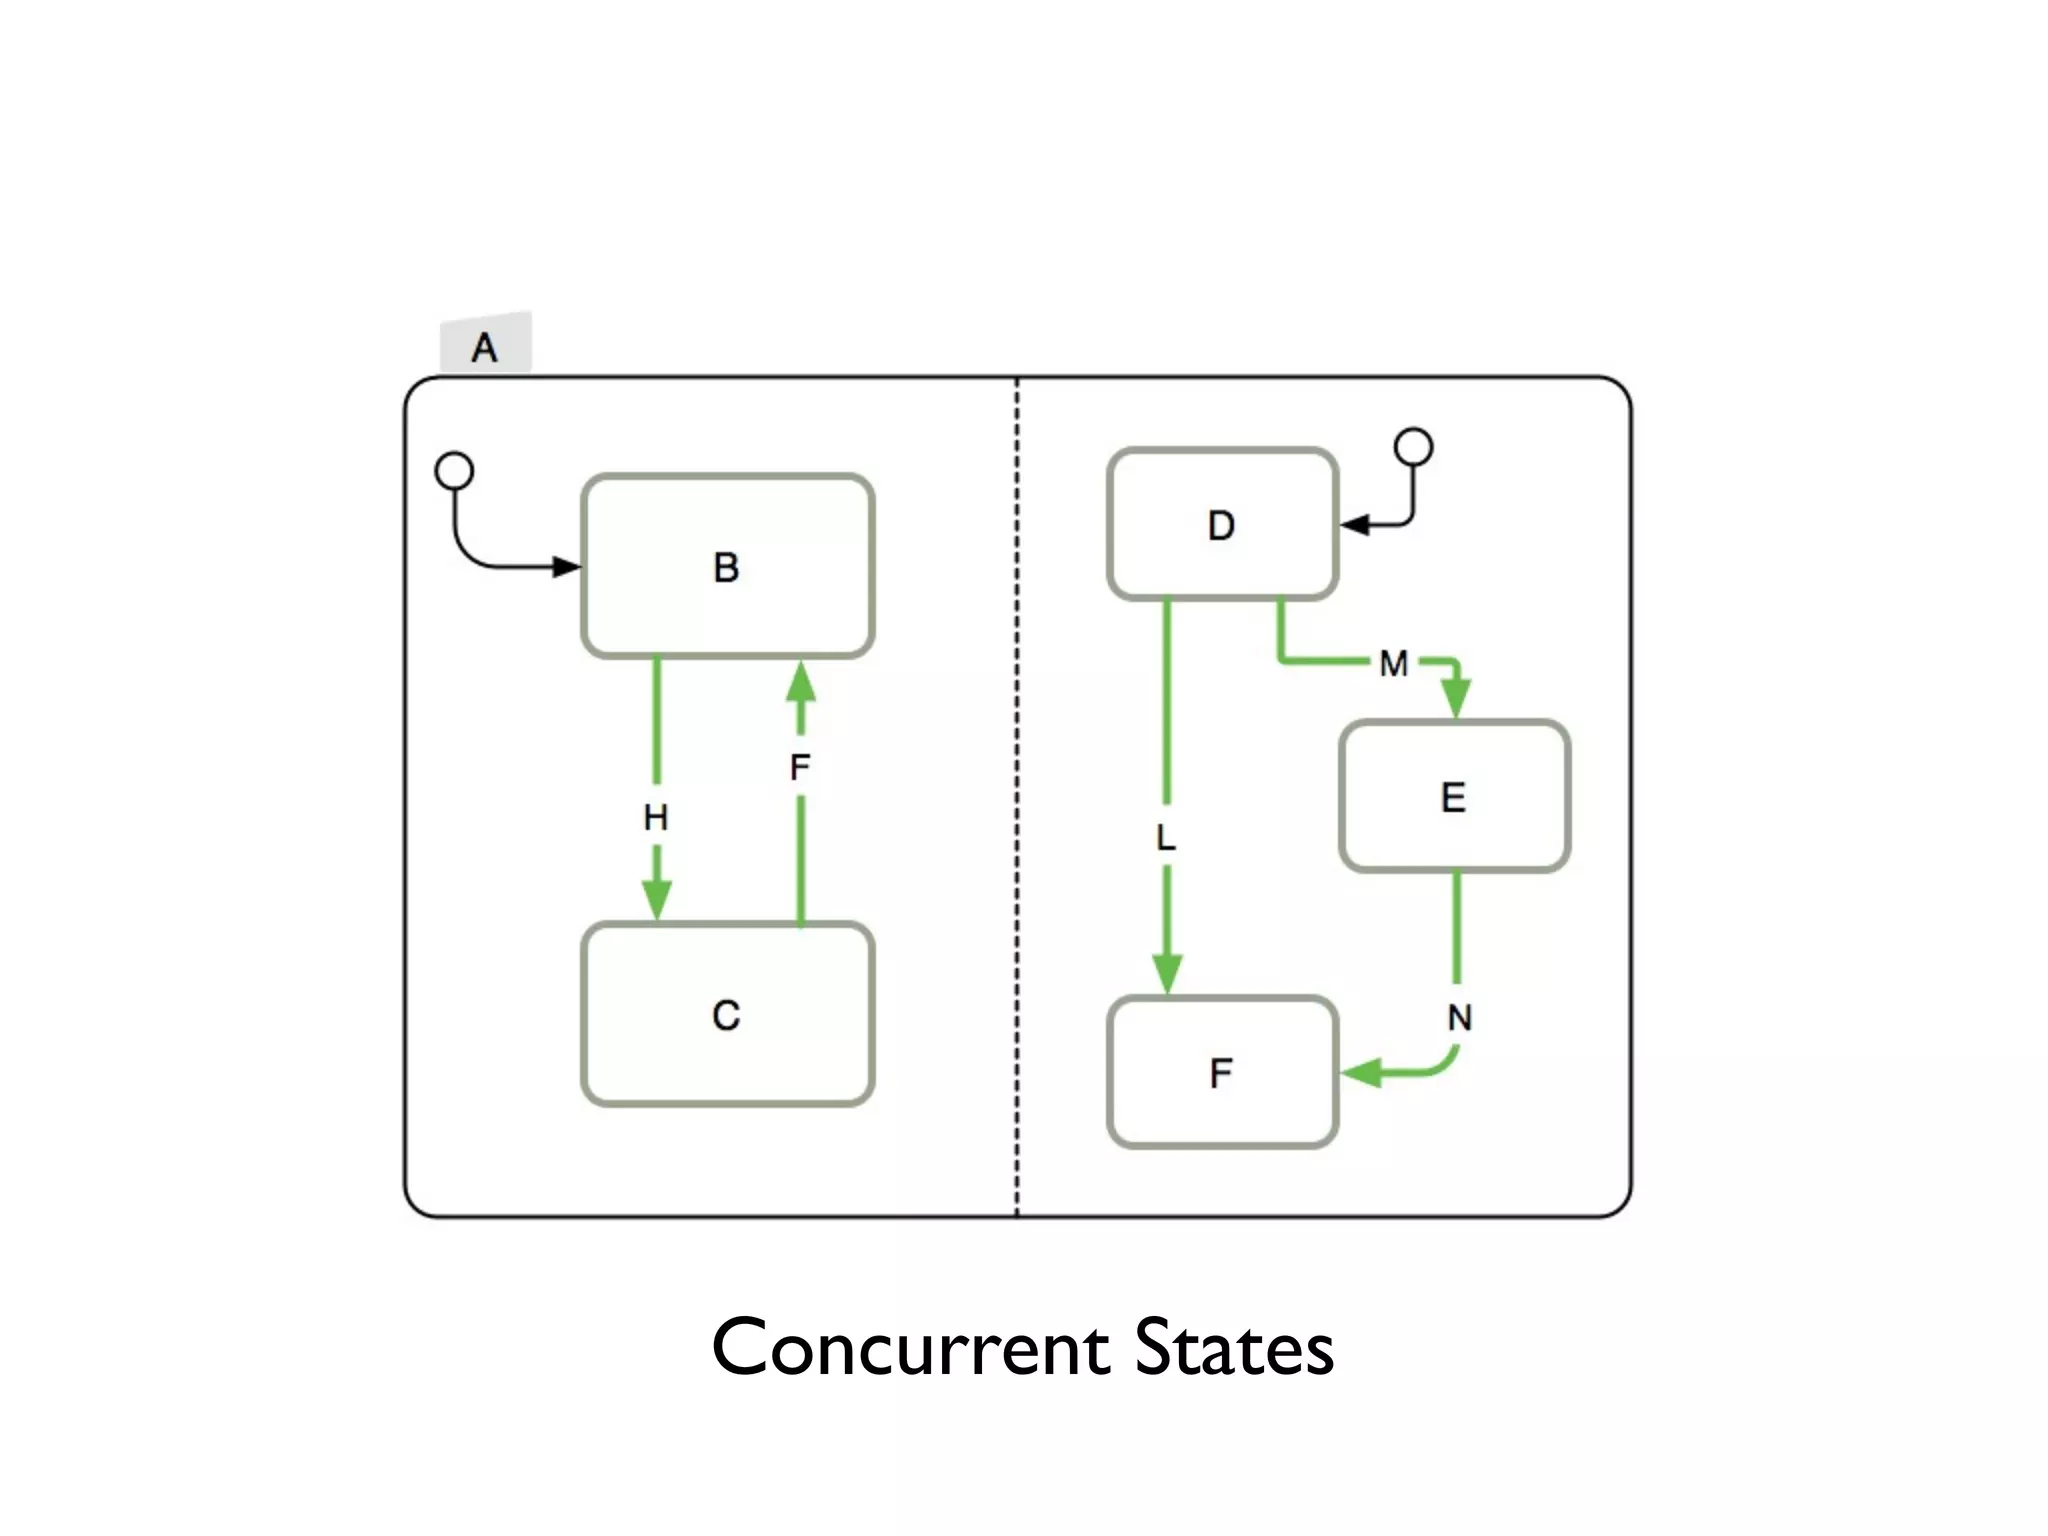
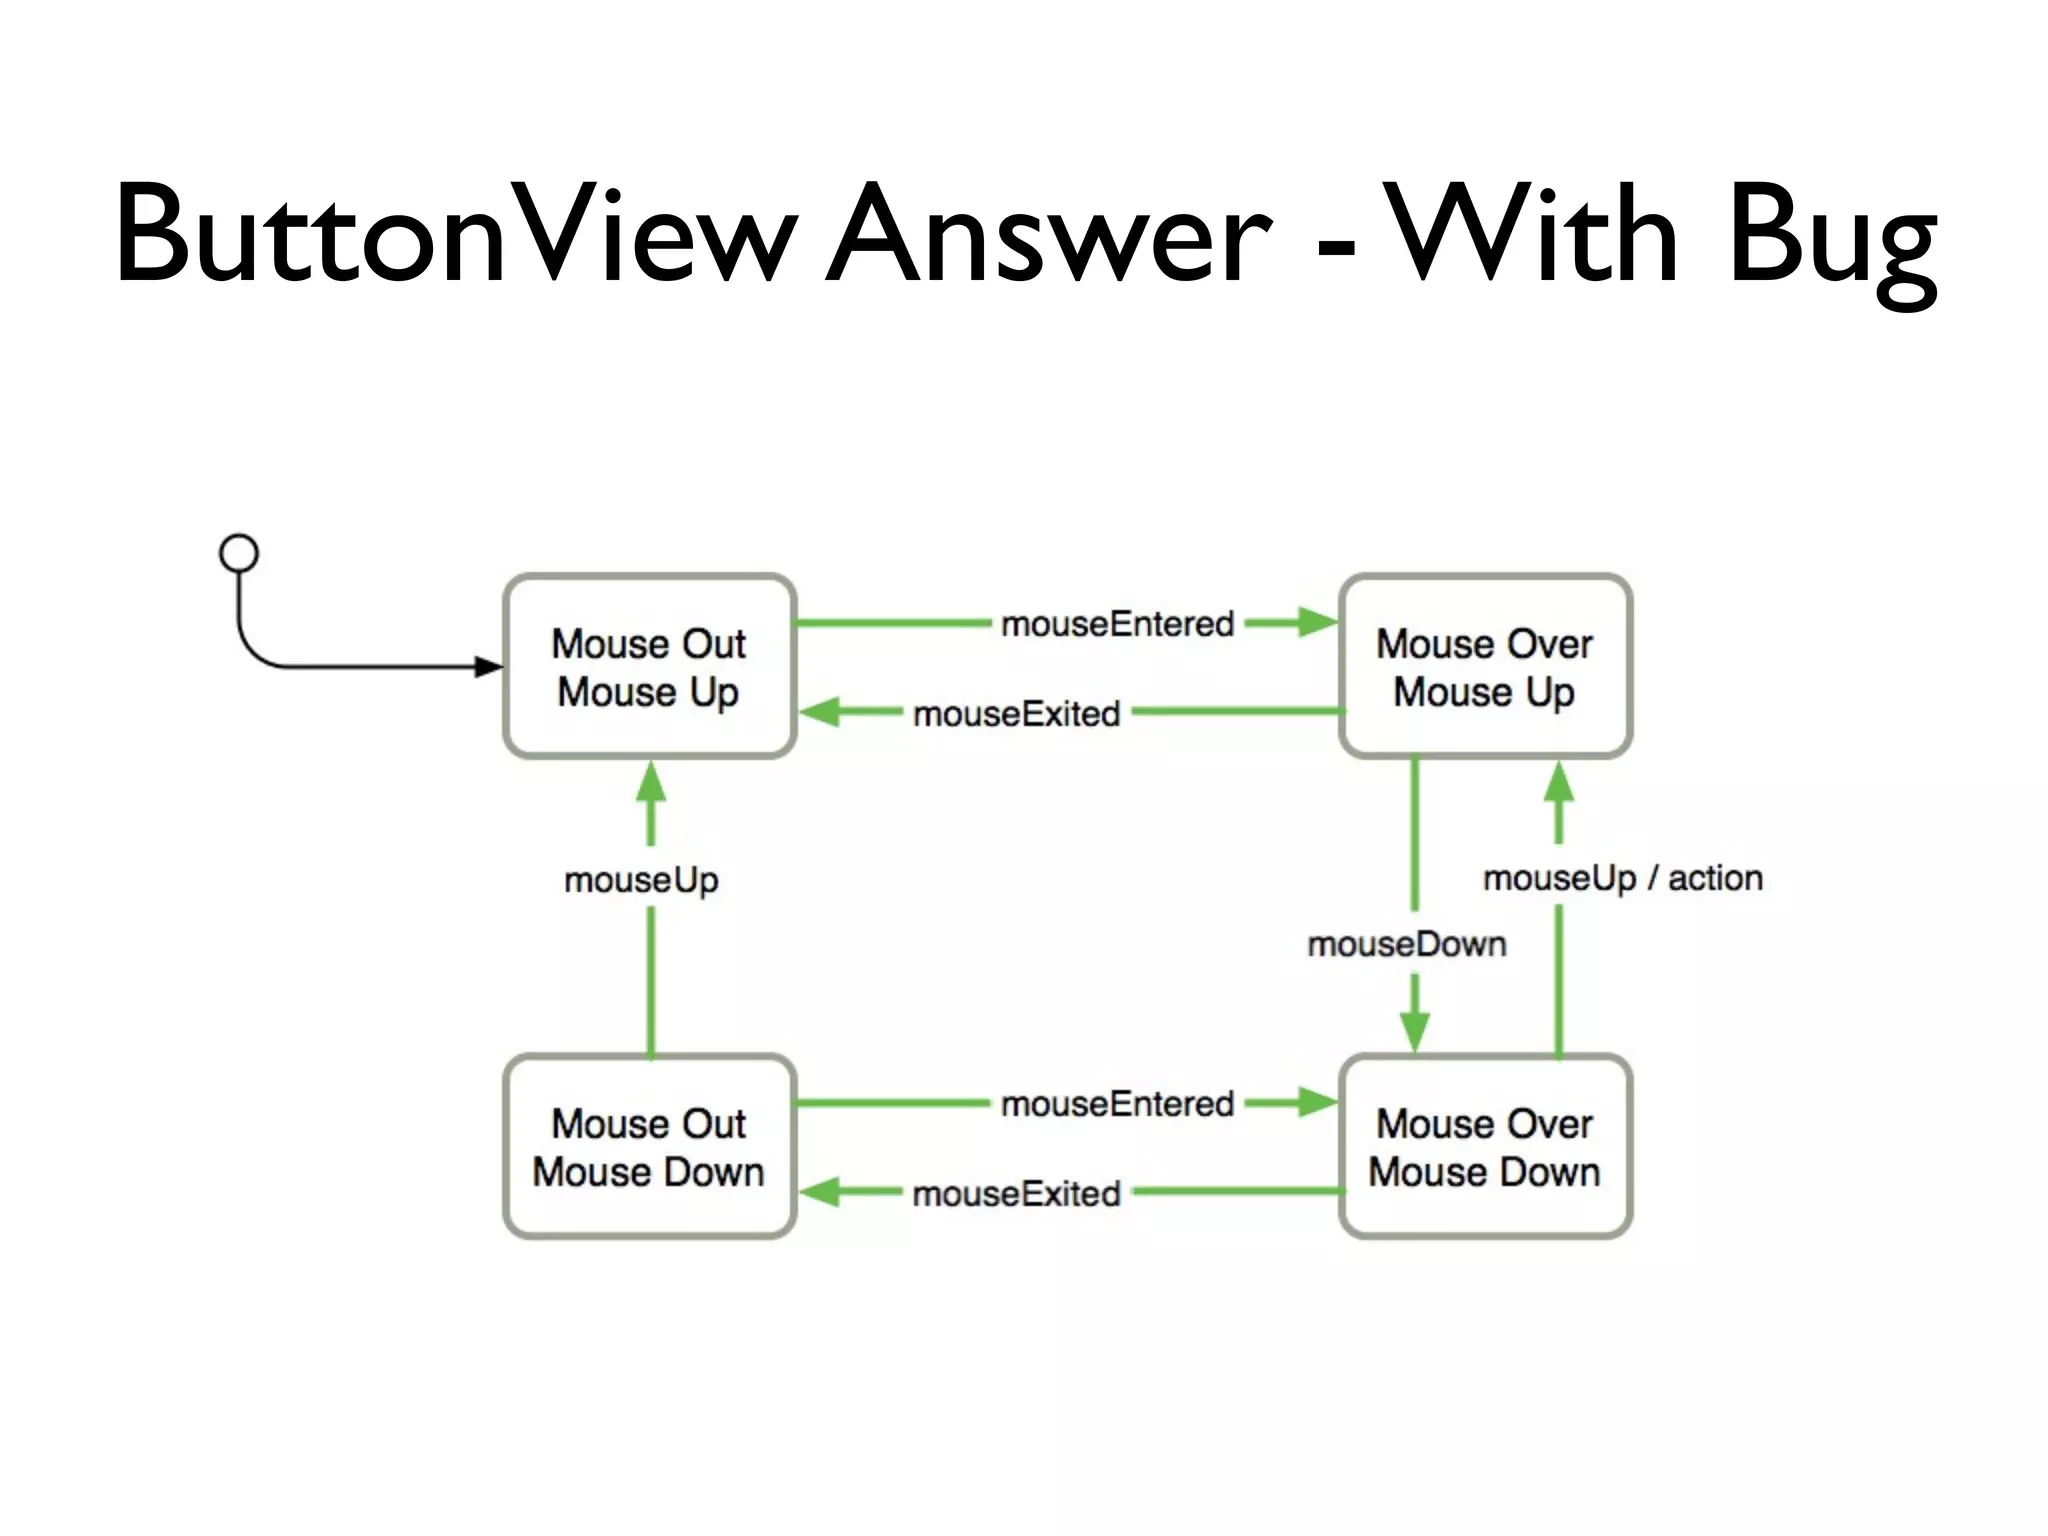
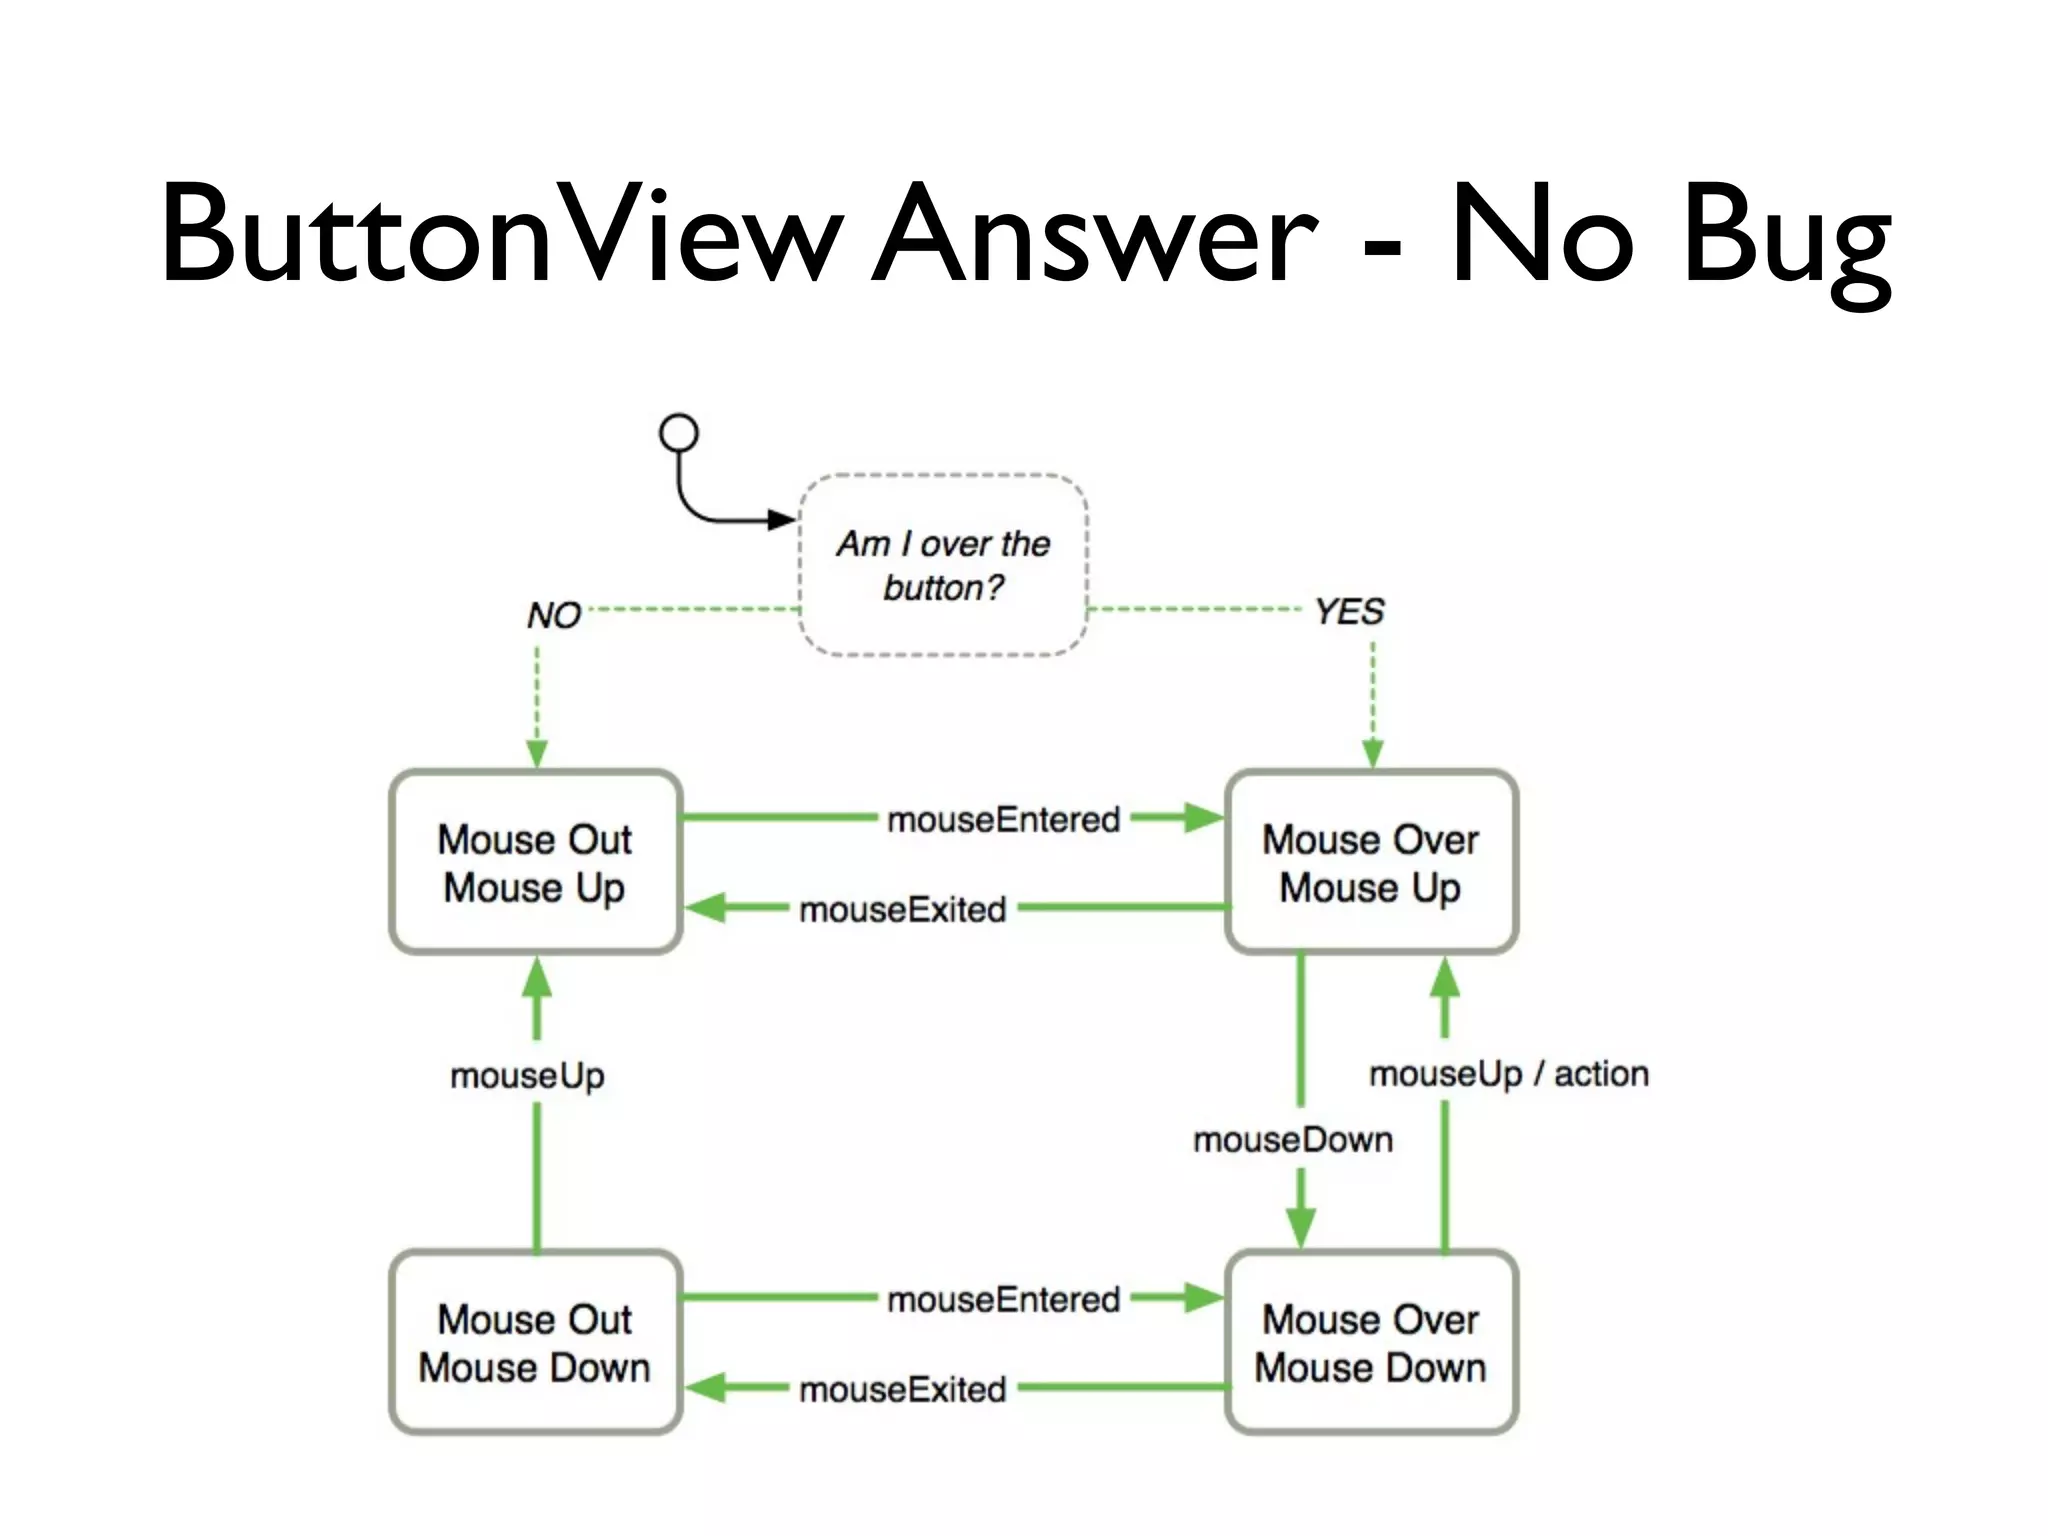
SlideShare a Scribd company logo
Statecharts with
    Stativus
          Luc Castera
  http://about.me/luc.castera
Initiation

Requirements

 Specification

    Design       }   Statecharts


Implementation

    Testing

 Maintenance
Transformational Systems

   f(input) = output
Reactive Systems
                        event-driven

continuously having to react to external and internal stimuli
Javascript
“The literature on software and systems
      engineering is almost unanimous in
recognizing the existence of a major problem
 in the specification and design of large scale
        and complex reactive systems.”
     -- David Harel, Statecharts: A Visual Formalism For Complex Systems, 1987
Statecharts ?
Statecharts
             =
      State Diagram
             +
    Depth (clustering)
             +
Orthogonality (concurrency)
             +
 Broadcast Communication
Statecharts 101
Internal Events
Depth (clustering)
Default States
History
Deep History
Transient States
Concurrent States
Examples
Your App Without Statecharts
Button View Exercise
Exercise: create a statechart that models the behavior of a button view:
1. action fires on mouseUp event only if the mouse is over the button
2. when the mouse is over the button, it should show a hover image


                             Events:
                           mouseEntered
                           mouseExited
                           mouseDown
                            mouseUp
                           mouseMoved
ButtonView Answer - With Bug
ButtonView Answer - No Bug
Why use Statecharts?
Documentation
Communication
Think Ahead
Stable
Testing
Stativus
Initiation

Requirements

 Specification

    Design

Implementation   }   Stativus

    Testing

 Maintenance
http://github.com/dambalah/stativus-button
Tips & Tricks
“path independence”
   no logic in enterState
Testing using spreadsheets
         From Erich Ocean
Testing using spreadsheets
Resources
•   Statecharts: A Visual Formalism For Complex Systems, David Harel
•   Constructing the User Interface with Statecharts, Ian Horrocks
•   Practical UML Statecharts in C/C++, Miro Samek
•   Erich Ocean Sproutcore Training, http://erichocean.com/training/app.html, US
    $99
•   Ki Documentation: https://github.com/frozencanuck/ki
•   Stativus website: http://stativ.us/
•   Statecharts in the Making: a Personal Account, David Harel
•   Stativus on github: https://github.com/etgryphon/stativus
•   Omnigraffle to draw the statecharts
•   NI LabView Statecharts: http://www.ni.com/white-paper/6194/en & http://
    www.ni.com/white-paper/7413/en

More Related Content

Similar to Statecharts with Stativus

SERENE 2014 School: Resilience in Cyber-Physical Systems: Challenges and Oppo...
SERENE 2014 School: Resilience in Cyber-Physical Systems: Challenges and Oppo...SERENE 2014 School: Resilience in Cyber-Physical Systems: Challenges and Oppo...
SERENE 2014 School: Resilience in Cyber-Physical Systems: Challenges and Oppo...
SERENEWorkshop
 
SERENE 2014 School: Gabor karsai serene2014_school
SERENE 2014 School: Gabor karsai serene2014_schoolSERENE 2014 School: Gabor karsai serene2014_school
SERENE 2014 School: Gabor karsai serene2014_school
Henry Muccini
 
Nelson: Rigorous Deployment for a Functional World
Nelson: Rigorous Deployment for a Functional WorldNelson: Rigorous Deployment for a Functional World
Nelson: Rigorous Deployment for a Functional World
Timothy Perrett
 
HCI 3e - Ch 17: Models of the system
HCI 3e - Ch 17:  Models of the systemHCI 3e - Ch 17:  Models of the system
HCI 3e - Ch 17: Models of the system
Alan Dix
 
Declarative UI on iOS without SwiftUI (中文)
Declarative UI on iOS without SwiftUI (中文)Declarative UI on iOS without SwiftUI (中文)
Declarative UI on iOS without SwiftUI (中文)
Shih-Ting Huang
 
SERENE 2014 School: Measurement-Driven Resilience Design of Cloud-Based Cyber...
SERENE 2014 School: Measurement-Driven Resilience Design of Cloud-Based Cyber...SERENE 2014 School: Measurement-Driven Resilience Design of Cloud-Based Cyber...
SERENE 2014 School: Measurement-Driven Resilience Design of Cloud-Based Cyber...
Henry Muccini
 
SERENE 2014 School: Measurement-Driven Resilience Design of Cloud-Based Cyber...
SERENE 2014 School: Measurement-Driven Resilience Design of Cloud-Based Cyber...SERENE 2014 School: Measurement-Driven Resilience Design of Cloud-Based Cyber...
SERENE 2014 School: Measurement-Driven Resilience Design of Cloud-Based Cyber...
SERENEWorkshop
 
Building Sexy Real-Time Analytics Systems - Erlang Factory NYC / Toronto 2013
Building Sexy Real-Time Analytics Systems - Erlang Factory NYC / Toronto 2013Building Sexy Real-Time Analytics Systems - Erlang Factory NYC / Toronto 2013
Building Sexy Real-Time Analytics Systems - Erlang Factory NYC / Toronto 2013
lpgauth
 
Easy edd phd talks 28 oct 2008
Easy edd phd talks 28 oct 2008Easy edd phd talks 28 oct 2008
Easy edd phd talks 28 oct 2008
Taha Sochi
 
Testability for developers – Fighting a mess by making it testable
Testability for developers – Fighting a mess by making it testableTestability for developers – Fighting a mess by making it testable
Testability for developers – Fighting a mess by making it testable
Alexander Tarlinder
 
Static Analysis and Verification of C Programs
Static Analysis and Verification of C ProgramsStatic Analysis and Verification of C Programs
Introduction to Streaming Distributed Processing with Storm
Introduction to Streaming Distributed Processing with StormIntroduction to Streaming Distributed Processing with Storm
Introduction to Streaming Distributed Processing with Storm
Brandon O'Brien
 
Functional (web) development with Clojure
Functional (web) development with ClojureFunctional (web) development with Clojure
Functional (web) development with Clojure
Henrik Eneroth
 
Transfer Learning for Software Performance Analysis: An Exploratory Analysis
Transfer Learning for Software Performance Analysis: An Exploratory AnalysisTransfer Learning for Software Performance Analysis: An Exploratory Analysis
Transfer Learning for Software Performance Analysis: An Exploratory Analysis
Pooyan Jamshidi
 
Illogical engineers
Illogical engineersIllogical engineers
Illogical engineers
Pawel Szulc
 
Illogical engineers
Illogical engineersIllogical engineers
Illogical engineers
Pawel Szulc
 
Data Platform at Twitter: Enabling Real-time & Batch Analytics at Scale
Data Platform at Twitter: Enabling Real-time & Batch Analytics at ScaleData Platform at Twitter: Enabling Real-time & Batch Analytics at Scale
Data Platform at Twitter: Enabling Real-time & Batch Analytics at Scale
Sriram Krishnan
 
Requirements vs design vs runtime
Requirements vs design vs runtimeRequirements vs design vs runtime
Requirements vs design vs runtime
bdemchak
 
1025 track1 Malin
1025 track1 Malin1025 track1 Malin
1025 track1 Malin
Rising Media, Inc.
 

Similar to Statecharts with Stativus (20)

SERENE 2014 School: Resilience in Cyber-Physical Systems: Challenges and Oppo...
SERENE 2014 School: Resilience in Cyber-Physical Systems: Challenges and Oppo...SERENE 2014 School: Resilience in Cyber-Physical Systems: Challenges and Oppo...
SERENE 2014 School: Resilience in Cyber-Physical Systems: Challenges and Oppo...
 
SERENE 2014 School: Gabor karsai serene2014_school
SERENE 2014 School: Gabor karsai serene2014_schoolSERENE 2014 School: Gabor karsai serene2014_school
SERENE 2014 School: Gabor karsai serene2014_school
 
Nelson: Rigorous Deployment for a Functional World
Nelson: Rigorous Deployment for a Functional WorldNelson: Rigorous Deployment for a Functional World
Nelson: Rigorous Deployment for a Functional World
 
HCI 3e - Ch 17: Models of the system
HCI 3e - Ch 17:  Models of the systemHCI 3e - Ch 17:  Models of the system
HCI 3e - Ch 17: Models of the system
 
Declarative UI on iOS without SwiftUI (中文)
Declarative UI on iOS without SwiftUI (中文)Declarative UI on iOS without SwiftUI (中文)
Declarative UI on iOS without SwiftUI (中文)
 
SERENE 2014 School: Measurement-Driven Resilience Design of Cloud-Based Cyber...
SERENE 2014 School: Measurement-Driven Resilience Design of Cloud-Based Cyber...SERENE 2014 School: Measurement-Driven Resilience Design of Cloud-Based Cyber...
SERENE 2014 School: Measurement-Driven Resilience Design of Cloud-Based Cyber...
 
SERENE 2014 School: Measurement-Driven Resilience Design of Cloud-Based Cyber...
SERENE 2014 School: Measurement-Driven Resilience Design of Cloud-Based Cyber...SERENE 2014 School: Measurement-Driven Resilience Design of Cloud-Based Cyber...
SERENE 2014 School: Measurement-Driven Resilience Design of Cloud-Based Cyber...
 
Building Sexy Real-Time Analytics Systems - Erlang Factory NYC / Toronto 2013
Building Sexy Real-Time Analytics Systems - Erlang Factory NYC / Toronto 2013Building Sexy Real-Time Analytics Systems - Erlang Factory NYC / Toronto 2013
Building Sexy Real-Time Analytics Systems - Erlang Factory NYC / Toronto 2013
 
Easy edd phd talks 28 oct 2008
Easy edd phd talks 28 oct 2008Easy edd phd talks 28 oct 2008
Easy edd phd talks 28 oct 2008
 
Testability for developers – Fighting a mess by making it testable
Testability for developers – Fighting a mess by making it testableTestability for developers – Fighting a mess by making it testable
Testability for developers – Fighting a mess by making it testable
 
Static Analysis and Verification of C Programs
Static Analysis and Verification of C ProgramsStatic Analysis and Verification of C Programs
Static Analysis and Verification of C Programs
 
Introduction to Streaming Distributed Processing with Storm
Introduction to Streaming Distributed Processing with StormIntroduction to Streaming Distributed Processing with Storm
Introduction to Streaming Distributed Processing with Storm
 
Functional (web) development with Clojure
Functional (web) development with ClojureFunctional (web) development with Clojure
Functional (web) development with Clojure
 
Transfer Learning for Software Performance Analysis: An Exploratory Analysis
Transfer Learning for Software Performance Analysis: An Exploratory AnalysisTransfer Learning for Software Performance Analysis: An Exploratory Analysis
Transfer Learning for Software Performance Analysis: An Exploratory Analysis
 
Illogical engineers
Illogical engineersIllogical engineers
Illogical engineers
 
Illogical engineers
Illogical engineersIllogical engineers
Illogical engineers
 
Data Platform at Twitter: Enabling Real-time & Batch Analytics at Scale
Data Platform at Twitter: Enabling Real-time & Batch Analytics at ScaleData Platform at Twitter: Enabling Real-time & Batch Analytics at Scale
Data Platform at Twitter: Enabling Real-time & Batch Analytics at Scale
 
20101025 aiai2010
20101025 aiai201020101025 aiai2010
20101025 aiai2010
 
Requirements vs design vs runtime
Requirements vs design vs runtimeRequirements vs design vs runtime
Requirements vs design vs runtime
 
1025 track1 Malin
1025 track1 Malin1025 track1 Malin
1025 track1 Malin
 

Recently uploaded

GraphRAG is All You need? LLM & Knowledge Graph
GraphRAG is All You need? LLM & Knowledge GraphGraphRAG is All You need? LLM & Knowledge Graph
GraphRAG is All You need? LLM & Knowledge Graph
Guy Korland
 
Neuro-symbolic is not enough, we need neuro-*semantic*
Neuro-symbolic is not enough, we need neuro-*semantic*Neuro-symbolic is not enough, we need neuro-*semantic*
Neuro-symbolic is not enough, we need neuro-*semantic*
Frank van Harmelen
 
Mission to Decommission: Importance of Decommissioning Products to Increase E...
Mission to Decommission: Importance of Decommissioning Products to Increase E...Mission to Decommission: Importance of Decommissioning Products to Increase E...
Mission to Decommission: Importance of Decommissioning Products to Increase E...
Product School
 
Elevating Tactical DDD Patterns Through Object Calisthenics
Elevating Tactical DDD Patterns Through Object CalisthenicsElevating Tactical DDD Patterns Through Object Calisthenics
Elevating Tactical DDD Patterns Through Object Calisthenics
Dorra BARTAGUIZ
 
How world-class product teams are winning in the AI era by CEO and Founder, P...
How world-class product teams are winning in the AI era by CEO and Founder, P...How world-class product teams are winning in the AI era by CEO and Founder, P...
How world-class product teams are winning in the AI era by CEO and Founder, P...
Product School
 
UiPath Test Automation using UiPath Test Suite series, part 3
UiPath Test Automation using UiPath Test Suite series, part 3UiPath Test Automation using UiPath Test Suite series, part 3
UiPath Test Automation using UiPath Test Suite series, part 3
DianaGray10
 
The Art of the Pitch: WordPress Relationships and Sales
The Art of the Pitch: WordPress Relationships and SalesThe Art of the Pitch: WordPress Relationships and Sales
The Art of the Pitch: WordPress Relationships and Sales
Laura Byrne
 
Securing your Kubernetes cluster_ a step-by-step guide to success !
Securing your Kubernetes cluster_ a step-by-step guide to success !Securing your Kubernetes cluster_ a step-by-step guide to success !
Securing your Kubernetes cluster_ a step-by-step guide to success !
KatiaHIMEUR1
 
To Graph or Not to Graph Knowledge Graph Architectures and LLMs
To Graph or Not to Graph Knowledge Graph Architectures and LLMsTo Graph or Not to Graph Knowledge Graph Architectures and LLMs
To Graph or Not to Graph Knowledge Graph Architectures and LLMs
Paul Groth
 
Epistemic Interaction - tuning interfaces to provide information for AI support
Epistemic Interaction - tuning interfaces to provide information for AI supportEpistemic Interaction - tuning interfaces to provide information for AI support
Epistemic Interaction - tuning interfaces to provide information for AI support
Alan Dix
 
Designing Great Products: The Power of Design and Leadership by Chief Designe...
Designing Great Products: The Power of Design and Leadership by Chief Designe...Designing Great Products: The Power of Design and Leadership by Chief Designe...
Designing Great Products: The Power of Design and Leadership by Chief Designe...
Product School
 
Unsubscribed: Combat Subscription Fatigue With a Membership Mentality by Head...
Unsubscribed: Combat Subscription Fatigue With a Membership Mentality by Head...Unsubscribed: Combat Subscription Fatigue With a Membership Mentality by Head...
Unsubscribed: Combat Subscription Fatigue With a Membership Mentality by Head...
Product School
 
DevOps and Testing slides at DASA Connect
DevOps and Testing slides at DASA ConnectDevOps and Testing slides at DASA Connect
DevOps and Testing slides at DASA Connect
Kari Kakkonen
 
LF Energy Webinar: Electrical Grid Modelling and Simulation Through PowSyBl -...
LF Energy Webinar: Electrical Grid Modelling and Simulation Through PowSyBl -...LF Energy Webinar: Electrical Grid Modelling and Simulation Through PowSyBl -...
LF Energy Webinar: Electrical Grid Modelling and Simulation Through PowSyBl -...
DanBrown980551
 
Smart TV Buyer Insights Survey 2024 by 91mobiles.pdf
Smart TV Buyer Insights Survey 2024 by 91mobiles.pdfSmart TV Buyer Insights Survey 2024 by 91mobiles.pdf
Smart TV Buyer Insights Survey 2024 by 91mobiles.pdf
91mobiles
 
When stars align: studies in data quality, knowledge graphs, and machine lear...
When stars align: studies in data quality, knowledge graphs, and machine lear...When stars align: studies in data quality, knowledge graphs, and machine lear...
When stars align: studies in data quality, knowledge graphs, and machine lear...
Elena Simperl
 
AI for Every Business: Unlocking Your Product's Universal Potential by VP of ...
AI for Every Business: Unlocking Your Product's Universal Potential by VP of ...AI for Every Business: Unlocking Your Product's Universal Potential by VP of ...
AI for Every Business: Unlocking Your Product's Universal Potential by VP of ...
Product School
 
Empowering NextGen Mobility via Large Action Model Infrastructure (LAMI): pav...
Empowering NextGen Mobility via Large Action Model Infrastructure (LAMI): pav...Empowering NextGen Mobility via Large Action Model Infrastructure (LAMI): pav...
Empowering NextGen Mobility via Large Action Model Infrastructure (LAMI): pav...
Thierry Lestable
 
Encryption in Microsoft 365 - ExpertsLive Netherlands 2024
Encryption in Microsoft 365 - ExpertsLive Netherlands 2024Encryption in Microsoft 365 - ExpertsLive Netherlands 2024
Encryption in Microsoft 365 - ExpertsLive Netherlands 2024
Albert Hoitingh
 
Builder.ai Founder Sachin Dev Duggal's Strategic Approach to Create an Innova...
Builder.ai Founder Sachin Dev Duggal's Strategic Approach to Create an Innova...Builder.ai Founder Sachin Dev Duggal's Strategic Approach to Create an Innova...
Builder.ai Founder Sachin Dev Duggal's Strategic Approach to Create an Innova...
Ramesh Iyer
 

Recently uploaded (20)

GraphRAG is All You need? LLM & Knowledge Graph
GraphRAG is All You need? LLM & Knowledge GraphGraphRAG is All You need? LLM & Knowledge Graph
GraphRAG is All You need? LLM & Knowledge Graph
 
Neuro-symbolic is not enough, we need neuro-*semantic*
Neuro-symbolic is not enough, we need neuro-*semantic*Neuro-symbolic is not enough, we need neuro-*semantic*
Neuro-symbolic is not enough, we need neuro-*semantic*
 
Mission to Decommission: Importance of Decommissioning Products to Increase E...
Mission to Decommission: Importance of Decommissioning Products to Increase E...Mission to Decommission: Importance of Decommissioning Products to Increase E...
Mission to Decommission: Importance of Decommissioning Products to Increase E...
 
Elevating Tactical DDD Patterns Through Object Calisthenics
Elevating Tactical DDD Patterns Through Object CalisthenicsElevating Tactical DDD Patterns Through Object Calisthenics
Elevating Tactical DDD Patterns Through Object Calisthenics
 
How world-class product teams are winning in the AI era by CEO and Founder, P...
How world-class product teams are winning in the AI era by CEO and Founder, P...How world-class product teams are winning in the AI era by CEO and Founder, P...
How world-class product teams are winning in the AI era by CEO and Founder, P...
 
UiPath Test Automation using UiPath Test Suite series, part 3
UiPath Test Automation using UiPath Test Suite series, part 3UiPath Test Automation using UiPath Test Suite series, part 3
UiPath Test Automation using UiPath Test Suite series, part 3
 
The Art of the Pitch: WordPress Relationships and Sales
The Art of the Pitch: WordPress Relationships and SalesThe Art of the Pitch: WordPress Relationships and Sales
The Art of the Pitch: WordPress Relationships and Sales
 
Securing your Kubernetes cluster_ a step-by-step guide to success !
Securing your Kubernetes cluster_ a step-by-step guide to success !Securing your Kubernetes cluster_ a step-by-step guide to success !
Securing your Kubernetes cluster_ a step-by-step guide to success !
 
To Graph or Not to Graph Knowledge Graph Architectures and LLMs
To Graph or Not to Graph Knowledge Graph Architectures and LLMsTo Graph or Not to Graph Knowledge Graph Architectures and LLMs
To Graph or Not to Graph Knowledge Graph Architectures and LLMs
 
Epistemic Interaction - tuning interfaces to provide information for AI support
Epistemic Interaction - tuning interfaces to provide information for AI supportEpistemic Interaction - tuning interfaces to provide information for AI support
Epistemic Interaction - tuning interfaces to provide information for AI support
 
Designing Great Products: The Power of Design and Leadership by Chief Designe...
Designing Great Products: The Power of Design and Leadership by Chief Designe...Designing Great Products: The Power of Design and Leadership by Chief Designe...
Designing Great Products: The Power of Design and Leadership by Chief Designe...
 
Unsubscribed: Combat Subscription Fatigue With a Membership Mentality by Head...
Unsubscribed: Combat Subscription Fatigue With a Membership Mentality by Head...Unsubscribed: Combat Subscription Fatigue With a Membership Mentality by Head...
Unsubscribed: Combat Subscription Fatigue With a Membership Mentality by Head...
 
DevOps and Testing slides at DASA Connect
DevOps and Testing slides at DASA ConnectDevOps and Testing slides at DASA Connect
DevOps and Testing slides at DASA Connect
 
LF Energy Webinar: Electrical Grid Modelling and Simulation Through PowSyBl -...
LF Energy Webinar: Electrical Grid Modelling and Simulation Through PowSyBl -...LF Energy Webinar: Electrical Grid Modelling and Simulation Through PowSyBl -...
LF Energy Webinar: Electrical Grid Modelling and Simulation Through PowSyBl -...
 
Smart TV Buyer Insights Survey 2024 by 91mobiles.pdf
Smart TV Buyer Insights Survey 2024 by 91mobiles.pdfSmart TV Buyer Insights Survey 2024 by 91mobiles.pdf
Smart TV Buyer Insights Survey 2024 by 91mobiles.pdf
 
When stars align: studies in data quality, knowledge graphs, and machine lear...
When stars align: studies in data quality, knowledge graphs, and machine lear...When stars align: studies in data quality, knowledge graphs, and machine lear...
When stars align: studies in data quality, knowledge graphs, and machine lear...
 
AI for Every Business: Unlocking Your Product's Universal Potential by VP of ...
AI for Every Business: Unlocking Your Product's Universal Potential by VP of ...AI for Every Business: Unlocking Your Product's Universal Potential by VP of ...
AI for Every Business: Unlocking Your Product's Universal Potential by VP of ...
 
Empowering NextGen Mobility via Large Action Model Infrastructure (LAMI): pav...
Empowering NextGen Mobility via Large Action Model Infrastructure (LAMI): pav...Empowering NextGen Mobility via Large Action Model Infrastructure (LAMI): pav...
Empowering NextGen Mobility via Large Action Model Infrastructure (LAMI): pav...
 
Encryption in Microsoft 365 - ExpertsLive Netherlands 2024
Encryption in Microsoft 365 - ExpertsLive Netherlands 2024Encryption in Microsoft 365 - ExpertsLive Netherlands 2024
Encryption in Microsoft 365 - ExpertsLive Netherlands 2024
 
Builder.ai Founder Sachin Dev Duggal's Strategic Approach to Create an Innova...
Builder.ai Founder Sachin Dev Duggal's Strategic Approach to Create an Innova...Builder.ai Founder Sachin Dev Duggal's Strategic Approach to Create an Innova...
Builder.ai Founder Sachin Dev Duggal's Strategic Approach to Create an Innova...
 

Statecharts with Stativus

Editor's Notes

  1. Buenas Tarde. Mi nombre es Luc Castera y hoy voy a hablar de Statecharts. Esta charla tiene dos partes. En la primera, vamos a aprender que son statecharts y como se usan. En la segunda parte, vamos a ver como usar Stativus para crear un Statechart.\n
  2. Podemos dividir todo proyectos de software en 7 fases, desde la iniciacion hasta el mantenimiento. Cuando hablamos de statechart, se trata de las fases de especification y de diseno. La implementacion viene despues que tenemos nuestro diseno y statecharts listos. Entonces, para poder implementar statecharts, primero tenemos que entender como funcionan. Por eso, una gran parte de esta charla va a ser mas teoria. Pero al fin, vamos a ver como implementar lo que aprendemos y escribir un poco de codigo.\n
  3. Podemos dividir todo sistemas de software en 2 categorias. La primera categoria trata de sistemas transformationales donde tenemos un output for cada input. Lo que pasa a dentro de esa funcion solo cambia si el input cambia. Nosotros programadores son bien acostumbrados a este tipo de sistemas.\n
  4. Pero tambien hay un otro tipo de sistemas que llamamos sistemas reactivos, que son ‘event-driven’. Estos sistemas tienen que cambiar de estado o reaccionar cuando pasa algo. Estos eventos pueden ser internos o externos.\n
  5. Un ejemplo de un sistema reactivo es un reloj. Cuando tu manejas el boton al lado del reloj para cambiar la hora o la fecha, el sistema tiene que hacer algo. Entonces, el sistema siempre esta esperando que pasa algo y sabe como cambiarse cuando recibe un evento.\n
  6. Un otro ejemplo mas cerca de nosotros son los Browsers o aplicaciones web que tienen que reaccionar cuando un usuario hace un lick, escribe algo, o mueve su mouse.\n
  7. Usamos Javascript en el Browser para escuchar estos eventos. Pero tambien, en el servidor, con node.js por ejemplo, una aplicacion puede recibir eventos. Node.js es una plataforma de javascript que puedes usar en un servidor. Node.js es famoso por ser ‘event-driven’ entonces es un buen ejemplo de un sistema reactivo.\n
  8. Pero hay un problema con sistemas reactivos. Durante anos, no habia una buena manera de especificar y disenar sistemas reactivos muy complejos. En 1987, David Harel, mientras trabajando por el Israel Aircarft Industries, publicó un papel intitulado “Statecharts: A visual Formalism for Complex Systems”. En este papel, que recomendo leer, el describe una manera de representar sistemas reactivos complejos usando Statecharts.\n
  9. Pero que son statecharts?\n
  10. La manera mas rapida, de definir un statechart es asi. Statecharts son ‘state diagrams’ pero con 3 cosas addicionales. Primero, un state diagram es algo plano mientras un statechart te permite representar profundidad con multiples planos. Tambien, state diagrams no tienen una manera de representar cosas que se produzcan al mismo tiempo, en paralelo. Statecharts hacen eso. Y finalmente, statecharts tiene una manera de representar communicacion en modo ‘broadcast’.\n
  11. Todo esto parece bien complicado pero la verdad es que es muy simple. Vamos a aprender como hacer un statecharts y la notación oficial de los statecharts.\n\nQue presten atencion porque al fin van a tomar un examen :-)\n
  12. Este es un statechart muy simple. Tiene 3 estados: A, B, y C. Tiene 2 eventos. El evento D, tiene una condicion E. Entonces, si estamos en el estado A, y recibimos un evento D, si la condicion E es verdadera, vamos a ir al estado B. Del estado B, si recibimos un evento F, vamos a ir al estado C, pero tambien vamos a hacer la accion ‘writeMessage’. Los parentensis representant una condicion, y la notacion F / writeMessage representa una accion que debemos tomar cuando cambiamos de estado.\n
  13. Tambien hay eventos que deben tomar una acion sin cambiar de estado, como el evento G en este Statechart. Esos se llaman ‘internal events’ o eventos internos. Usamos esta notacion para representarlos.\n
  14. Este statechart es el mismo que el de antes pero con un evento adicional, el evento H. Podemos ver que en dos estados, el B y el C, el evento H nos hacemos ir al estado A. Todo esta claro?\n
  15. En este caso, podemos agrupar los eventos B y C, y tener solo una flecha para el evento H. Esto es lo que llamamos ‘clustering’. Aca tenemos un nuevo estado G que es un grupo de estados. Entienden eso?\n
  16. Cuando tienes un statechart muy complicado, a veces es impossible poner todo el statechart en una pagina, en este caso puedes mostrar el grupo G de la pagina antes, de esta manera. Es como si hicimos un zoom-out para ver el statechart desde mas lejos. Claro que tenemos que definir lo que hay adentro del grupo G pero lo podemos hacer en una otra pagina. Asi podemos representar problems muy complejos con un statechart pero en muchas paginas.\n
  17. Hay algo importante que no hemos visto en los ultimos statechart: como empeza todo? Un statechart necesita un ‘default state’ o un estado por defecto donde vamos a empezar. En este ejemplo, cambie un poquito el statechart para mostrar que vamos a iniciar el statechart en el estado A. Tambien, cuando entramos el estado G, vamos a ir primero al estado B.\n
  18. Hay un otro concepto importante que es el concepto de Historia. En este statechart, pueden ver que el ‘default state’ del grupo G tiene una flecha que va a un circulo con un H. Eso es la notacion para la historia. Eso significa, que cuando entramos el estado G, vamos a ir al estado entre B y C donde estabamos la ultima vez que fuimos en el estado G. Si es la primera vez que entramos el estado G, vamos a ir al estado B.\n
  19. Tambien hay un concepto de deep History con la notacion H*. Esto significa que vamos a conserer la historia no solo del grupo G, pero tambien de los grupos adentros: los grupos B y C. Esto es un tema bien avanzado que nunca he tenido que utilizar entonces avanzamos.\n
  20. Un statechart tambien puede tener ‘transient states’ que son estados ‘de pasajes’. Estos estados cambian de estados sin la participacion del usuario del software. Por ejemplo, imaginate que cuando entramos el estado Z, hicimos un Ajax request para ver si el usuario tiene una cuenta y esta logged in. Despues de un rato, vamos a recibir la repuesta del servidor y cambiar de estadio.\n
  21. A veces un sistema tiene differentes partes que estan en estados differentes al mismo tiempo. Tambien hay una notacion para esto como pueden ver aca. Cuando este statecharts empeza, vamos a estar en el estado B y el estado D al mismo tiempo. Siempre vamos a estar en dos estados. Puede ser B y D o C y F o C y D., etc....\n
  22. Bueno, ya aprendimos casi toda la teoria de statecharts. Hay otros conceptos mas complicados que no vamos a ver hoy porque son conceptos mas avanzados que no siempre van a usar. Con lo que ya aprendimos hoy, podemos hacer mucho. Hace casi 2 anos que estoy usando statecharts y pienso que nunca he utilizado un concepto afuera de los que vimos ahora. Pero si quieren aprender mas sobre statecharts, el papel de Harel es muy bueno.\n\nAhora vamos a ver unos ejemplos. El primero viene directamente del papel de Harel.\n
  23. En el papel de Harel, explican como construir el statechart para este reloj digital que tiene 4 botones para cambiar la hora, la fecha, las 2 alarmas, la luz, etc...\n
  24. Esto es el statechart :-)\n\nNo lo vamos a estudiar, lo pongo aca solo para que tengan una idea de un statechart de un tamaño un poco mas grande. Pero aca se puede ver que tenemos estados en paralelos. El mas importante es el que controla la pantalla. Los otros son muy simples: controlan el estado de las alarmas o la luz. Por ejemplo, el de la luz es super simple.\n\n
  25. Aca tengo un otro ejemplo, es tu applicacion sin statecharts donde usas un monton de variables y boolean para mantener estados diferentes.\n\nEn realidad, lo que haces es usar un solo estado unico y usas variables y funciones por todo lado. A veces tienes que tener variables globales...\n\nEso puede ser feo, pero tambien no es muy estable porque cualquier accion puede pasar a cualquier tiempo si olvidaste de chequear un variable. En este tipo de applicaciones, bugs son mas comunes.\n\nBuenos, se sienten seguros que entienden todo y estan listos para cambiar eso y construir sus propios statecharts?\n
  26. Aca tengo un pequeno ejercicio que vamos a hacer. Ustedes tienen 5 minutos para hacerlo. Tengo papel y lapices aca para los que necesitan.\n\nVamos a escribir el statechart para un boton en un browser. Ustedes ya saben como funcionan:\n1. si pulsas y sueltas el boton mientras el cursor esta adentro del boton, el accion se dispara.\n2. Cuando el mouse esta adentro del boton, el boton debe ser de una otro color.\n\nBueno, tienen 5 minutes para el ejercicio. Si tienen preguntas, me consultan.\n
  27. Aqui esta la solucion. No se puede hacer con menos que 4 estados sin tener bugs.\n\nVoy a darles unos minutos para revisar la solucion y ver si entienden todo o si tienen preguntas.\n\nAlgunos estaban cercas?\n\nBuenos, la verdad es que esta solucion tiene un bug que a veces han encontrado en software que utilizan. Hasta Mac OS X tenia este bug en el pasado. Vamos a arreglar el statechart para matar a este bug.\n
  28. El bug se manifesta cuando empezamos la applicacion, no podemos empezar la applicacion en el ‘Mouse Out Mouse Up’ state sin chequear primero si no estamos adentro del boton. Entonces, aca necesitamos un ‘transient state’ para ver si estamos a dentro del boton al principio.\n
  29. Bueno, ahora que entiendan como usar statecharts, la pregunta es: porque?\n\nPorque usarlos en nuestras applicaciones?\n
  30. Ya vimos que son buenos para documentar la especification de applicaciones complejos.\n
  31. Pero tambien son buenos para communicar con tus compañeros. En particular, un non-techie no va a leer tu codigo pero pueden ver un statechart y entender lo que paso.\n\nPor ejemplo, es una buena manera de communicar con tu equipo de QA testing.\n
  32. Pero la primera razon porque me gusta usarlos es porque te hacen pensar antes que escribes una linea de codigo.\n\nA veces, nosotros programmadores atacan un problemo muy rapido sin sentarse y pensar a todo los casos que pueden pasar.\n\nCuando tengo que disenar un sistema reactivo, trato primero de disenar todo el statechart antes de escribir una linea de codigo. Cuando hago eso, mis aplicaciones tienen menos bugs y desarollo mas rapido porque ya tengo todo el sistema en frente de mi.\n
  33. Una aplicacion que usa statecharts siempre es mas estable que una que no usa statecharts.\n\nla razon es simple, si un evento pasa y no estas en un estadio que debe tener una reaccion con este evento, nada pasa. Es simple, pero es impresionante como un concepto tan simple puede hacer tu applicacion mas estable.\n\nLo que hacemos es isolar partes de nuestro codigo, a cada momento, siempre estamos usando solo una parte del codigo, el resto no se applica porque no estamos en un estado donde se puede usar.\n
  34. Finalmente, usar statecharts es una buena manera de verificar que estas testeando todos lo que puede suceder en tu applicacion. Luego si tengo tiempo voy a demonstrar una tecnica para hacer eso.\n
  35. \n
  36. Ya hablamos demasiado de teoria, ahora vamos a ver codigo!\n\nEn particular vamos a aprender como usar Stativus, una libreria escrito en Javascript por Evin Grano para escribir statecharts.\n
  37. Vamos a programar el boton que diseñamos juntos con un statechart. El codigo esta en mi cuenta de github para que los pueden ver.\n
  38. \n
  39. \n
  40. \n
  41. \n
  42. \n