Download to read offline
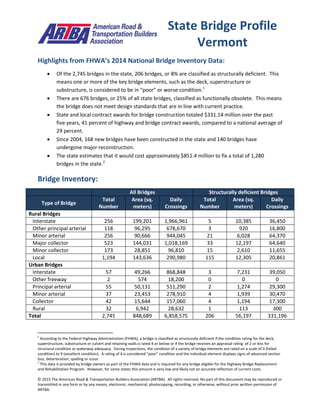
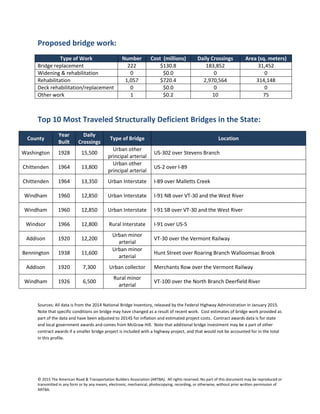

This document summarizes bridge data from the 2014 National Bridge Inventory for the state of Vermont. Some key points: - 8% of bridges (206) are structurally deficient and 25% (676) are functionally obsolete. - Over the past 5 years, 41% of highway/bridge contracts went to bridge construction, higher than the national average of 29%. - It is estimated that it would cost $851.4 million to repair 1,280 bridges in the state.


