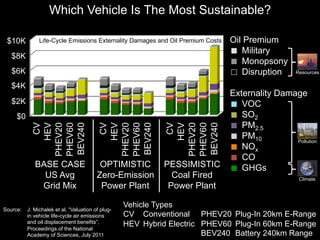
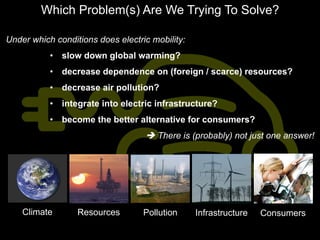
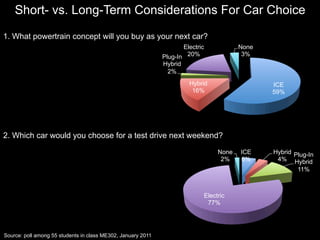
The document discusses the challenges and considerations surrounding the adoption of electric vehicles (EVs) as a sustainable transportation alternative. It highlights consumer concerns about range, charging infrastructure, and costs, as well as the perspectives of industry experts and research findings from various studies. Ultimately, it questions whether consumers are ready for EVs or if EVs are adequately prepared to meet consumer expectations.

![Average Daily Miles Traveled – Rational Consideration?
100
Cumulative Daily Distance / Total [%]
90
Germany US
80
70
60
50
40
30
20
10 Source: Pike Research, US DOT, Volkswagen Research Lab
Compiled by M. Buckner, Lico Technology
0
15 30 45 60 75 90 105 120 135 150 165 180
Daily Total Travel Distance per Vehicle [mls]](https://image.slidesharecdn.com/stanforduniversity-e-mobility-111108173811-phpapp01/85/Stanford-university-e-mobility-4-320.jpg)
![Actual Considerations For Vehicle Purchase
100
Cumulative Daily Distance / Total [%]
90
Germany US
80
70
60
50
40
30
20
10 Source: Pike Research, US DOT, Volkswagen Research Lab
Compiled by M. Buckner, Lico Technology
0
15 30 45 60 75 90 105 120 135 150 165 180
Daily Total Travel Distance per Vehicle [mls]](https://image.slidesharecdn.com/stanforduniversity-e-mobility-111108173811-phpapp01/85/Stanford-university-e-mobility-5-320.jpg)
![US / EU Surveys: EV Revolution Not Happening, Yet
Challenges US consumers see regarding electric vehicles [1]
28% range and battery life
20% availability of charging stations
17 % total cost/affordability
9% high [purchase] cost of vehicles
Challenges EU industry experts see regarding electric vehicles [2]
65% range
57% availability of charging stations
55% total cost/affordability
30% not suitable for everyday driving
Analysts expect EVs to have 2% to 3% share of the new-car market by 2020 [3]
Consumers are not ready for EVs
or
are EVs not ready for consumers?
[1] “Energy + Environment Study”, Market Strategies International, Nov 2010 (1,168 interviews U.S. nationwide, Oct 14-25, 2010)
[2] “European Automotive Survey 2011”, Ernst & Young, Aug 28, 2011
[3] “Are Americans Willing to Try Electric Cars?”, The Wall Street Journal, Dec 1, 2010](https://image.slidesharecdn.com/stanforduniversity-e-mobility-111108173811-phpapp01/85/Stanford-university-e-mobility-7-320.jpg)
![Range Anxiety, EV Research, And Lifecycle Emissions
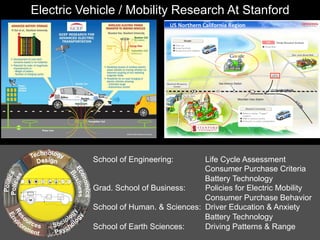
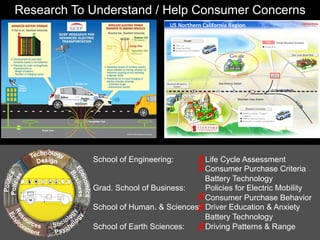
Typical Driving R&D Focus for Electric Vehicles
100
Cumulative Daily Distance / Total [%]
90
Germany US
80
70
60
50
40
30
20
10 Source: Pike Research, US DOT, Volkswagen Research Lab
Compiled by M. Buckner, Lico Technology
0
15 30 45 60 75 90 105 120 135 150 165 180
Daily Total Travel Distance per Vehicle [mls]](https://image.slidesharecdn.com/stanforduniversity-e-mobility-111108173811-phpapp01/85/Stanford-university-e-mobility-9-320.jpg)