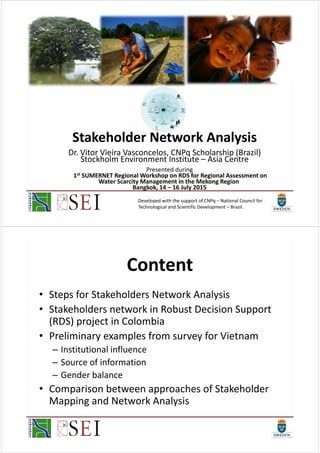
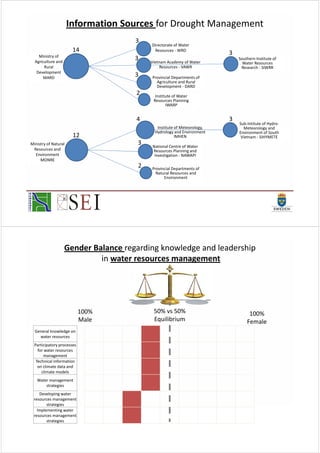
Stakeholder Network Analysis
Dr. Vitor Vieira Vasconcelos, CNPq Scholarship (Brazil)
Stockholm Environment Institute – Asia Centre
Presented during
1st SUMERNET Regional Workshop on RDS for Regional Assessment on
Water Scarcity Management in the Mekong Region
Bangkok, 14 – 16 July 2015
Developed with the support of CNPq – National Council for
Technological and Scientific Development – Brazil.
Content
• Steps for Stakeholders Network Analysis
• Stakeholders network in Robust Decision Support
(RDS) project in Colombia
• Preliminary examples from survey for Vietnam
– Institutional influence
– Source of information
– Gender balance
• Comparison between approaches of Stakeholder
Mapping and Network Analysis
Steps for Stakeholders
Network Analysis
• Graphs for different attributes from the questionnaire
• Types of institutions
• Priority for water allocation
• Gender based questions
• Flowcharts
• Social networks
• Organizational charts (e.g., departmental structure)
Questionnaire
• Before or during the workshop
Analysis
Social Networks
(organizational connections)
Not interviewed
Interviewed
• Center (bigger size): more connections
• Borders (smaller size): less conections
Example from RDS Project in Colombia
Government institutions
Research institutitutions
Educational institutions
Labour unions
International institutions
Other institutions
Software: NetDraw
https://sites.google.com/site/netdrawsoftware/home

Stakeholder Network Analysis

  • 1.
    Stakeholder Network Analysis Dr.Vitor Vieira Vasconcelos, CNPq Scholarship (Brazil) Stockholm Environment Institute – Asia Centre Presented during 1st SUMERNET Regional Workshop on RDS for Regional Assessment on Water Scarcity Management in the Mekong Region Bangkok, 14 – 16 July 2015 Developed with the support of CNPq – National Council for Technological and Scientific Development – Brazil. Content • Steps for Stakeholders Network Analysis • Stakeholders network in Robust Decision Support (RDS) project in Colombia • Preliminary examples from survey for Vietnam – Institutional influence – Source of information – Gender balance • Comparison between approaches of Stakeholder Mapping and Network Analysis
  • 2.
    Steps for Stakeholders NetworkAnalysis • Graphs for different attributes from the questionnaire • Types of institutions • Priority for water allocation • Gender based questions • Flowcharts • Social networks • Organizational charts (e.g., departmental structure) Questionnaire • Before or during the workshop Analysis Social Networks (organizational connections) Not interviewed Interviewed • Center (bigger size): more connections • Borders (smaller size): less conections Example from RDS Project in Colombia Government institutions Research institutitutions Educational institutions Labour unions International institutions Other institutions Software: NetDraw https://sites.google.com/site/netdrawsoftware/home
  • 3.
    Steps for Stakeholders NetworkAnalysis • Graphs for different attributes from the questionnaire • Types of institutions • Priority for water allocation • Gender based questions • Flowcharts • Social networks • Organizational charts (e.g., departmental structure) Questionnaire • Before or during the workshop Analysis Social Networks (organizational connections) Not interviewed Interviewed • Center (bigger size): more connections • Borders (smaller size): less conections Example from RDS Project in Colombia Government institutions Research institutitutions Educational institutions Labour unions International institutions Other institutions Software: NetDraw https://sites.google.com/site/netdrawsoftware/home
  • 4.
    Steps for Stakeholders NetworkAnalysis • Graphs for different attributes from the questionnaire • Types of institutions • Priority for water allocation • Gender based questions • Flowcharts • Social networks • Organizational charts (e.g., departmental structure) Questionnaire • Before or during the workshop Analysis Social Networks (organizational connections) Not interviewed Interviewed • Center (bigger size): more connections • Borders (smaller size): less conections Example from RDS Project in Colombia Government institutions Research institutitutions Educational institutions Labour unions International institutions Other institutions Software: NetDraw https://sites.google.com/site/netdrawsoftware/home
  • 5.
    Steps for Stakeholders NetworkAnalysis • Graphs for different attributes from the questionnaire • Types of institutions • Priority for water allocation • Gender based questions • Flowcharts • Social networks • Organizational charts (e.g., departmental structure) Questionnaire • Before or during the workshop Analysis Social Networks (organizational connections) Not interviewed Interviewed • Center (bigger size): more connections • Borders (smaller size): less conections Example from RDS Project in Colombia Government institutions Research institutitutions Educational institutions Labour unions International institutions Other institutions Software: NetDraw https://sites.google.com/site/netdrawsoftware/home