This document provides an overview and definitions for developing a savings strategy in purchasing. It discusses how savings impact an organization's bottom line and income statement. Several types of savings are defined, including year-over-year savings, payment term savings, and substitution savings. Formulas for calculating each type of savings are provided along with examples to illustrate their application. The document emphasizes communicating savings in the language of accounting to effectively demonstrate value to executive management.
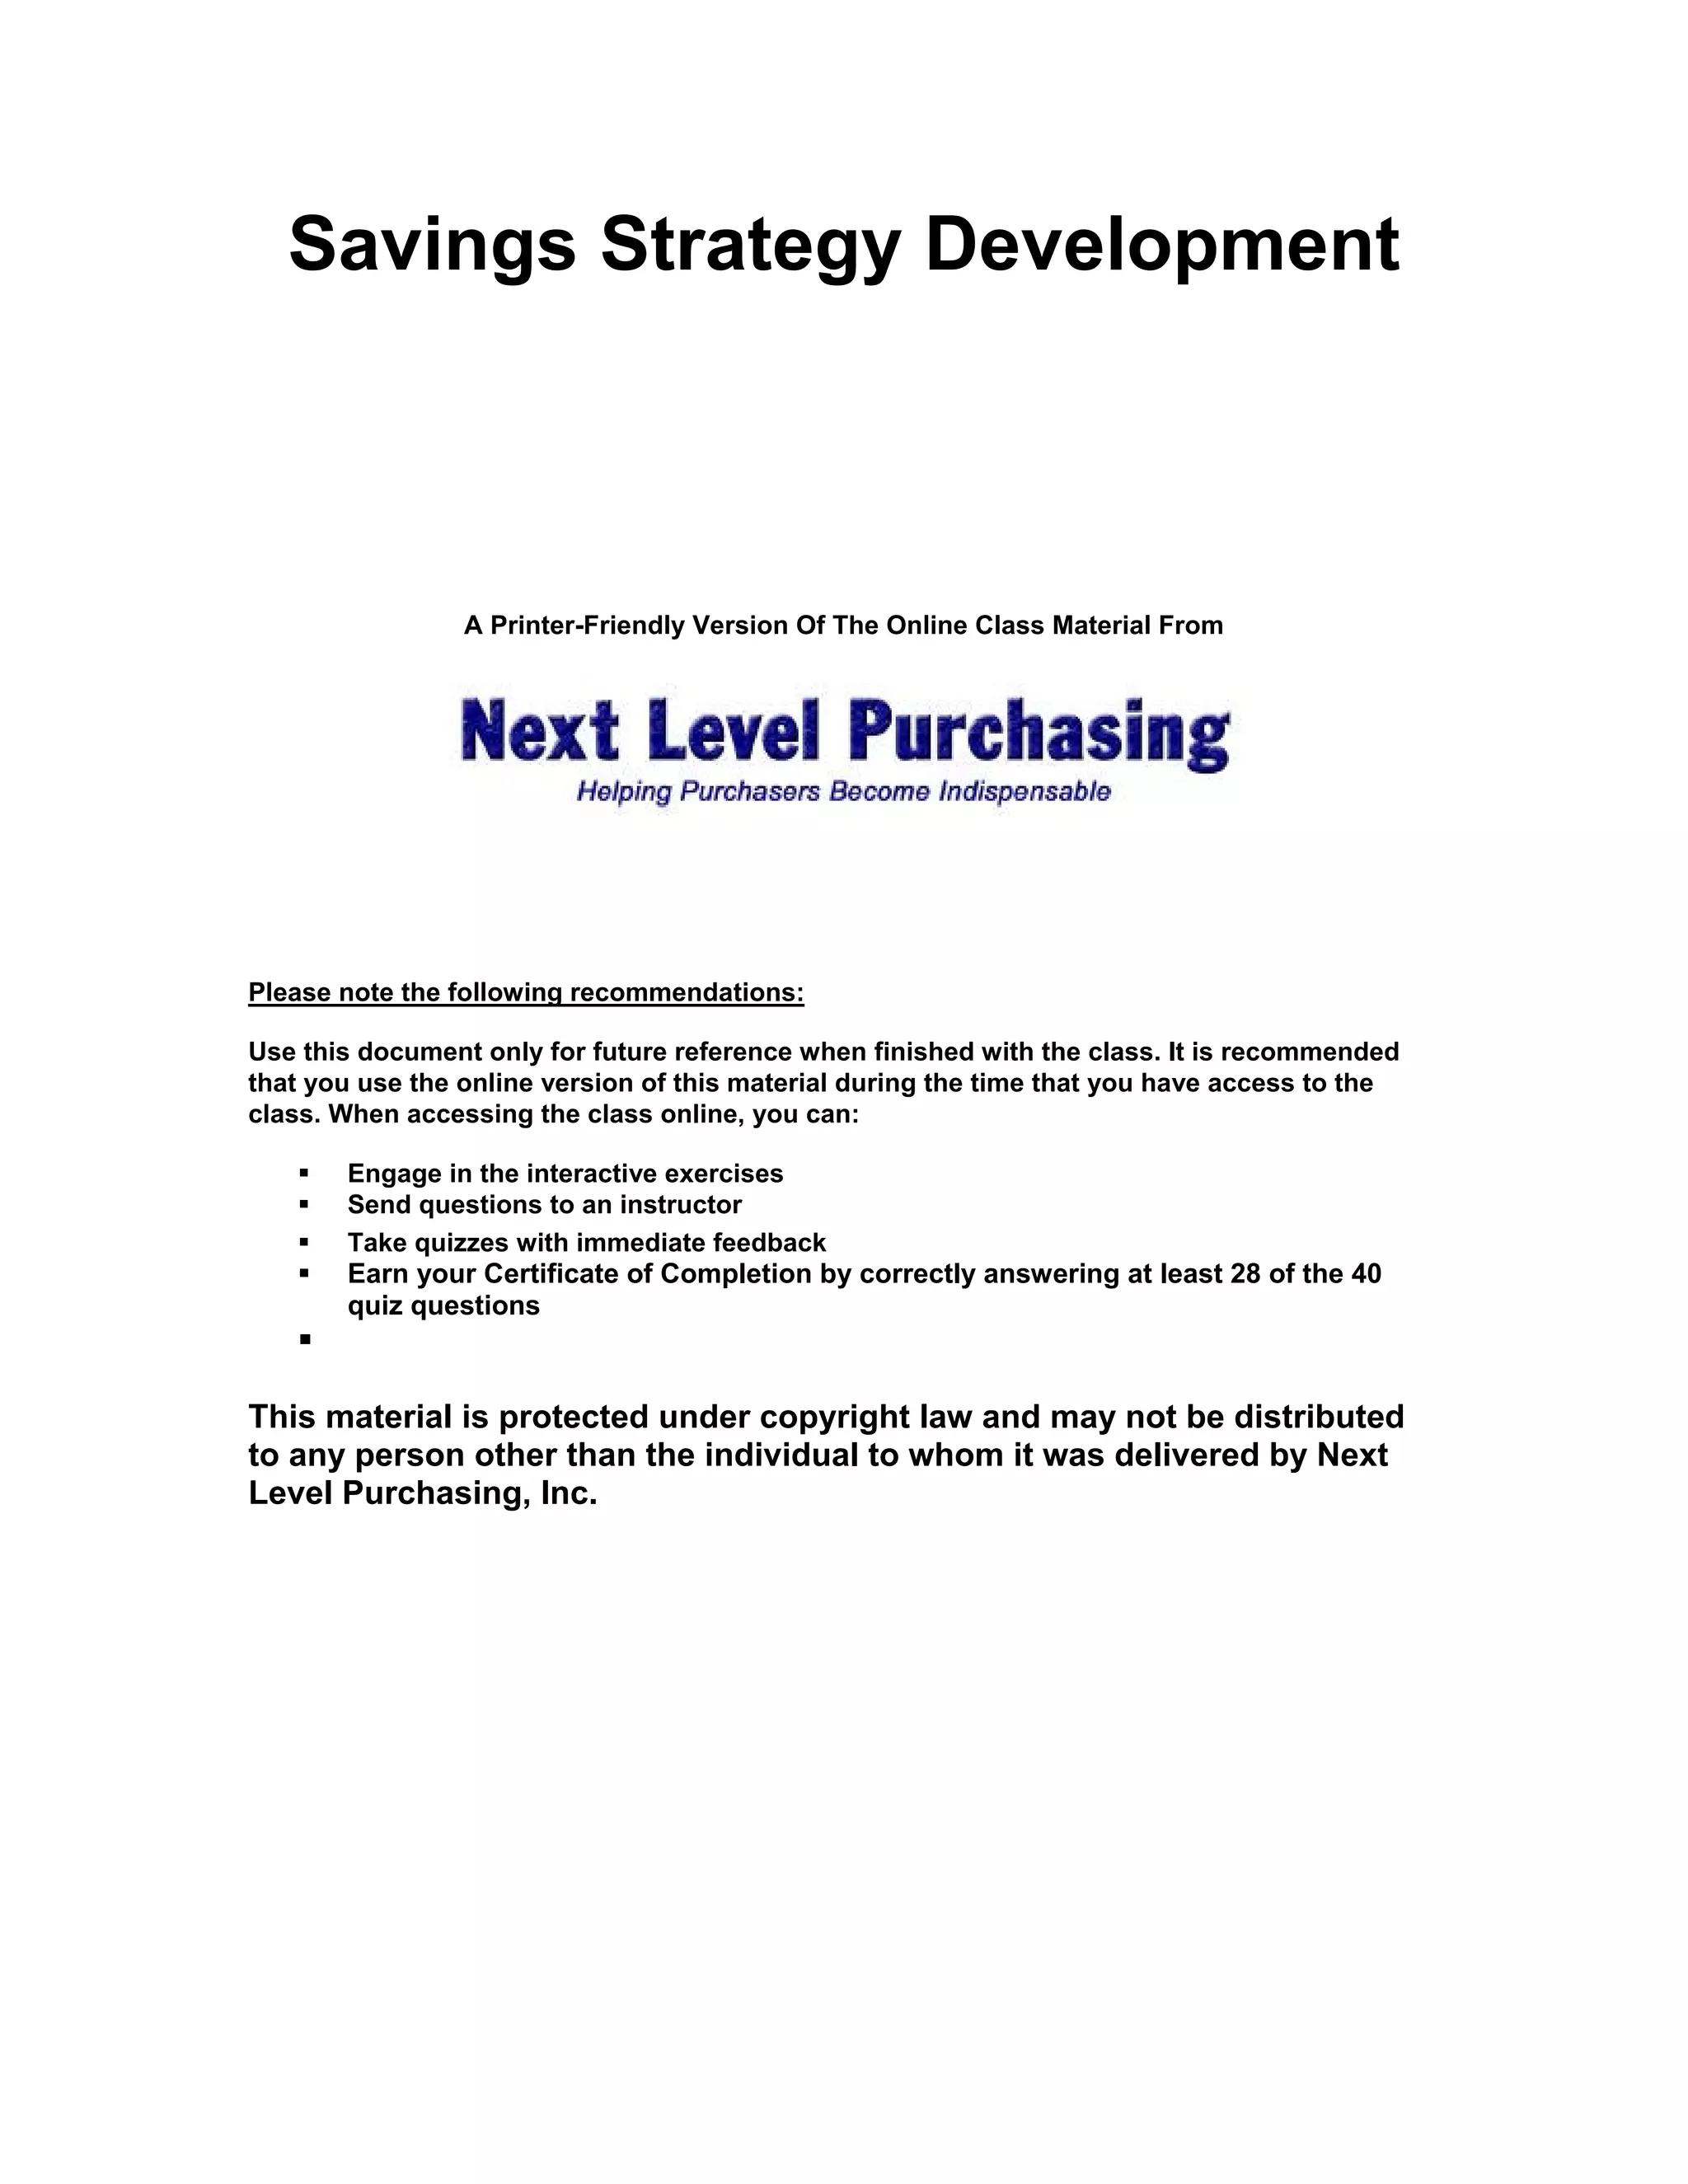
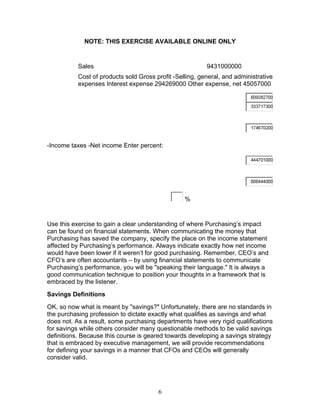
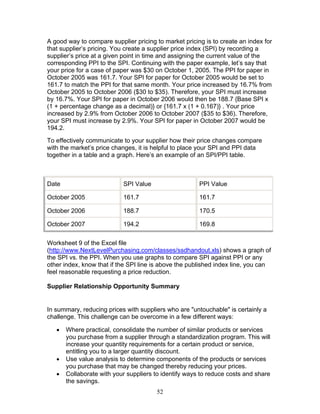
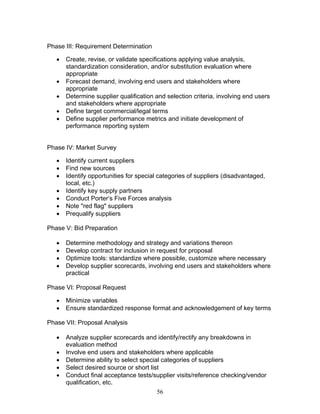
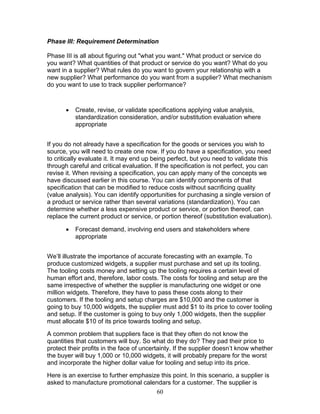
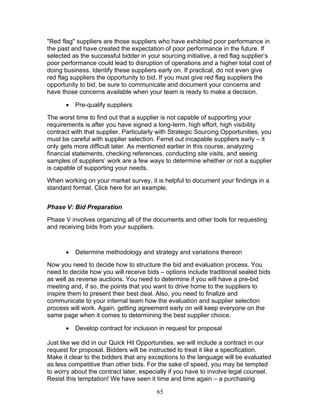
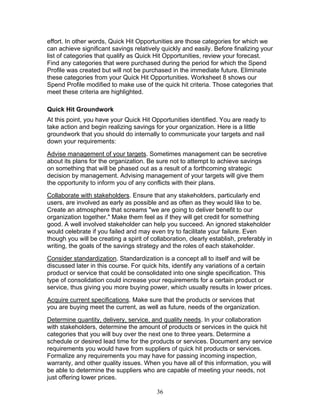
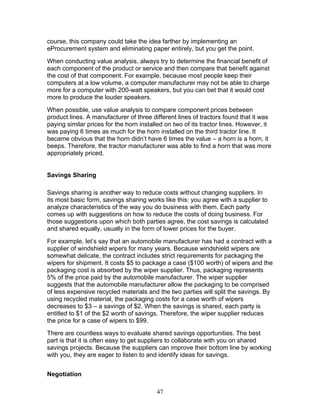
![Payment Term Savings: Your company receives more favorable payment terms
for products or services purchased this year than it has received in the past for
the identical products or services or from the same supplier. Note that when your
company must pay earlier to receive a discount, your company's cost of money
must be factored into the calculation.
Payment Term Savings = {(ND – OD) – [(ON – NN) x (CM/365)]} x SP
Where, ND = New discount where percentages are written as numbers
with two decimal places (e.g., 2% = 0.02)
OD = Old discount where percentages are written as numbers with
two decimal places (e.g., 2% = 0.02)
ON = Old number of days in which payment is due
NN = New number of days in which payment is due
CM = Annual cost of money (i.e., the interest or other return earned
by your company through investing idle cash). This value can be
best estimated by your Finance department.
SP = Spend on the products and/or services to which the new
discount applies
For example, if you spend $10,000 with a supplier who has changed your
payment terms from Net 30 to 2%/10, Net 30 and your annual cost of money is
6%, your Payment Term Savings would be calculated as follows:
Payment Term Savings = {(0.02 – 0.00) – [(30 – 10) x (0.06/365)]} x $10,000 =
$167.12
Substitution Savings: Your company pays a lower price this year for a new
product or service than it has paid in the past for an old product or service that
served the same purpose. Note: If there is a degradation or improvement in
quality as a result of the substitution, you must adjust the savings such that it
reflects any costs or avoided costs as a result of the change in quality.
Substitution Savings = (OP – NP) x QP
Where,
OP = Price for old product or service
NP = Price for new product or service
QP = Quantity of new product or service purchased
Now, you can calculate Substitution Savings through an exercise. In this
scenario, you used to buy for 20 cents each stainless steel nuts and bolts to be
8](https://image.slidesharecdn.com/ssd-140122122522-phpapp02/85/Ssd-10-320.jpg)
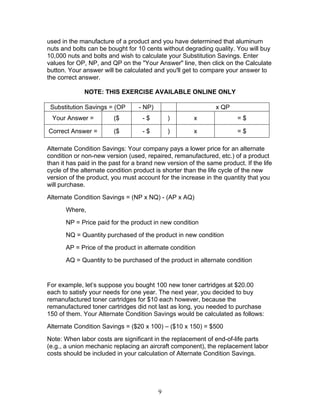

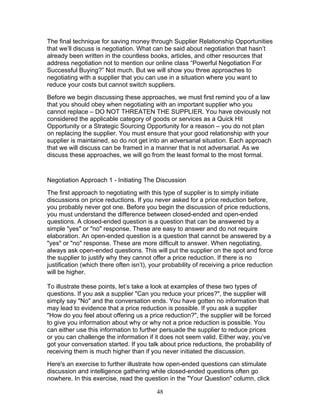
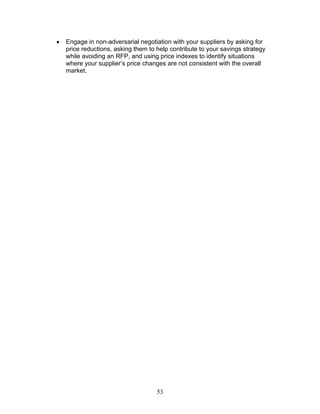
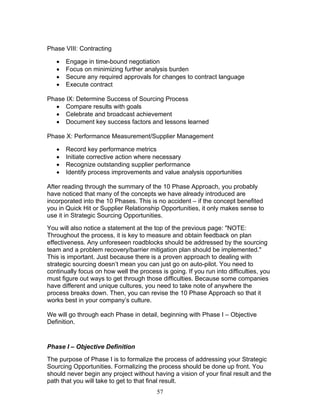
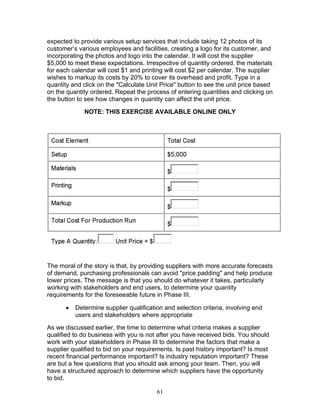
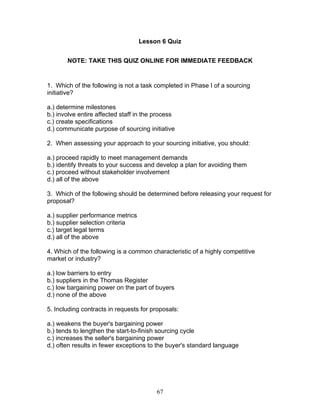
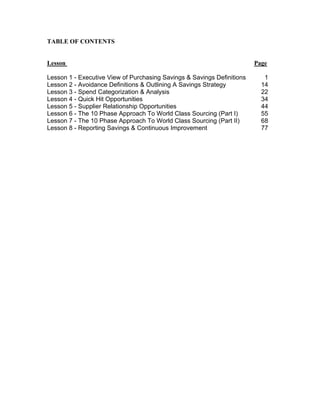
![change in the prices in that commodity or industry. For example, if the BLS starts
tracking prices for online purchasing classes in July 2010, it will assign a value of
100 to the PPI for the online purchasing class industry for July 2010. If prices
increase by 10% from July 2010 to August 2010, the PPI will increase by 10% as
well. Thus, the new PPI for August 2010 would be 100 x 1.10 = 110. If the prices
increased by 20% from August 2010 to September 2010, the new PPI for
September 2010 would be 110 x 1.20 = 132. Then, you could calculate the
percent change between July 2010 and September 2010 by using this formula:
PC = [(LV/PV) – 1] x 100
Where,
PC = Percentage change in prices
LV = Latest value of PPI
PV = Previous value of PPI
If PC is a positive number, prices have increased. If PC is a negative number,
prices have decreased.
Therefore, the percentage change in prices between July 2010 and September
2010 would be calculated as follows:
PC = [(132/100) – 1] x 100
PC = 32%
Prices for online purchasing classes have increased by 32%.
So how can use this data in negotiations? Here’s how. First, find the PPI for a
commodity or industry. Then, find the percentage change over a period of time
for that PPI. Next, calculate the percentage change of your supplier’s prices over
the same period of time. Finally, compare the percentage change of the PPI
against the percentage change of your supplier’s prices. If the PPI increased by a
certain percentage and your supplier’s prices increased by a greater percentage,
you have ammunition for negotiations. If the PPI decreased by a certain
percentage and your supplier’s prices did not decrease by as high a percentage,
you have ammunition for negotiations.
Let’s look at an example of paper purchases over a one year period: October
2006 to October 2007. Let’s say that your price for a carton of paper was $35 on
October 1, 2006 and $36 on October 1, 2007. Also assume that your quantity
requirements did not change. Let’s take a look at the PPI for Paper (Series ID
WPU0913). In October 2006, the PPI value was 170.5. In October 2007, the PPI
value was 169.8. Thus, even though the national average prices for paper
decreased by 0.4%, your price increased by 2.9%. You can share this data with
your supplier and suggest that this objective data makes it reasonable for you to
request a price decrease.
51](https://image.slidesharecdn.com/ssd-140122122522-phpapp02/85/Ssd-53-320.jpg)