SlideShare a Scribd company logo
1 of 12
Download to read offline
European Journal of Business and Management
ISSN 2222-1905 (Paper) ISSN 2222-2839 (Online)
Vol.5, No.25, 2013

www.iiste.org

The Consequences of De-hubbing for Airports and Tourism - a
Case Study
Patrick Bohl
Department of Marketing, Corvinus University of Budapest, Fővám tér 8., Budapest, Hungary
E-mail: patrick.bohl@uni-corvinus.hu
Abstract
The size of airports depends on passenger traffic to and from that city as well as the number of passengers
connecting from one flight to another flight. When hub airports lose a significant amount of connecting flights
(‘de-hubbing’), their growth is negatively affected and in many cases does not reach previous levels. This has
serious implications for the airport operator as well as the tourism industry, which may lose incoming visitors
from markets no longer connected to the airport. The case of de-hubbing of Budapest airport of February 2012
shows that under certain circumstances, very good traffic recovery rates can be achieved. Important drivers for
the recovery rate are the type of airline taking over lost routes, the demand for inbound tourism and capacity
offered on selected markets, and the dominance of a certain type of airline (alliance/low cost). This paper
extends the research done by Redondi et al. (2012), but also has relevance for airport and tourism managers
faced with airline bankruptcy and policy makers.
Keywords: tourism, competition, airline bankruptcy, airport management
1. Introduction
Airports are called hubs, when a significant share of their passengers is travelling neither to nor from their city,
but connect from one flight to another airline. Because such flights carry both connecting and direct passengers,
airlines can serve destinations which without a hub would not be economical. Airports benefit because the
number of passengers and flights being handled grow beyond the natural potential of the destination, because it
is driven by the size of the network of the home airlines. De-hubbing occurs when hub carriers partly or wholly
withdraw from an airport, often caused by bankruptcy, and transfer traffic declines significantly. Many airports
are unable to ever reach traffic levels prior and face serious financial consequences. This paper discusses the
effects of de-hubbing on tourism and the rate of recovery, aiming to answer the following questions:
•

What effect does de-hubbing have on inbound tourism revenues?

•

What are the antecedents of that effect?

•

Does traffic recovery occur in a linear, exponential or S-type fashion over time?

The paper is organised as follows: First we provide a short literature overview and conceptualise the cause-effect
relationships to be discussed. A number of propositions are offered. Then, we present the case of a complete dehubbing when a hub lost its main carrier in early 2012. Next the propositions are discussed in light of the case
study, followed by limitations, managerial implications as well as possibilities for future research.
2. Theoretical background and conceptualisation
The future commercial success of airports is heavily influenced by size of the passenger potential for this airport.
It may be argued that airports offering not only direct flights to and from that city but also connecting flights
have a larger passenger potential. With passengers’ volumes being a strong driver of income, it can be a strategic
objective of an airport to offer connections, and be a ‘hub’. However, decisions to establish hubs and their size
and shape are driven by airlines, and more and more airlines are struggling to make a profit, or even to stay alive.
Caused by a series of crises in the airline industry, starting from the events of September 11th, 2001, followed by
the spreading of SARS, and then an unprecedented increase in kerosene prices in late 2005, airlines have been
under severe pressure. Crises such as these can cause a reduction of an airport’s connections, either by a hub
carrier’s bankruptcy or by the carrier’s choice to restructure their network (Dudden 2006). Despite the serious
negative effects that de-hubbing can have on economic performance, there are only few studies investigating its
effects on the airport. Bahdra (2009) suggested that de-hubbing was a strategy applied by airlines to reduce
losses occurred at multi-hub operations, but does not discuss the impact on affected airports. Borenstein & Rose
(2003) review the effect of bankruptcy in the US (Chapter 11) on air services at airports, and conclude that in
large or small airports, the number of air services is not significantly affected by an air carriers bankruptcy, while
168
European Journal of Business and Management
ISSN 2222-1905 (Paper) ISSN 2222-2839 (Online)
Vol.5, No.25, 2013

www.iiste.org

medium sized airports (defined as having 100 to 400 departing flights/day) are. Redondi et al. (2012) define dehubbing to take place when the number of viable connections per month reduces by 75% compared to any
previous month (covering both cases of sudden and gradual de-hubbing). They identify 37 cases of de-hubbing
during 1997-2009 (small airports or those closing after de-hubbing were excluded), and propose that the
outcome of de-hubbing can be classified into five scenarios: Airports recovering the number of connections are
‘re-hubbed’. Airports dominated by alliances, low cost carriers (LCC) or unallied airlines after five years fall in
to three further distinct categories, and all other cases form the fifth category, termed ‘battleground’. From an
airport perspective, the most favourable outcome was the “low-cost dominated” scenario, which involves LCC
increasing capacity to an extent which makes this the dominant category at the airport. This was the case in
Birmingham, Basel-Mulhouse, East Midlands and Glasgow, which led to Flybe, EasyJet Switzerland, bmibaby
and easyJet to become dominant and overall LCC seats to exceed 50% of capacity. These airports also had the
quickest recovery in number of seats offered. All other scenarios are very negative, and full recovery for those
airports is unlikely (Redondi et al. 2012).
There are, however, a number of drawbacks when airports become low cost dominated. As the tourism industry
in most countries heavily depends on being connected to key sending markets by air as well as sufficient seat
capacity being offered, the loss of a hub can be expected to have a significant impact on tourism revenues, too.
Firstly, some routes will only be viable because of the connections offered by a hub, therefore the airport is likely
to have fewer routes afterwards, and therefore the country will be accessible from fewer inbound markets. These
are likely to be smaller markets, because if they were significant, the routes would probably be viable even
without connecting passengers. Secondly, a lower seat capacity after de-hubbing may lead to price increases of
air tickets, which in turn makes travel to the destination more expensive, leading to fewer inbound tourists (Tan
2012). On the other hand, there could be some positive effects as well. If capacity on a route is suddenly dropped
because of bankruptcy, potential future profits are higher, because re-entry is not likely, and many customers will
be looking for new alternative offers at once. Attractive markets may be entered by several airlines at once,
leading to oversupply, which may then result in lower fares and excess capacity.
•

P1: Sudden de-hubbing followed by capacity dumping on certain air markets increases inbound tourism
from those markets.

Next, a dominant hub airline may discourage competitive market entry, and lead to higher price levels
(Borenstein 1989, Evans & Kessides 1993). The absence of a dominant carrier would consequently lead to more
competition and – assuming no new dominant player appears – lower fares at higher seat availability, both
benefiting inbound tourism. We propose that:
•

P2: Recovery of inbound tourism is stronger after de-hubbing when the airport is not dominated by an
airline/alliance then if it is dominated afterwards.

If the growth is fuelled by a LCC, it is worth to compare the effect their different business model has on tourism.
LCC tend to use larger aircraft on short haul flights then others. Therefore, an increase of the share of LCC with
equal frequencies leads to more seat capacity offered. LCC also realise higher seat occupation, and due to a
higher ancillary revenue (such as excess baggage fees etc.) and lower operating costs than traditional airlines are
able to sell seats at lower fares, this stimulating local traffic more successfully than traditional carriers. We
therefore propose:
•

P3: De-hubbing followed by a significant increase of the LCC share increases inbound tourism

Next we turn to aspects of recovery. By definition, de-hubbing consists of a company exiting several air travel
markets. With air travel being a highly competitive industry, we assume most incumbents are actively monitoring
competing players, and aware of the dynamic nature of competition (Roberts et al. 2005). Therefore de-hubbing
is likely to first (phase 1) result in a wave of reactions from incumbent firms as well as market entry by new
firms. We consider each destination connected to the airport before by a non-stop flight to be an individual
market. After de-hubbing, markets could remain either completely unserved, other markets could become
massively competitive (for example when both incumbent airlines increase capacity and new airlines enter) and
some markets could change into a monopoly (for example when only one airline is permitted to fly due to
regulatory or technical restrictions). Other markets will retain a ‘normal’ level of competition. Furthermore, one
could assume that in the second case, prices will decrease on the market – leading to a stimulation of passenger
traffic – while in the third case, prices will increase. Then, in phase two, the market players will have had time to
gain experience with the new market situation, and have made a further range of entry/exit decisions. Due to the

169
European Journal of Business and Management
ISSN 2222-1905 (Paper) ISSN 2222-2839 (Online)
Vol.5, No.25, 2013

www.iiste.org

need to scheduling aircraft and crew as well as sell tickets well in advance, the second ‘wave’ of reactions is
likely to be 6 - 12 months after phase one.
A most relevant question for the airport is if the recovery rate of the overall traffic in phases one and two. To
determine this, assumptions need to be made about the competitive intensiveness and capacity offered for the
respective markets, over time. This, in turn, requires an understanding of the attractiveness of the markets
affected by de-hubbing. Because all players have more understanding of the attractiveness of markets, and also
some or all players on markets will have occurred losses during a first phase, it is most likely that overall
capacity and competition will decrease in a second phase. Irrespective of the size of the recovery rate, we
therefore postulate that:
•

P4: The rate of traffic recovery after de-hubbing will first increase, then decrease, then increase again over
time (S-shape).

Next we will discuss these propositions in further detail and test their application in a recent case of de-hubbing.
The case study methodology is an “empirical inquiry that investigates a contemporary phenomenon within its
real-life context; when the boundaries between phenomenon and context are not clearly evident; and in which
multiple sources of evidence are used” (Yin 1984, p. 23). It is appropriate to use in this case, because the existing
knowledge of de-hubbing is still limited, and there are no generally accepted conceptual frameworks explaining
the causes and effects, to the best of our knowledge. Also, the two cases presented here are unique, and were
selected with the intention to give suggestions for further research, which could lead to a general model (Hamel
et al. 1993). The case method has certain limitations, including a lack of generalizability of the results and the
bias caused by the researcher’s extensive exposure to the cases. We consider the insights from these cases to be
important enough in the development of new knowledge to outweigh the drawbacks, and encourage reading on,
with the above limitations in mind.
3. Budapest airport – a case of sudden de-hubbing12
On 3rd February, 2012, the main hub carrier of Hungary’s Budapest airport stopped operations due to lack of
funds. At that time, the airline accounted for 37% of the airport’s annual passenger traffic, and carried most of
the airport’s 3.2 million transfer passengers. The airport also lost it’s only two long-haul airlines American
Airlines and Hainan Airlines as a result of the weakened connectivity at the hub, and transfer traffic reduced by
99% immediately (see Table 3). Malév’s network consisted of a wide range of routes in Europe and the Middle
East, and its schedule structure was optimized to allow efficient connections in the North-South and West-East
directions. At a route level, however, the share of transfer passengers differed significantly. Some destinations
carried very few transfer passengers, which could be caused by either a high demand of the local market segment,
or a lack of connectivity, others had a very high share of transfer passengers. Because no other airline offered the
possibility to connect in Budapest, the routes with a high transfer share were the most likely to remain unserved.
Malév operated on 45 routes with own aircraft. By the following summer season, 19 new routes have been
announced by 5 new airlines. The most significant announcement was made by Ryanair’s CEO who promised a
“rescue plan for Budapest and Hungary tourism” (Anonymous 2012), subsequently launching 28 routes within
weeks. By mid-summer, 13 incumbent airlines increased frequencies on their routes. 16 routes have not been
taken over at that time, and also 18 months later, still 14 routes are non-served. Budapest’s biggest carrier, Wizz
Air stated that a new aircraft joining their Budapest base in March 2014 will only be used to increase the
frequency of existing routes (Landry 2013). This suggests that within two years after the event, all market
opportunities caused by the demise of Malév may have been taken up, and therefore the recovery process may
have largely been completed.
We will now further discuss the five propositions suggested above, and assess if they can be upheld in this
particular case of sudden de-hubbing. The intention is to give further substance to the proposed relationships,
and suggest them for further investigation using a larger sample.
Capacity dumping and inbound tourism
Starting from February 2013, carriers started to add new routes and increase capacities on existing routes. It
12

All data related to schedules and routes to/from Budapest were obtained from the airport’s operator Budapest Airport Zrt.,
between August and September 2013, unless otherwise marked in the text.

170
European Journal of Business and Management
ISSN 2222-1905 (Paper) ISSN 2222-2839 (Online)
Vol.5, No.25, 2013

www.iiste.org

could be expected that market forces lead to attractive markets receiving a higher increase in capacities than less
attractive markets, which in some cases may also lead to an excess in capacity, which we term capacity dumping.
For the purposes of this paper, capacity dumping is defined as increasing air service capacity between two
countries in a way which leads to total annual capacity being 15% more compared to the year before. The value
of 15% was chosen, because this mark is significantly higher than European tourism growth and average GDP
growth in any European market, therefore indicating that capacity increases do not follow market demand, but
are likely to be a strategic move in the competitive interaction by airlines, involving excess supply. We compared
the change of annual departing seat capacity at Budapest airport for the full year 2012 compared to previous year
with the change of registered international visitors at Hungarian hotels during the same period. Although 2012
full year data includes one month before de-hubbing (January 2012) we still decided to use annual data, because
tourism data was available only for a full year. We identified six markets (see Table 4), and while average growth
of international visitors to Hungary increased by 15.9%, three out of these markets grew by between 23% and
29% (Norway, Belgium and Ireland). The other markets (Spain, Italy and Poland) suggest that Hungary may be
more attractive as a holiday destination in these Northern markets, while flights to Spain and Italy may be easier
sold to Hungarian holidaymakers. The increase to Poland could be explained by increases by Poland’s home
carrier aiming to carry Malév’s past traffic via their hub in Warsaw, but also by Ryanair and Wizz Air “fighting
hard for leadership in Hungary and Poland” (Anker 2012, p.1). Therefore capacity dumping is likely to lead to
growing international visitors in case of markets with a sufficient demand for inbound travel, but not in case of
typical outbound markets, such as Spain.
In total, annual capacity was 6.8% lower than previous year, dropping from 5.7 to 5.3 million seats on departing
flights. The average growth rate varied quite significantly from country to country, and some countries had
increases of up to 100.000 seats per year (United Kingdom) while others declined by almost 100,000 (Romania).
Figure 1 plots each country connected by flights to Hungary on one axis showing the incremental number of
seats offered in 2012 to Budapest and on the other axis showing the incremental visitors coming from that
country compared to the previous year.
The mean change of capacity per route was -18,449 seats, with a standard deviation of 42,945. The markets
increasing significantly were U.K., Belgium, Spain and Italy, which probably seemed attractive enough for
several carriers to enter the markets with high capacities. The markets most negatively affected were all in
Eastern and Southern Europe (Ukraine, Romania, Serbia, Czech Republic, Bulgaria, and Greece). These were
served by flights of Malév which carried predominantly transfer passengers and were not attractive enough for
point to point carriers. 8 of 41 countries showed a growth of over 10.000 seats, 19 showed a decline of over
10.000 seats and the remainder was between the two categories (‘stable’). Where capacity grew, visitor numbers
grew, or in one case remained stable (‘stable’, defined as less than 5.000 visitors growth or decline). Where
capacity declined, also visitor numbers declined or remained stable, except in 6 cases. Three of these countries
were neighbours, suggesting that not air travel but land transport drives inbound tourism. The other three
countries are Russia, Sweden and Turkey. In these cases, Malév stopped flying, and only the incumbent carrier
remained, which in case of Russia and Turkey was their home carrier, which naturally carried a larger percentage
of inbound passengers. Sweden’s increase cannot be easily explained. Possibly this is an outlier, where other
external factors (such as a strong increase of the demand in Sweden) could play a role.
Losing a dominant airline and inbound tourism
Redondi et al. (2012) assigns airports with no dominant carrier after de-hubbing to the ‘battleground’ category,
which involves competition among airlines and is the least preferable outcome for airport operators. Contrary to
that, we argue that the loss of a dominant carrier may actually increase inbound tourism. To investigate this, we
compare the case of Budapest airport with the de-hubbing case of nearby Prague airport, which occurred at about
the same time. Budapest airport falls into the category of ‘battleground’ (LCC occur for 45%, the largest alliance
group accounted for 22% of the seats), while Prague airport falls into the alliance dominated group (51% of the
seats) even after de-hubbing.
Traffic at the airport started to decline at the start of the winter season 2008, when ČSA faced major financial
difficulties. The airline started a wide ranging restructuring programme, which was aimed at preparing the carrier
for privatisation and avoiding bankruptcy. In April 2013, 44% of the company’s shares were acquired by Korean
Airlines Co., Ltd. and new routes were launched in the same year which may lead to a gradual re-hubbing of the
airport (e.g., Prague-Seoul). For this investigation, we determine the start of de-hubbing to be the first month
showing a decline of overall traffic of more than 10%, and the end a growth of over 10%. Between September
171
European Journal of Business and Management
ISSN 2222-1905 (Paper) ISSN 2222-2839 (Online)
Vol.5, No.25, 2013

www.iiste.org

2008 and May 2013 the number of destinations by ČSA reduced from 65 to 41 (-37%). The number of transfer
passengers at Prague airport in May 2013 was 70% less than during the same period 5 years prior, and only
represent a share of 6% of the total traffic. The total traffic is 15% less than before de-hubbing.
ČSA cancelled routes which were probably either not viable without a hub as they were not taken up by other
carriers (e.g., Bologna, Cairo), routes which were taken up by others (e.g., Riga, Venice) and routes which were
probably profitable but had to be given up as a compensation for the negative effect of state aid on other airlines
(e.g., Munich, London, see European Commission 2012b).
In both cases discussed here, de-hubbing has led to the main national carrier’s share of the airport’s annual traffic
declining. In the case of Budapest, Malév’s share dropped from a stable 41-44% during the years 2007-2011 to
nothing in February 2012, while ČSA’s reduction of capacity in 2008 and 2009 first did not lead to any reduction
in share because other airlines reduced, too, but then dropped from 48% in 2009 to 43% (2010), 40% (2011) and
then 29% (2012).
Figure 2 shows the share of the airline at the respective hub in the primary vertical axis and the growth of visitors
in the respective country in the secondary vertical axis. The plot suggests that tourism growth is not related to the
share of a dominant airline in the case of neither airport. In fact, both countries’ visitors grew while the share
declines in 2012 compared to the previous year. This approach therefore provides no evidence for Proposition 2.
However the approach contains some limitations. Firstly, the tourism data used is on a national level. The Czech
Republic has a number of other significant international airports, and also a number of tourist centres which are
not close to Prague airport, while a significant proportion of Hungary’s tourism is concentrated on the Budapest
area and Balaton (2 hours from Budapest). Secondly, tourism data includes a significant share of visitors using
ground transportation, which strongly influences these results.
Higher LCC share and inbound tourism
Proposition 3 assumes that after de-hubbing, a higher share of LCC capacity has a positive effect on the growth
rate of tourism, which could be operationalized as a positive relationship between LCC capacity and the growth
rate of inbound visitors to the region. We ran a linear regression using 24 months of data (January 2011December 2012) which included 13 months of data before and 11 months after de-hubbing. The results showed
no significant relationship between the two, and a very low R square. Next we compared inbound visitors growth
before (10 months data) and after (10 months data), and found that there was no significant difference between
the means of the two periods (M1=0.115, SD1=0.064, M2=0.092, SD2=0.028). We can therefore conclude that
the growth of inbound visitors is not driven by the share of LCC at an airport.
Recovery of lost transfer traffic over time
We investigated the relationship between time (independent variable) and the rate of recovery (the number of
incremental passengers during a given month compared to the number of transferring passengers during the same
month in the year before de-hubbing, dependent variable). We hypothised the relationship to be S-shaped,
involving first a positive, then a negative sign. When plotting the recovery rate against time, data points almost
exactly follow an S-shape during the first 10 months. After that, however, recovery rate drops steeply and then
shows a high variation from month to month. How can this be explained? Essential to the recovery process at
Budapest airport was the fast reaction by Ryanair to base 5 aircraft and launch 28 destinations only weeks of the
de-hubbing taking place. Two of these aircraft were removed again in November, leading to a temporary drop in
recovery rate. The rate increases again from February – one year after the exit – because by this time, also
airlines with a longer planning cycle have had time to adjust their flying programme and launched new routes.
Finally, three high frequency routes (Moscow, Istanbul, Tel Aviv) could be recovered only over one year after the
exit due to bilateral restrictions. The Hungarian government designated Wizz Air as the Hungarian carrier on
these routes, which was accepted by the other countries only after lengthy negotiations. This positive effect was
sufficient to compensate the negative effect of the above mentioned Ryanair cutback.
Before estimating a regression model, we considered to control for these effects, for example by excluding
Ryanair traffic, which seems to be highly influenced by negotiations with the airport. On the other hand
negotiations may have taken place with many airlines, and in fact the recovery at airports is driven by airlines
such as Ryanair moving in. We therefore did not adjust the data, but advise to analyse with the above comments

172
European Journal of Business and Management
ISSN 2222-1905 (Paper) ISSN 2222-2839 (Online)
Vol.5, No.25, 2013

www.iiste.org

in mind. A series of regression models were ran with SPSS 20. Data consisted of the rate of recovery of each
month between February 2012 and July 2013 (n=18). A rate of recovery of 1 means that traffic growth has fully
compensated the lost transfer traffic of the given month. In order to test the s-shape, we first propose a cubic
model, described with Y’ being the predicted rate of recovery as:

Y ' = a + b1t + b2t 2 + b3t 3

(1)

Results for the cubic model are encouraging despite the outliers as discussed above (R2=.480, 17 d.f., P<0.05).
In order to assess if other regression models provide a better fit, we also ran a linear, quadratic, logarithmic and
s-curved regression (see Table 7 for results). Surprisingly, a quadratic model involving the recovery rate to first
increase, and then drop again, delivers very similar results (R2=.455, 17 d.f., P<0.05). This equation however
would mean that recovery peaks, and then continues dropping. IBM/SPSS 20 also offers an s-curve regression
model, which assumes the following relationship:
2

Y '=e

a+

b1
t

(2)

The increase in R from the cubic to the S-curved equation is significant (P<0.01) suggesting the s-curve model
explains more of the data’s variation. Next we use Akaike’s Information Criterion (AIC) to compare the models
(Motulsky & Christopoulos 2004). Based on information theory, the AIC assesses the goodness of fit of models,
while also penalising for the number of estimated parameters, thus preferring a simpler model unless justified.
The S-curve model reaches the lowest AIC value, and is therefore the preferred one.
The parameters were estimated to be b0 = 0.0484, b1 = -2.677 (R2=.828, 17 d.f., P<0.001). This assumes that full
recovery will be reached within 19 months. Despite the curve model being S-shaped, the parameters lead to no
period with actual decline in recovery rate, therefore we cannot find evidence for Proposition 4.
4. Findings and Discussion
The case presented here illustrates effects of a sudden de-hubbing on the airport’s traffic development within the
first 18 months, as well as subsequent changes in the volume of international visitors to the country. In recent
years, the number of de-hubbing cases has been increasing, and have serious financial consequences for airport
operators (Redondi et al. 2012). This case involves an airline bankruptcy, which led to transfer traffic dropping
by 99% and the share of low cost traffic to that airport increasing from 26% to 52% within a few months. Then,
one year after de-hubbing took place, the supply of air services was again adjusted. By that time, all airlines had
time to react to the new market situation, but also some airline reduced routes or frequencies after unsatisfactory
results during the first phase. This led to the share of LCC dropping again. The recovery rate of lost transfer
traffic exceeded 80% for most of the second year, as point-to-point traffic increased strongly. In year one, seat
capacity was down only 8.9%.
This is an exceptionally strong recovery, compared to similar cases. Following the classification of Redondi et al.
(2012), this airport faced a ’battleground’ situation, and four similar cases on average have experienced seat
capacity reductions of 21.0% in year one, and 22.3% in year two, namely Albany, Orlando, New Orleans and
Milan Malpensa (Redondi et al. 2012). The de-hubbing was complete and sudden, which – compared to a case of
gradual de-hubbing– gave entrants a signal that re-hubbing by the same airline was impossible, and that large
segments could be attracted quickly. A wave of new airlines and new routes were brought to the airport at the
same time, which also stimulated traffic with low fares. In comparison to a ‘slow and painful’ de-hubbing, this
may be a preferred scenario in terms of traffic recovery. Recovery of traffic does seem to follow an S-curve
model, which over time first increases at a high rate, then at a lower rate, and again at a higher rate. Full recovery
was calculated to be reached after 19 months. The scatter plot (Figure 3) suggests that there is a strong seasonal
effect, and future research should consider correcting for these effects. However the approach presented points
into an important avenue for further research, as not only the antecedents of traffic growth, but also drivers of the
shape of the recovery curve contain important information for airport planning.
Because 99% of the country’s air services use this airport, this case also allows to analysis the direct relationship
between capacity and inbound tourism. We have not yet identified any study investigating the effect of dehubbing on inbound tourism. As expected, increases of seat capacity of air services lead to an increase of
inbound visitors from that country. The strength of the relationship is likely to be mediated by the relative
attractiveness of the origin and the destination country, because routes to for example Spain have led to less
increases of inbound tourism then routes to Belgium. In the case discussed, inbound visitor number has increased
by 9% in the first year after de-hubbing, while the airport’s capacity has decreased by 9%. While the airport is

173
European Journal of Business and Management
ISSN 2222-1905 (Paper) ISSN 2222-2839 (Online)
Vol.5, No.25, 2013

www.iiste.org

struggling to recover, it appears that the tourism industry has overall benefited from the de-hubbing, despite the
significant economic negative effects in other sectors. A study conducted in Hungary calculated the spending of
visitors arriving by air, including items such as accommodation, meals, buying souvenirs and so on. In 2009 the
spending of arriving visitors by air was on average 516 EUR. This figure includes direct and indirect effects of
tourism spending (Dusek et al. 2010). Multiplying this figure with the actual number of incremental visitors in
2012 suggest the growth of tourism has led to an incremental spending of 170m EUR. In contrast to this, the
Hungarian government estimated the economic effect of losing the national airline Malév to be 46-62 m EUR
(tourism revenues and payments to Malév suppliers, Ministry of National Development 2011).
Interestingly, the two cases Malév (sudden de-hubbing at Budapest) and ČSA (gradual de-hubbing at Prague)
have both been investigated by EU authorities (European Commission 2012a, 2012b), with the outcome
supporting the changes introduced by ČSA (announced in September, 2012) but not supportive of Malév
(announced in January, 2012). As expected by the Hungarian government (Ministry of National Development
2011), this verdict triggered the airline’s bankruptcy. While a detailed comparison of the two decisions is out of
scope, the EU’s reasoning for supporting the changes at ČSA is probably related to the significant compensation
which it offered to competitors. This included a commitment to reduce aircraft fleet by more than 50% between
2009 and 2014, to eliminate or reduce its capacity on 16 profitable routes and to forego slots at London
Heathrow (against a fee) and other congested airports (without a fee, European Commission 2012b). The
intention behind these measures was probably to ensure effective competition leading to market level prices.
From an airport’s perspective, however, this approach has led to a reduction of 26% in movements and 14% in
passengers during the first four years of restructuring (as of 2012 full year). The study by Redondi et al. (2012)
allows benchmarking this outcome against other comparable de-hubbing scenarios. The authors categorised
cases depending on the market situation afterwards, and calculated the change of seats offered (cleaned for
effects of seasonality) over 4 years since de-hubbing. The average recovery rate by airports with no dominant
airline segment (low-cost, unallied, alliance) was a capacity reduction of 25%. Prague airport’s traffic declined
by 19% (2012 vs. 2007) which is worse than Budapest which is has a positive growth within two years since dehubbing. One could argue that the ’slow and painful’ de-hubbing scenario favoured by the EU Commission has
resulted in the worst possible outcome for the airport in terms of traffic. It should be noted, however, that the
Czech government – majority owners of both ČSA and Prague Airport, may have overall benefited, for example
due to the national airlines direct and indirect contribution to the countries’s GDP and employment, while
Malév’s bankruptcy affected 2600 employees. On the other hand, the overall growth perspectives of airports are
much higher in the presence of a hub, and therefore in the long term, re-hubbing, such as in the case of Zurich
after the demise of Swissair (Dennis 2005), may lead to better results for the airport operator. From the
perspective of a tourism, which is only indirectly benefiting from connecting flights, the above effects suggest
that the EU ruling against Hungary may have been a blessing in disguise for the local tourism industry.
5. Limitations and directions for further research
The approach presented in this paper has a number of limitations. As with each case study it is only an
illustration of a one off event, and may not be comparable to other situations. Traffic recovery is dependent on
many other factors, such as the attractiveness of the destination, economic strength of the country and main
trading partners, airport charges and incentives, available fleet by potential new airlines and so on. These were
not discussed in this paper. The relationship between inbound visitors and seat capacity does not consider that a
majority of visitors arrive by land transport. While access to data for inbound tourism by air is often difficult,
this could improve the strength of the relationship further. With this case being relatively recent, only 18 months
of data was available and another review of the long term effects of de-hubbing may be desirable.
This paper was intended to provoke further research into the antecedents and effects of de-hubbing. Firstly, we
suggest investigating the impact of de-hubbing on tourism using a larger sample of airports. Secondly, we noted
that the sudden de-hubbing scenario presented here was followed by an exceptionally fast recovery. We propose
to investigate how the type of de-hubbing (sudden vs. gradual) influences the rate and magnitude of traffic
recovery with a larger sample of airports.
6. Conclusion
This paper investigates a case of sudden de-hubbing, where the bankruptcy of an airport’s only hub airline led to
the loss of practically all connecting flights. Recovery was exceptional, and 80% of lost transfer traffic was

174
European Journal of Business and Management
ISSN 2222-1905 (Paper) ISSN 2222-2839 (Online)
Vol.5, No.25, 2013

www.iiste.org

recovered about one year after the event, leaving the airport with a seat capacity of only 8.9% less than during
the last year before. The recovery continues and a regression based forecast suggests that full recovery takes 19
months. Airports in comparable situations (Albany, Orlando, New Orleans and Milan Malpensa, Redondi et al.
2012) have experienced seat capacity reductions of 21% in year one, and 22.3% in year two. The route network
of the airport changed, with a significant number of unviable routes remaining unserved, but others having been
taken over by other airlines, in some cases leading to capacity dumping. In these cases, paired with demand for
tourism to Hungary (e.g., from Belgium, U.K. and Norway), the stimulated traffic also led to over proportional
increases in inbound tourism. The share of low cost traffic increased significantly, but 18 months after the event,
the airport is dominated by neither LCC, nor alliance members.
The paper’s contribution is that is investigates the effects of de-hubbing on tourism, which to our knowledge has
been published to date. It analyses a case of de-hubbing which compared to most other cases (Redondi et al.
2012) seems to have had a favourable outcome for the local tourism industry. In fact, the additional income of
tourism to the affected country was so significant, that one may be pushed to conclude that tourism income
develops independently of the presence of a hub airline in some cases, or – in case of that airline’s bankruptcy –
may lead to scenarios which are positive for the tourism industry. While the airport’s operator handled 9% less
capacity, the number of international visitors grew by 9%, who spent an estimated 170 m EUR more in the
country then in the year prior to de-hubbing. At the same time, however, de-hubbing leads to lack of access to a
number of markets, serious negative impacts on the competitiveness of the country’s economy and trade
relations as well as reduces employment. These effects, however, were out of scope for this study.
References
Anonymous (2012), “Less than seven hours after Malev collapse, Ryanair announces new Budapest base”, The
Journal, Dublin. Retrieved online from http://jrnl.ie/345179 on 7-9-13.
Anker, R. (2012), “Wizz Air still #1 LCC in most of its ‘home’ markets”, Airline Network News and Analysis,
Top Story, 30-5-2012, retrieved online from http://www.anna.aero/2012/05/30/wizz-air-still- number-1-lcc- inmost-of-its-home-markets/ on 3-9-13.
Bhadra, D. (2009), “Race to the bottom or swimming upstream: performance analysis of US airlines”, Journal of
Air Transport Management 15 (5), 227-235.
Borenstein, S. (1989), "Hubs and High Fares: Dominance and Market Power in the U.S. Airline Industry," Rand
Journal of Economics 20 (3), 344-365.
Borenstein, S. & Rose, N. (2003), “The Impact of Bankruptcy on Airline Service Levels”, American Economic
Review Papers and Proceedings 93 (2), 415-419.
Dennis, N. (2005), “Industry consolidation and future airline network structures in Europe”. Journal of Air
Transport Management 11, 175-183.
Dudden, J.C. (2006), “Multi-hub network configurations – a temporary or permanent outcome of airline
consolidation?” Review of Network Economics 5, 421-434.
Dusek, T., Lukovics, M., & Bohl, P. (2011), “The economic impact of the Budapest Airport on the local
economy”, proceedings of ERSA Conference, 09/2011, European Regional Science Association.
European Commission (2012a), “Commission Decision of 09.01.2012 on the State Aid Implemented by Hungary
In favour of Malév Hungarian Airlines Zrt.”, Brussels.
European Commission (2012b), “Commission Decision of 19.09.2012 on the State Air No SA.30908, ČSA –
Czech Airlines – Restructuring plan”, Brussels.
Evans, W.N. & Kessides, I. (1993) “Localized Market Power in the U.S. Airline Industry” Review of Economics
and Statistics 75, 66-75.
Hamel, J., Dufour, S. & Fortin, D. (1993), “Case study methods”, Newbury Park, CA: Sage.
Landry, D. (2013), “Wizz Air CEO: ‘No reasonable chance’ for Sólyom success”, Budapest Business Journal, 69-2013, retrieved online from http://www.bbj.hu/business/ on 7-9-2013.
Ministry of National Development (2011), “White Paper on the Malév Heritage”, Ministry of National
Development, Hungary, November 2011, retrieved online from http://www.nfm.gov.hu on 7-9-2013.
Motulsky, H. & Christopoulos A. (2004), “Fitting models to biological data using linear and nonlinear
175
European Journal of Business and Management
ISSN 2222-1905 (Paper) ISSN 2222-2839 (Online)
Vol.5, No.25, 2013

www.iiste.org

regression”, Oxford: Oxford University Press.
Redondi, R., Malighetti, P. & Paleari, S. (2010), “De-Hubbing cases and recovery patterns”, working paper 082010, Department of Economics and Technology Management, University of Bergamo, 12p.
Redondi, R.,Malighetti, P. & Paleari, S. (2012), ”De-hubbing of airports and their recovery patterns”, Journal of
Air Transport Management 18, 1-4.
Roberts, J., Nelson, C. & Morrison, P. (2005), “A Prelaunch Diffusion Model for Evaluating Market Defence
Strategies”, Marketing Science 24 (1), 150-164.
Simon, Z. (2012), “Malev Airline Stops Services After 66 Years as Hungary Moves to Cut Losses”,
bloomberg.com, 3-2-2012, retrieved from http://www.bloomberg.com/news/2012-02-03/malev-stops- flyingafter-66-years-as-hungary-cuts-its-losses.html on 5-9-2013.
Tan, K.M. (2012), “The Effect of De-Hubbing on Airfares”, working paper, Department of Economics, The Ohio
State University, retrieved from http://ssrn.com/abstract=2102893 on 16-8-2013.
Vovlew, T.M. (2001), “The ‘Southwest Effect’ in multi-airport regions”, Journal of Air Transport Management 7,
251-258.
Yin, R.K. (1984), “Case study research: Design and methods”, Newbury Park, CA: Sage.

Table 3. Monthly Passengers at Budapest Airport and Transfer Share (2011-2012)
January
2011 Total Passengers
Malév Passengers
Transfer Share
2012 Total Passengers
Malév Passengers
Transfer Share

February

March

April

May

June

July

August

September October

November

December

TOTAL

526,921

487,858

637,468

734,461

776,704

827,457

950,396

958,559

894,188

845,815

646,171

634,655

8,920,653

172,993

156,336

218,801

260,525

261,125

290,717

362,194

359,923

344,698

343,936

252,601

255,533

3,279,382

15%

14%

13%

16%

14%

16%

20%

19%

18%

20%

17%

18%

568,782

424,633

580,977

712,064

758,243

795,679

892,015

895,183

840,417

796,721

642,326

596,980

8,504,020

230,840

13,354

0

0

0

0

0

0

0

0

0

0

244,194

20%

2%

0%

0%

0%

0%

0%

0%

0%

1%

1%

0%

source: Budapest Airport data

Table 4. Largest Growing Markets to/from Hungary (Seat Capacity and Visitors)
Markets
Norway

2012 Capacity to/from Hungary2012 Int'l visitors to Hungary
Seats
Visitors
growth (%)
growth (%)
82,512

50.5%

44,916

26.4%

Spain

254,726

46.7%

143,604

7.2%

Belgium

294,711

38.1%

71,257

23.0%

Poland

163,264

31.0%

194,035

8.6%

Ireland

120,897

18.5%

20,160

28.6%

Italy
504,318
17.5%
229,022
16.0%
source: based on data from Budapest Airport and National Statistics Office (KSH)

176
European Journal of Business and Management
ISSN 2222-1905 (Paper) ISSN 2222-2839 (Online)
Vol.5, No.25, 2013

www.iiste.org

Figure 1. Scatter Plot of Routes to/from Budapest airport (Capacity/Visitors)

source: based on data from Budapest Airport and National Statistics Office (KSH)

Table 5. Relationship between Change of Seat Capacity and International Visitors (2011-2012)

BUD dep. seat
capacity

No. of
Internationall visitors to Hungary
countries Declining
Stable
Growing
Growing

0

1

7

Stable

0

12

2

Declining

2

11

6

source: based on data from Budapest Airport and National Statistics Office (KSH)

Table 6. Decline of Passenger Traffic and Flights at Prague Airport (2009-2013)
Percentage of reduction vs. May '08 - Prague Airport
May '09

May '10

May '11

May '12

May '13

Passengers

-14%

-12%

-6%

-19%

-15%

Transfer Pass.

-7%

-2%

-10%

-66%

-70%

Flights

-11%

-13%

-20%

-31%

-28%

source: Prague Airport

177
European Journal of Business and Management
ISSN 2222-1905 (Paper) ISSN 2222-2839 (Online)
Vol.5, No.25, 2013

www.iiste.org

Figure 2. Annual Visitors (Hungary/Czech Rep.) vs. Airport Traffic (BUD/PRG)

source: based on data from Budapest airport, National Statistics Office (KSH) and Prague Airport

Table 7. Fit of Alternative Regression Models (Y=recovery rate, t=time)
Model
Linear
Quadratic
Cubic
Logarithmic

Y = b0 + (b1 * t)
2
Y = b0 + (b1 * t) + (b2 * t )
2
3
Y = b0 + (b1 * t) + (b2 * t ) + (b3 * t )
Y = b0 + (b1 * ln(t))

Equation

S

Y = exp

(b0 + (b1/t))

R Square
.225
.455***
.480***
.429**

Std. Error
.214
.186
.188
.184

.828*
.292
* significant at p<.001,** at p<.01, *** at p<.05.

AIC
-51.544
-55.893
-54.712
-57.052
-40.484

Figure 3. Plot of Transfer Traffic Recovery Rate Against Time and Regression Curves

178
This academic article was published by The International Institute for Science,
Technology and Education (IISTE). The IISTE is a pioneer in the Open Access
Publishing service based in the U.S. and Europe. The aim of the institute is
Accelerating Global Knowledge Sharing.
More information about the publisher can be found in the IISTE’s homepage:
http://www.iiste.org
CALL FOR JOURNAL PAPERS
The IISTE is currently hosting more than 30 peer-reviewed academic journals and
collaborating with academic institutions around the world. There’s no deadline for
submission. Prospective authors of IISTE journals can find the submission
instruction on the following page: http://www.iiste.org/journals/
The IISTE
editorial team promises to the review and publish all the qualified submissions in a
fast manner. All the journals articles are available online to the readers all over the
world without financial, legal, or technical barriers other than those inseparable from
gaining access to the internet itself. Printed version of the journals is also available
upon request of readers and authors.
MORE RESOURCES
Book publication information: http://www.iiste.org/book/
Recent conferences: http://www.iiste.org/conference/
IISTE Knowledge Sharing Partners
EBSCO, Index Copernicus, Ulrich's Periodicals Directory, JournalTOCS, PKP Open
Archives Harvester, Bielefeld Academic Search Engine, Elektronische
Zeitschriftenbibliothek EZB, Open J-Gate, OCLC WorldCat, Universe Digtial
Library , NewJour, Google Scholar

More Related Content

What's hot

Diversify, Differentiate, Innovate: Airport Strategies for Success in a New W...
Diversify, Differentiate, Innovate: Airport Strategies for Success in a New W...Diversify, Differentiate, Innovate: Airport Strategies for Success in a New W...
Diversify, Differentiate, Innovate: Airport Strategies for Success in a New W...williamtebest
 
Types of airlines and airline business models
Types of airlines and airline business modelsTypes of airlines and airline business models
Types of airlines and airline business modelsMirza Rihad Ali Sunny
 
Airfares Global Distribution Strategy for Higher Incremental Revenues in Non-...
Airfares Global Distribution Strategy for Higher Incremental Revenues in Non-...Airfares Global Distribution Strategy for Higher Incremental Revenues in Non-...
Airfares Global Distribution Strategy for Higher Incremental Revenues in Non-...Simon Riha, MSc, MBA
 
Airport Capacity, who is in Control?
Airport Capacity, who is in Control?Airport Capacity, who is in Control?
Airport Capacity, who is in Control?Ruben Portz
 
Airline iindustry scenario
Airline iindustry scenarioAirline iindustry scenario
Airline iindustry scenarioMarinet Ltd
 
Airline services marketing by domestic and foreign firms differences
Airline services marketing by domestic and foreign firms differencesAirline services marketing by domestic and foreign firms differences
Airline services marketing by domestic and foreign firms differencestessaslan
 
Paper journal of advanced transportation
Paper journal of advanced transportationPaper journal of advanced transportation
Paper journal of advanced transportationpacagnella
 
Ryanair Presentation 2012
Ryanair Presentation 2012Ryanair Presentation 2012
Ryanair Presentation 2012Samanta Balina
 
Black book Graduation Project
Black book Graduation ProjectBlack book Graduation Project
Black book Graduation ProjectRuchita Sangare
 
conseq
conseqconseq
conseqtedka3
 
Management Consultancy Report
Management Consultancy ReportManagement Consultancy Report
Management Consultancy ReportPeter Gilbey
 
Air france international strategy analysis (2014)
Air france international strategy analysis (2014)Air france international strategy analysis (2014)
Air france international strategy analysis (2014)Steph Nass
 
Strategic Analysis of Ryan Air
Strategic Analysis of Ryan AirStrategic Analysis of Ryan Air
Strategic Analysis of Ryan AirRahiq Ahmed
 
Lufthansa Case Study
Lufthansa Case StudyLufthansa Case Study
Lufthansa Case StudyDonnych Diaz
 
Internationalization of civil aviation
Internationalization of civil aviationInternationalization of civil aviation
Internationalization of civil aviationkluchaninova
 
Marketing for travel and tourism 2015
Marketing for travel and tourism 2015Marketing for travel and tourism 2015
Marketing for travel and tourism 2015Felecia Palmer
 
Airline Deregulation
Airline DeregulationAirline Deregulation
Airline DeregulationNathan DeRosa
 

What's hot (20)

Diversify, Differentiate, Innovate: Airport Strategies for Success in a New W...
Diversify, Differentiate, Innovate: Airport Strategies for Success in a New W...Diversify, Differentiate, Innovate: Airport Strategies for Success in a New W...
Diversify, Differentiate, Innovate: Airport Strategies for Success in a New W...
 
Types of airlines and airline business models
Types of airlines and airline business modelsTypes of airlines and airline business models
Types of airlines and airline business models
 
Airfares Global Distribution Strategy for Higher Incremental Revenues in Non-...
Airfares Global Distribution Strategy for Higher Incremental Revenues in Non-...Airfares Global Distribution Strategy for Higher Incremental Revenues in Non-...
Airfares Global Distribution Strategy for Higher Incremental Revenues in Non-...
 
Airport Capacity, who is in Control?
Airport Capacity, who is in Control?Airport Capacity, who is in Control?
Airport Capacity, who is in Control?
 
Forecasting by Objective
Forecasting by ObjectiveForecasting by Objective
Forecasting by Objective
 
Airline iindustry scenario
Airline iindustry scenarioAirline iindustry scenario
Airline iindustry scenario
 
airline deregulation
airline deregulationairline deregulation
airline deregulation
 
Airline services marketing by domestic and foreign firms differences
Airline services marketing by domestic and foreign firms differencesAirline services marketing by domestic and foreign firms differences
Airline services marketing by domestic and foreign firms differences
 
Paper journal of advanced transportation
Paper journal of advanced transportationPaper journal of advanced transportation
Paper journal of advanced transportation
 
Ryanair Presentation 2012
Ryanair Presentation 2012Ryanair Presentation 2012
Ryanair Presentation 2012
 
Black book Graduation Project
Black book Graduation ProjectBlack book Graduation Project
Black book Graduation Project
 
conseq
conseqconseq
conseq
 
Management Consultancy Report
Management Consultancy ReportManagement Consultancy Report
Management Consultancy Report
 
Air france international strategy analysis (2014)
Air france international strategy analysis (2014)Air france international strategy analysis (2014)
Air france international strategy analysis (2014)
 
Strategic Analysis of Ryan Air
Strategic Analysis of Ryan AirStrategic Analysis of Ryan Air
Strategic Analysis of Ryan Air
 
Lufthansa Case Study
Lufthansa Case StudyLufthansa Case Study
Lufthansa Case Study
 
Internationalization of civil aviation
Internationalization of civil aviationInternationalization of civil aviation
Internationalization of civil aviation
 
Marketing for travel and tourism 2015
Marketing for travel and tourism 2015Marketing for travel and tourism 2015
Marketing for travel and tourism 2015
 
Airline
AirlineAirline
Airline
 
Airline Deregulation
Airline DeregulationAirline Deregulation
Airline Deregulation
 

Viewers also liked

Maldives National drug use survey 2012
Maldives National drug use survey 2012Maldives National drug use survey 2012
Maldives National drug use survey 2012Achmed Adam
 
The degree of basic stage schools' teachers' practicing of personal, professi...
The degree of basic stage schools' teachers' practicing of personal, professi...The degree of basic stage schools' teachers' practicing of personal, professi...
The degree of basic stage schools' teachers' practicing of personal, professi...Alexander Decker
 
The advantages and disadvantages of the 2011 new patent “first to-file” system
The advantages and disadvantages of the 2011 new patent “first to-file” systemThe advantages and disadvantages of the 2011 new patent “first to-file” system
The advantages and disadvantages of the 2011 new patent “first to-file” systemAlexander Decker
 
Testing for fisher’s hypothesis in nigeria (1970 2012)
Testing for fisher’s hypothesis in nigeria (1970 2012)Testing for fisher’s hypothesis in nigeria (1970 2012)
Testing for fisher’s hypothesis in nigeria (1970 2012)Alexander Decker
 
The dialectic of myth making in contemporary african novel
The dialectic of myth making in contemporary african novelThe dialectic of myth making in contemporary african novel
The dialectic of myth making in contemporary african novelAlexander Decker
 
The effect of mobile money transfer on working capital management
The effect of mobile money transfer on working capital managementThe effect of mobile money transfer on working capital management
The effect of mobile money transfer on working capital managementAlexander Decker
 
The concept of moments of order invariant quantum
The concept of moments of order invariant quantumThe concept of moments of order invariant quantum
The concept of moments of order invariant quantumAlexander Decker
 
The association between hla drb alleles with pulmonary tuberculosis in babil ...
The association between hla drb alleles with pulmonary tuberculosis in babil ...The association between hla drb alleles with pulmonary tuberculosis in babil ...
The association between hla drb alleles with pulmonary tuberculosis in babil ...Alexander Decker
 
The effect of information technology on the quality of accounting information...
The effect of information technology on the quality of accounting information...The effect of information technology on the quality of accounting information...
The effect of information technology on the quality of accounting information...Alexander Decker
 
The effect of gypsum plaster on the dry rate of emulsion
The effect of gypsum plaster on the dry rate of emulsionThe effect of gypsum plaster on the dry rate of emulsion
The effect of gypsum plaster on the dry rate of emulsionAlexander Decker
 
The effect of assessment model and cognitive style on the students’ achieveme...
The effect of assessment model and cognitive style on the students’ achieveme...The effect of assessment model and cognitive style on the students’ achieveme...
The effect of assessment model and cognitive style on the students’ achieveme...Alexander Decker
 
The effect of corn oil in sperm parameters and levels of some hormone, elemen...
The effect of corn oil in sperm parameters and levels of some hormone, elemen...The effect of corn oil in sperm parameters and levels of some hormone, elemen...
The effect of corn oil in sperm parameters and levels of some hormone, elemen...Alexander Decker
 
The effect of corporate income tax on financial performance of listed manufac...
The effect of corporate income tax on financial performance of listed manufac...The effect of corporate income tax on financial performance of listed manufac...
The effect of corporate income tax on financial performance of listed manufac...Alexander Decker
 
The challenge of communicating change a case study of ghana’s community-based...
The challenge of communicating change a case study of ghana’s community-based...The challenge of communicating change a case study of ghana’s community-based...
The challenge of communicating change a case study of ghana’s community-based...Alexander Decker
 
The characteristic of pelleted broiler litter biochar derived from pilot scal...
The characteristic of pelleted broiler litter biochar derived from pilot scal...The characteristic of pelleted broiler litter biochar derived from pilot scal...
The characteristic of pelleted broiler litter biochar derived from pilot scal...Alexander Decker
 
Quantandqual
QuantandqualQuantandqual
Quantandqualamanyella
 
Hanson 10e Pp Ts Ch01
Hanson 10e Pp Ts Ch01Hanson 10e Pp Ts Ch01
Hanson 10e Pp Ts Ch01Bryan
 

Viewers also liked (20)

Maldives
MaldivesMaldives
Maldives
 
Maldives National drug use survey 2012
Maldives National drug use survey 2012Maldives National drug use survey 2012
Maldives National drug use survey 2012
 
Malév Hungarian Airlines
Malév Hungarian AirlinesMalév Hungarian Airlines
Malév Hungarian Airlines
 
The degree of basic stage schools' teachers' practicing of personal, professi...
The degree of basic stage schools' teachers' practicing of personal, professi...The degree of basic stage schools' teachers' practicing of personal, professi...
The degree of basic stage schools' teachers' practicing of personal, professi...
 
The advantages and disadvantages of the 2011 new patent “first to-file” system
The advantages and disadvantages of the 2011 new patent “first to-file” systemThe advantages and disadvantages of the 2011 new patent “first to-file” system
The advantages and disadvantages of the 2011 new patent “first to-file” system
 
Testing for fisher’s hypothesis in nigeria (1970 2012)
Testing for fisher’s hypothesis in nigeria (1970 2012)Testing for fisher’s hypothesis in nigeria (1970 2012)
Testing for fisher’s hypothesis in nigeria (1970 2012)
 
The dialectic of myth making in contemporary african novel
The dialectic of myth making in contemporary african novelThe dialectic of myth making in contemporary african novel
The dialectic of myth making in contemporary african novel
 
Jueguito
JueguitoJueguito
Jueguito
 
The effect of mobile money transfer on working capital management
The effect of mobile money transfer on working capital managementThe effect of mobile money transfer on working capital management
The effect of mobile money transfer on working capital management
 
The concept of moments of order invariant quantum
The concept of moments of order invariant quantumThe concept of moments of order invariant quantum
The concept of moments of order invariant quantum
 
The association between hla drb alleles with pulmonary tuberculosis in babil ...
The association between hla drb alleles with pulmonary tuberculosis in babil ...The association between hla drb alleles with pulmonary tuberculosis in babil ...
The association between hla drb alleles with pulmonary tuberculosis in babil ...
 
The effect of information technology on the quality of accounting information...
The effect of information technology on the quality of accounting information...The effect of information technology on the quality of accounting information...
The effect of information technology on the quality of accounting information...
 
The effect of gypsum plaster on the dry rate of emulsion
The effect of gypsum plaster on the dry rate of emulsionThe effect of gypsum plaster on the dry rate of emulsion
The effect of gypsum plaster on the dry rate of emulsion
 
The effect of assessment model and cognitive style on the students’ achieveme...
The effect of assessment model and cognitive style on the students’ achieveme...The effect of assessment model and cognitive style on the students’ achieveme...
The effect of assessment model and cognitive style on the students’ achieveme...
 
The effect of corn oil in sperm parameters and levels of some hormone, elemen...
The effect of corn oil in sperm parameters and levels of some hormone, elemen...The effect of corn oil in sperm parameters and levels of some hormone, elemen...
The effect of corn oil in sperm parameters and levels of some hormone, elemen...
 
The effect of corporate income tax on financial performance of listed manufac...
The effect of corporate income tax on financial performance of listed manufac...The effect of corporate income tax on financial performance of listed manufac...
The effect of corporate income tax on financial performance of listed manufac...
 
The challenge of communicating change a case study of ghana’s community-based...
The challenge of communicating change a case study of ghana’s community-based...The challenge of communicating change a case study of ghana’s community-based...
The challenge of communicating change a case study of ghana’s community-based...
 
The characteristic of pelleted broiler litter biochar derived from pilot scal...
The characteristic of pelleted broiler litter biochar derived from pilot scal...The characteristic of pelleted broiler litter biochar derived from pilot scal...
The characteristic of pelleted broiler litter biochar derived from pilot scal...
 
Quantandqual
QuantandqualQuantandqual
Quantandqual
 
Hanson 10e Pp Ts Ch01
Hanson 10e Pp Ts Ch01Hanson 10e Pp Ts Ch01
Hanson 10e Pp Ts Ch01
 

Similar to The consequences of de hubbing for airports and tourism - a case study

NOTE This Industry overview is only a starting point for your an.docx
NOTE  This Industry overview is only a starting point for your an.docxNOTE  This Industry overview is only a starting point for your an.docx
NOTE This Industry overview is only a starting point for your an.docxhenrymartin15260
 
Airline Industry Case Journal
Airline Industry Case JournalAirline Industry Case Journal
Airline Industry Case JournalEmily Smith
 
The Airline industry An european Perspective
The Airline industry An european PerspectiveThe Airline industry An european Perspective
The Airline industry An european PerspectiveCletus Henry Roche
 
Diversify, Differentiate, Innovate: Airport Strategies for Success in a New W...
Diversify, Differentiate, Innovate: Airport Strategies for Success in a New W...Diversify, Differentiate, Innovate: Airport Strategies for Success in a New W...
Diversify, Differentiate, Innovate: Airport Strategies for Success in a New W...williamtebest
 
Airports Of The Future Essentials For A Renewed Business Model
Airports Of The Future  Essentials For A Renewed Business ModelAirports Of The Future  Essentials For A Renewed Business Model
Airports Of The Future Essentials For A Renewed Business ModelGina Rizzo
 
international journal of contemporary hospitality management
international journal of contemporary hospitality managementinternational journal of contemporary hospitality management
international journal of contemporary hospitality managementSandeep Gupta
 
2011 07 - atrs - frequency attractiveness
2011 07 - atrs - frequency attractiveness2011 07 - atrs - frequency attractiveness
2011 07 - atrs - frequency attractivenessDanielSALLIER
 
Airline Strategy From Network Management To Business Models
Airline Strategy  From Network Management To Business ModelsAirline Strategy  From Network Management To Business Models
Airline Strategy From Network Management To Business ModelsJoe Andelija
 
1 The Commercial Airline Industry October 17t.docx
 1 The Commercial Airline Industry October 17t.docx 1 The Commercial Airline Industry October 17t.docx
1 The Commercial Airline Industry October 17t.docxjoyjonna282
 
Should Coastal Flight Airlines expand into Europe by forming an.docx
Should Coastal Flight Airlines expand into Europe by forming an.docxShould Coastal Flight Airlines expand into Europe by forming an.docx
Should Coastal Flight Airlines expand into Europe by forming an.docxwrite5
 
Airport infra demand_central_europe
Airport infra demand_central_europeAirport infra demand_central_europe
Airport infra demand_central_europeWJ
 

Similar to The consequences of de hubbing for airports and tourism - a case study (20)

NOTE This Industry overview is only a starting point for your an.docx
NOTE  This Industry overview is only a starting point for your an.docxNOTE  This Industry overview is only a starting point for your an.docx
NOTE This Industry overview is only a starting point for your an.docx
 
Airline Revenue Managemant
Airline Revenue ManagemantAirline Revenue Managemant
Airline Revenue Managemant
 
Strategy
StrategyStrategy
Strategy
 
Airline Industry Case Journal
Airline Industry Case JournalAirline Industry Case Journal
Airline Industry Case Journal
 
The Airline industry An european Perspective
The Airline industry An european PerspectiveThe Airline industry An european Perspective
The Airline industry An european Perspective
 
Diversify, Differentiate, Innovate: Airport Strategies for Success in a New W...
Diversify, Differentiate, Innovate: Airport Strategies for Success in a New W...Diversify, Differentiate, Innovate: Airport Strategies for Success in a New W...
Diversify, Differentiate, Innovate: Airport Strategies for Success in a New W...
 
Airports Of The Future Essentials For A Renewed Business Model
Airports Of The Future  Essentials For A Renewed Business ModelAirports Of The Future  Essentials For A Renewed Business Model
Airports Of The Future Essentials For A Renewed Business Model
 
international journal of contemporary hospitality management
international journal of contemporary hospitality managementinternational journal of contemporary hospitality management
international journal of contemporary hospitality management
 
The plight of the policy; and PIA's predicament
The plight of the policy; and PIA's predicament The plight of the policy; and PIA's predicament
The plight of the policy; and PIA's predicament
 
4
44
4
 
Eco ppt
Eco pptEco ppt
Eco ppt
 
Micro Essay.docx
Micro Essay.docxMicro Essay.docx
Micro Essay.docx
 
2011 07 - atrs - frequency attractiveness
2011 07 - atrs - frequency attractiveness2011 07 - atrs - frequency attractiveness
2011 07 - atrs - frequency attractiveness
 
Airline Strategy From Network Management To Business Models
Airline Strategy  From Network Management To Business ModelsAirline Strategy  From Network Management To Business Models
Airline Strategy From Network Management To Business Models
 
11
1111
11
 
1 The Commercial Airline Industry October 17t.docx
 1 The Commercial Airline Industry October 17t.docx 1 The Commercial Airline Industry October 17t.docx
1 The Commercial Airline Industry October 17t.docx
 
Should Coastal Flight Airlines expand into Europe by forming an.docx
Should Coastal Flight Airlines expand into Europe by forming an.docxShould Coastal Flight Airlines expand into Europe by forming an.docx
Should Coastal Flight Airlines expand into Europe by forming an.docx
 
CDM Aviation Point of View
CDM Aviation Point of View CDM Aviation Point of View
CDM Aviation Point of View
 
Airport infra demand_central_europe
Airport infra demand_central_europeAirport infra demand_central_europe
Airport infra demand_central_europe
 
Southwest
SouthwestSouthwest
Southwest
 

More from Alexander Decker

Abnormalities of hormones and inflammatory cytokines in women affected with p...
Abnormalities of hormones and inflammatory cytokines in women affected with p...Abnormalities of hormones and inflammatory cytokines in women affected with p...
Abnormalities of hormones and inflammatory cytokines in women affected with p...Alexander Decker
 
A validation of the adverse childhood experiences scale in
A validation of the adverse childhood experiences scale inA validation of the adverse childhood experiences scale in
A validation of the adverse childhood experiences scale inAlexander Decker
 
A usability evaluation framework for b2 c e commerce websites
A usability evaluation framework for b2 c e commerce websitesA usability evaluation framework for b2 c e commerce websites
A usability evaluation framework for b2 c e commerce websitesAlexander Decker
 
A universal model for managing the marketing executives in nigerian banks
A universal model for managing the marketing executives in nigerian banksA universal model for managing the marketing executives in nigerian banks
A universal model for managing the marketing executives in nigerian banksAlexander Decker
 
A unique common fixed point theorems in generalized d
A unique common fixed point theorems in generalized dA unique common fixed point theorems in generalized d
A unique common fixed point theorems in generalized dAlexander Decker
 
A trends of salmonella and antibiotic resistance
A trends of salmonella and antibiotic resistanceA trends of salmonella and antibiotic resistance
A trends of salmonella and antibiotic resistanceAlexander Decker
 
A transformational generative approach towards understanding al-istifham
A transformational  generative approach towards understanding al-istifhamA transformational  generative approach towards understanding al-istifham
A transformational generative approach towards understanding al-istifhamAlexander Decker
 
A time series analysis of the determinants of savings in namibia
A time series analysis of the determinants of savings in namibiaA time series analysis of the determinants of savings in namibia
A time series analysis of the determinants of savings in namibiaAlexander Decker
 
A therapy for physical and mental fitness of school children
A therapy for physical and mental fitness of school childrenA therapy for physical and mental fitness of school children
A therapy for physical and mental fitness of school childrenAlexander Decker
 
A theory of efficiency for managing the marketing executives in nigerian banks
A theory of efficiency for managing the marketing executives in nigerian banksA theory of efficiency for managing the marketing executives in nigerian banks
A theory of efficiency for managing the marketing executives in nigerian banksAlexander Decker
 
A systematic evaluation of link budget for
A systematic evaluation of link budget forA systematic evaluation of link budget for
A systematic evaluation of link budget forAlexander Decker
 
A synthetic review of contraceptive supplies in punjab
A synthetic review of contraceptive supplies in punjabA synthetic review of contraceptive supplies in punjab
A synthetic review of contraceptive supplies in punjabAlexander Decker
 
A synthesis of taylor’s and fayol’s management approaches for managing market...
A synthesis of taylor’s and fayol’s management approaches for managing market...A synthesis of taylor’s and fayol’s management approaches for managing market...
A synthesis of taylor’s and fayol’s management approaches for managing market...Alexander Decker
 
A survey paper on sequence pattern mining with incremental
A survey paper on sequence pattern mining with incrementalA survey paper on sequence pattern mining with incremental
A survey paper on sequence pattern mining with incrementalAlexander Decker
 
A survey on live virtual machine migrations and its techniques
A survey on live virtual machine migrations and its techniquesA survey on live virtual machine migrations and its techniques
A survey on live virtual machine migrations and its techniquesAlexander Decker
 
A survey on data mining and analysis in hadoop and mongo db
A survey on data mining and analysis in hadoop and mongo dbA survey on data mining and analysis in hadoop and mongo db
A survey on data mining and analysis in hadoop and mongo dbAlexander Decker
 
A survey on challenges to the media cloud
A survey on challenges to the media cloudA survey on challenges to the media cloud
A survey on challenges to the media cloudAlexander Decker
 
A survey of provenance leveraged
A survey of provenance leveragedA survey of provenance leveraged
A survey of provenance leveragedAlexander Decker
 
A survey of private equity investments in kenya
A survey of private equity investments in kenyaA survey of private equity investments in kenya
A survey of private equity investments in kenyaAlexander Decker
 
A study to measures the financial health of
A study to measures the financial health ofA study to measures the financial health of
A study to measures the financial health ofAlexander Decker
 

More from Alexander Decker (20)

Abnormalities of hormones and inflammatory cytokines in women affected with p...
Abnormalities of hormones and inflammatory cytokines in women affected with p...Abnormalities of hormones and inflammatory cytokines in women affected with p...
Abnormalities of hormones and inflammatory cytokines in women affected with p...
 
A validation of the adverse childhood experiences scale in
A validation of the adverse childhood experiences scale inA validation of the adverse childhood experiences scale in
A validation of the adverse childhood experiences scale in
 
A usability evaluation framework for b2 c e commerce websites
A usability evaluation framework for b2 c e commerce websitesA usability evaluation framework for b2 c e commerce websites
A usability evaluation framework for b2 c e commerce websites
 
A universal model for managing the marketing executives in nigerian banks
A universal model for managing the marketing executives in nigerian banksA universal model for managing the marketing executives in nigerian banks
A universal model for managing the marketing executives in nigerian banks
 
A unique common fixed point theorems in generalized d
A unique common fixed point theorems in generalized dA unique common fixed point theorems in generalized d
A unique common fixed point theorems in generalized d
 
A trends of salmonella and antibiotic resistance
A trends of salmonella and antibiotic resistanceA trends of salmonella and antibiotic resistance
A trends of salmonella and antibiotic resistance
 
A transformational generative approach towards understanding al-istifham
A transformational  generative approach towards understanding al-istifhamA transformational  generative approach towards understanding al-istifham
A transformational generative approach towards understanding al-istifham
 
A time series analysis of the determinants of savings in namibia
A time series analysis of the determinants of savings in namibiaA time series analysis of the determinants of savings in namibia
A time series analysis of the determinants of savings in namibia
 
A therapy for physical and mental fitness of school children
A therapy for physical and mental fitness of school childrenA therapy for physical and mental fitness of school children
A therapy for physical and mental fitness of school children
 
A theory of efficiency for managing the marketing executives in nigerian banks
A theory of efficiency for managing the marketing executives in nigerian banksA theory of efficiency for managing the marketing executives in nigerian banks
A theory of efficiency for managing the marketing executives in nigerian banks
 
A systematic evaluation of link budget for
A systematic evaluation of link budget forA systematic evaluation of link budget for
A systematic evaluation of link budget for
 
A synthetic review of contraceptive supplies in punjab
A synthetic review of contraceptive supplies in punjabA synthetic review of contraceptive supplies in punjab
A synthetic review of contraceptive supplies in punjab
 
A synthesis of taylor’s and fayol’s management approaches for managing market...
A synthesis of taylor’s and fayol’s management approaches for managing market...A synthesis of taylor’s and fayol’s management approaches for managing market...
A synthesis of taylor’s and fayol’s management approaches for managing market...
 
A survey paper on sequence pattern mining with incremental
A survey paper on sequence pattern mining with incrementalA survey paper on sequence pattern mining with incremental
A survey paper on sequence pattern mining with incremental
 
A survey on live virtual machine migrations and its techniques
A survey on live virtual machine migrations and its techniquesA survey on live virtual machine migrations and its techniques
A survey on live virtual machine migrations and its techniques
 
A survey on data mining and analysis in hadoop and mongo db
A survey on data mining and analysis in hadoop and mongo dbA survey on data mining and analysis in hadoop and mongo db
A survey on data mining and analysis in hadoop and mongo db
 
A survey on challenges to the media cloud
A survey on challenges to the media cloudA survey on challenges to the media cloud
A survey on challenges to the media cloud
 
A survey of provenance leveraged
A survey of provenance leveragedA survey of provenance leveraged
A survey of provenance leveraged
 
A survey of private equity investments in kenya
A survey of private equity investments in kenyaA survey of private equity investments in kenya
A survey of private equity investments in kenya
 
A study to measures the financial health of
A study to measures the financial health ofA study to measures the financial health of
A study to measures the financial health of
 

Recently uploaded

8447779800, Low rate Call girls in Uttam Nagar Delhi NCR
8447779800, Low rate Call girls in Uttam Nagar Delhi NCR8447779800, Low rate Call girls in Uttam Nagar Delhi NCR
8447779800, Low rate Call girls in Uttam Nagar Delhi NCRashishs7044
 
Call Us 📲8800102216📞 Call Girls In DLF City Gurgaon
Call Us 📲8800102216📞 Call Girls In DLF City GurgaonCall Us 📲8800102216📞 Call Girls In DLF City Gurgaon
Call Us 📲8800102216📞 Call Girls In DLF City Gurgaoncallgirls2057
 
Organizational Structure Running A Successful Business
Organizational Structure Running A Successful BusinessOrganizational Structure Running A Successful Business
Organizational Structure Running A Successful BusinessSeta Wicaksana
 
Global Scenario On Sustainable and Resilient Coconut Industry by Dr. Jelfina...
Global Scenario On Sustainable  and Resilient Coconut Industry by Dr. Jelfina...Global Scenario On Sustainable  and Resilient Coconut Industry by Dr. Jelfina...
Global Scenario On Sustainable and Resilient Coconut Industry by Dr. Jelfina...ictsugar
 
Future Of Sample Report 2024 | Redacted Version
Future Of Sample Report 2024 | Redacted VersionFuture Of Sample Report 2024 | Redacted Version
Future Of Sample Report 2024 | Redacted VersionMintel Group
 
FULL ENJOY Call girls in Paharganj Delhi | 8377087607
FULL ENJOY Call girls in Paharganj Delhi | 8377087607FULL ENJOY Call girls in Paharganj Delhi | 8377087607
FULL ENJOY Call girls in Paharganj Delhi | 8377087607dollysharma2066
 
Progress Report - Oracle Database Analyst Summit
Progress  Report - Oracle Database Analyst SummitProgress  Report - Oracle Database Analyst Summit
Progress Report - Oracle Database Analyst SummitHolger Mueller
 
Lowrate Call Girls In Sector 18 Noida ❤️8860477959 Escorts 100% Genuine Servi...
Lowrate Call Girls In Sector 18 Noida ❤️8860477959 Escorts 100% Genuine Servi...Lowrate Call Girls In Sector 18 Noida ❤️8860477959 Escorts 100% Genuine Servi...
Lowrate Call Girls In Sector 18 Noida ❤️8860477959 Escorts 100% Genuine Servi...lizamodels9
 
8447779800, Low rate Call girls in New Ashok Nagar Delhi NCR
8447779800, Low rate Call girls in New Ashok Nagar Delhi NCR8447779800, Low rate Call girls in New Ashok Nagar Delhi NCR
8447779800, Low rate Call girls in New Ashok Nagar Delhi NCRashishs7044
 
8447779800, Low rate Call girls in Tughlakabad Delhi NCR
8447779800, Low rate Call girls in Tughlakabad Delhi NCR8447779800, Low rate Call girls in Tughlakabad Delhi NCR
8447779800, Low rate Call girls in Tughlakabad Delhi NCRashishs7044
 
VIP Kolkata Call Girl Howrah 👉 8250192130 Available With Room
VIP Kolkata Call Girl Howrah 👉 8250192130  Available With RoomVIP Kolkata Call Girl Howrah 👉 8250192130  Available With Room
VIP Kolkata Call Girl Howrah 👉 8250192130 Available With Roomdivyansh0kumar0
 
NewBase 19 April 2024 Energy News issue - 1717 by Khaled Al Awadi.pdf
NewBase  19 April  2024  Energy News issue - 1717 by Khaled Al Awadi.pdfNewBase  19 April  2024  Energy News issue - 1717 by Khaled Al Awadi.pdf
NewBase 19 April 2024 Energy News issue - 1717 by Khaled Al Awadi.pdfKhaled Al Awadi
 
Youth Involvement in an Innovative Coconut Value Chain by Mwalimu Menza
Youth Involvement in an Innovative Coconut Value Chain by Mwalimu MenzaYouth Involvement in an Innovative Coconut Value Chain by Mwalimu Menza
Youth Involvement in an Innovative Coconut Value Chain by Mwalimu Menzaictsugar
 
RE Capital's Visionary Leadership under Newman Leech
RE Capital's Visionary Leadership under Newman LeechRE Capital's Visionary Leadership under Newman Leech
RE Capital's Visionary Leadership under Newman LeechNewman George Leech
 
Sales & Marketing Alignment: How to Synergize for Success
Sales & Marketing Alignment: How to Synergize for SuccessSales & Marketing Alignment: How to Synergize for Success
Sales & Marketing Alignment: How to Synergize for SuccessAggregage
 
2024 Numerator Consumer Study of Cannabis Usage
2024 Numerator Consumer Study of Cannabis Usage2024 Numerator Consumer Study of Cannabis Usage
2024 Numerator Consumer Study of Cannabis UsageNeil Kimberley
 
Contemporary Economic Issues Facing the Filipino Entrepreneur (1).pptx
Contemporary Economic Issues Facing the Filipino Entrepreneur (1).pptxContemporary Economic Issues Facing the Filipino Entrepreneur (1).pptx
Contemporary Economic Issues Facing the Filipino Entrepreneur (1).pptxMarkAnthonyAurellano
 
(8264348440) 🔝 Call Girls In Mahipalpur 🔝 Delhi NCR
(8264348440) 🔝 Call Girls In Mahipalpur 🔝 Delhi NCR(8264348440) 🔝 Call Girls In Mahipalpur 🔝 Delhi NCR
(8264348440) 🔝 Call Girls In Mahipalpur 🔝 Delhi NCRsoniya singh
 
BEST Call Girls In Old Faridabad ✨ 9773824855 ✨ Escorts Service In Delhi Ncr,
BEST Call Girls In Old Faridabad ✨ 9773824855 ✨ Escorts Service In Delhi Ncr,BEST Call Girls In Old Faridabad ✨ 9773824855 ✨ Escorts Service In Delhi Ncr,
BEST Call Girls In Old Faridabad ✨ 9773824855 ✨ Escorts Service In Delhi Ncr,noida100girls
 
BEST Call Girls In Greater Noida ✨ 9773824855 ✨ Escorts Service In Delhi Ncr,
BEST Call Girls In Greater Noida ✨ 9773824855 ✨ Escorts Service In Delhi Ncr,BEST Call Girls In Greater Noida ✨ 9773824855 ✨ Escorts Service In Delhi Ncr,
BEST Call Girls In Greater Noida ✨ 9773824855 ✨ Escorts Service In Delhi Ncr,noida100girls
 

Recently uploaded (20)

8447779800, Low rate Call girls in Uttam Nagar Delhi NCR
8447779800, Low rate Call girls in Uttam Nagar Delhi NCR8447779800, Low rate Call girls in Uttam Nagar Delhi NCR
8447779800, Low rate Call girls in Uttam Nagar Delhi NCR
 
Call Us 📲8800102216📞 Call Girls In DLF City Gurgaon
Call Us 📲8800102216📞 Call Girls In DLF City GurgaonCall Us 📲8800102216📞 Call Girls In DLF City Gurgaon
Call Us 📲8800102216📞 Call Girls In DLF City Gurgaon
 
Organizational Structure Running A Successful Business
Organizational Structure Running A Successful BusinessOrganizational Structure Running A Successful Business
Organizational Structure Running A Successful Business
 
Global Scenario On Sustainable and Resilient Coconut Industry by Dr. Jelfina...
Global Scenario On Sustainable  and Resilient Coconut Industry by Dr. Jelfina...Global Scenario On Sustainable  and Resilient Coconut Industry by Dr. Jelfina...
Global Scenario On Sustainable and Resilient Coconut Industry by Dr. Jelfina...
 
Future Of Sample Report 2024 | Redacted Version
Future Of Sample Report 2024 | Redacted VersionFuture Of Sample Report 2024 | Redacted Version
Future Of Sample Report 2024 | Redacted Version
 
FULL ENJOY Call girls in Paharganj Delhi | 8377087607
FULL ENJOY Call girls in Paharganj Delhi | 8377087607FULL ENJOY Call girls in Paharganj Delhi | 8377087607
FULL ENJOY Call girls in Paharganj Delhi | 8377087607
 
Progress Report - Oracle Database Analyst Summit
Progress  Report - Oracle Database Analyst SummitProgress  Report - Oracle Database Analyst Summit
Progress Report - Oracle Database Analyst Summit
 
Lowrate Call Girls In Sector 18 Noida ❤️8860477959 Escorts 100% Genuine Servi...
Lowrate Call Girls In Sector 18 Noida ❤️8860477959 Escorts 100% Genuine Servi...Lowrate Call Girls In Sector 18 Noida ❤️8860477959 Escorts 100% Genuine Servi...
Lowrate Call Girls In Sector 18 Noida ❤️8860477959 Escorts 100% Genuine Servi...
 
8447779800, Low rate Call girls in New Ashok Nagar Delhi NCR
8447779800, Low rate Call girls in New Ashok Nagar Delhi NCR8447779800, Low rate Call girls in New Ashok Nagar Delhi NCR
8447779800, Low rate Call girls in New Ashok Nagar Delhi NCR
 
8447779800, Low rate Call girls in Tughlakabad Delhi NCR
8447779800, Low rate Call girls in Tughlakabad Delhi NCR8447779800, Low rate Call girls in Tughlakabad Delhi NCR
8447779800, Low rate Call girls in Tughlakabad Delhi NCR
 
VIP Kolkata Call Girl Howrah 👉 8250192130 Available With Room
VIP Kolkata Call Girl Howrah 👉 8250192130  Available With RoomVIP Kolkata Call Girl Howrah 👉 8250192130  Available With Room
VIP Kolkata Call Girl Howrah 👉 8250192130 Available With Room
 
NewBase 19 April 2024 Energy News issue - 1717 by Khaled Al Awadi.pdf
NewBase  19 April  2024  Energy News issue - 1717 by Khaled Al Awadi.pdfNewBase  19 April  2024  Energy News issue - 1717 by Khaled Al Awadi.pdf
NewBase 19 April 2024 Energy News issue - 1717 by Khaled Al Awadi.pdf
 
Youth Involvement in an Innovative Coconut Value Chain by Mwalimu Menza
Youth Involvement in an Innovative Coconut Value Chain by Mwalimu MenzaYouth Involvement in an Innovative Coconut Value Chain by Mwalimu Menza
Youth Involvement in an Innovative Coconut Value Chain by Mwalimu Menza
 
RE Capital's Visionary Leadership under Newman Leech
RE Capital's Visionary Leadership under Newman LeechRE Capital's Visionary Leadership under Newman Leech
RE Capital's Visionary Leadership under Newman Leech
 
Sales & Marketing Alignment: How to Synergize for Success
Sales & Marketing Alignment: How to Synergize for SuccessSales & Marketing Alignment: How to Synergize for Success
Sales & Marketing Alignment: How to Synergize for Success
 
2024 Numerator Consumer Study of Cannabis Usage
2024 Numerator Consumer Study of Cannabis Usage2024 Numerator Consumer Study of Cannabis Usage
2024 Numerator Consumer Study of Cannabis Usage
 
Contemporary Economic Issues Facing the Filipino Entrepreneur (1).pptx
Contemporary Economic Issues Facing the Filipino Entrepreneur (1).pptxContemporary Economic Issues Facing the Filipino Entrepreneur (1).pptx
Contemporary Economic Issues Facing the Filipino Entrepreneur (1).pptx
 
(8264348440) 🔝 Call Girls In Mahipalpur 🔝 Delhi NCR
(8264348440) 🔝 Call Girls In Mahipalpur 🔝 Delhi NCR(8264348440) 🔝 Call Girls In Mahipalpur 🔝 Delhi NCR
(8264348440) 🔝 Call Girls In Mahipalpur 🔝 Delhi NCR
 
BEST Call Girls In Old Faridabad ✨ 9773824855 ✨ Escorts Service In Delhi Ncr,
BEST Call Girls In Old Faridabad ✨ 9773824855 ✨ Escorts Service In Delhi Ncr,BEST Call Girls In Old Faridabad ✨ 9773824855 ✨ Escorts Service In Delhi Ncr,
BEST Call Girls In Old Faridabad ✨ 9773824855 ✨ Escorts Service In Delhi Ncr,
 
BEST Call Girls In Greater Noida ✨ 9773824855 ✨ Escorts Service In Delhi Ncr,
BEST Call Girls In Greater Noida ✨ 9773824855 ✨ Escorts Service In Delhi Ncr,BEST Call Girls In Greater Noida ✨ 9773824855 ✨ Escorts Service In Delhi Ncr,
BEST Call Girls In Greater Noida ✨ 9773824855 ✨ Escorts Service In Delhi Ncr,
 

The consequences of de hubbing for airports and tourism - a case study

  • 1. European Journal of Business and Management ISSN 2222-1905 (Paper) ISSN 2222-2839 (Online) Vol.5, No.25, 2013 www.iiste.org The Consequences of De-hubbing for Airports and Tourism - a Case Study Patrick Bohl Department of Marketing, Corvinus University of Budapest, Fővám tér 8., Budapest, Hungary E-mail: patrick.bohl@uni-corvinus.hu Abstract The size of airports depends on passenger traffic to and from that city as well as the number of passengers connecting from one flight to another flight. When hub airports lose a significant amount of connecting flights (‘de-hubbing’), their growth is negatively affected and in many cases does not reach previous levels. This has serious implications for the airport operator as well as the tourism industry, which may lose incoming visitors from markets no longer connected to the airport. The case of de-hubbing of Budapest airport of February 2012 shows that under certain circumstances, very good traffic recovery rates can be achieved. Important drivers for the recovery rate are the type of airline taking over lost routes, the demand for inbound tourism and capacity offered on selected markets, and the dominance of a certain type of airline (alliance/low cost). This paper extends the research done by Redondi et al. (2012), but also has relevance for airport and tourism managers faced with airline bankruptcy and policy makers. Keywords: tourism, competition, airline bankruptcy, airport management 1. Introduction Airports are called hubs, when a significant share of their passengers is travelling neither to nor from their city, but connect from one flight to another airline. Because such flights carry both connecting and direct passengers, airlines can serve destinations which without a hub would not be economical. Airports benefit because the number of passengers and flights being handled grow beyond the natural potential of the destination, because it is driven by the size of the network of the home airlines. De-hubbing occurs when hub carriers partly or wholly withdraw from an airport, often caused by bankruptcy, and transfer traffic declines significantly. Many airports are unable to ever reach traffic levels prior and face serious financial consequences. This paper discusses the effects of de-hubbing on tourism and the rate of recovery, aiming to answer the following questions: • What effect does de-hubbing have on inbound tourism revenues? • What are the antecedents of that effect? • Does traffic recovery occur in a linear, exponential or S-type fashion over time? The paper is organised as follows: First we provide a short literature overview and conceptualise the cause-effect relationships to be discussed. A number of propositions are offered. Then, we present the case of a complete dehubbing when a hub lost its main carrier in early 2012. Next the propositions are discussed in light of the case study, followed by limitations, managerial implications as well as possibilities for future research. 2. Theoretical background and conceptualisation The future commercial success of airports is heavily influenced by size of the passenger potential for this airport. It may be argued that airports offering not only direct flights to and from that city but also connecting flights have a larger passenger potential. With passengers’ volumes being a strong driver of income, it can be a strategic objective of an airport to offer connections, and be a ‘hub’. However, decisions to establish hubs and their size and shape are driven by airlines, and more and more airlines are struggling to make a profit, or even to stay alive. Caused by a series of crises in the airline industry, starting from the events of September 11th, 2001, followed by the spreading of SARS, and then an unprecedented increase in kerosene prices in late 2005, airlines have been under severe pressure. Crises such as these can cause a reduction of an airport’s connections, either by a hub carrier’s bankruptcy or by the carrier’s choice to restructure their network (Dudden 2006). Despite the serious negative effects that de-hubbing can have on economic performance, there are only few studies investigating its effects on the airport. Bahdra (2009) suggested that de-hubbing was a strategy applied by airlines to reduce losses occurred at multi-hub operations, but does not discuss the impact on affected airports. Borenstein & Rose (2003) review the effect of bankruptcy in the US (Chapter 11) on air services at airports, and conclude that in large or small airports, the number of air services is not significantly affected by an air carriers bankruptcy, while 168
  • 2. European Journal of Business and Management ISSN 2222-1905 (Paper) ISSN 2222-2839 (Online) Vol.5, No.25, 2013 www.iiste.org medium sized airports (defined as having 100 to 400 departing flights/day) are. Redondi et al. (2012) define dehubbing to take place when the number of viable connections per month reduces by 75% compared to any previous month (covering both cases of sudden and gradual de-hubbing). They identify 37 cases of de-hubbing during 1997-2009 (small airports or those closing after de-hubbing were excluded), and propose that the outcome of de-hubbing can be classified into five scenarios: Airports recovering the number of connections are ‘re-hubbed’. Airports dominated by alliances, low cost carriers (LCC) or unallied airlines after five years fall in to three further distinct categories, and all other cases form the fifth category, termed ‘battleground’. From an airport perspective, the most favourable outcome was the “low-cost dominated” scenario, which involves LCC increasing capacity to an extent which makes this the dominant category at the airport. This was the case in Birmingham, Basel-Mulhouse, East Midlands and Glasgow, which led to Flybe, EasyJet Switzerland, bmibaby and easyJet to become dominant and overall LCC seats to exceed 50% of capacity. These airports also had the quickest recovery in number of seats offered. All other scenarios are very negative, and full recovery for those airports is unlikely (Redondi et al. 2012). There are, however, a number of drawbacks when airports become low cost dominated. As the tourism industry in most countries heavily depends on being connected to key sending markets by air as well as sufficient seat capacity being offered, the loss of a hub can be expected to have a significant impact on tourism revenues, too. Firstly, some routes will only be viable because of the connections offered by a hub, therefore the airport is likely to have fewer routes afterwards, and therefore the country will be accessible from fewer inbound markets. These are likely to be smaller markets, because if they were significant, the routes would probably be viable even without connecting passengers. Secondly, a lower seat capacity after de-hubbing may lead to price increases of air tickets, which in turn makes travel to the destination more expensive, leading to fewer inbound tourists (Tan 2012). On the other hand, there could be some positive effects as well. If capacity on a route is suddenly dropped because of bankruptcy, potential future profits are higher, because re-entry is not likely, and many customers will be looking for new alternative offers at once. Attractive markets may be entered by several airlines at once, leading to oversupply, which may then result in lower fares and excess capacity. • P1: Sudden de-hubbing followed by capacity dumping on certain air markets increases inbound tourism from those markets. Next, a dominant hub airline may discourage competitive market entry, and lead to higher price levels (Borenstein 1989, Evans & Kessides 1993). The absence of a dominant carrier would consequently lead to more competition and – assuming no new dominant player appears – lower fares at higher seat availability, both benefiting inbound tourism. We propose that: • P2: Recovery of inbound tourism is stronger after de-hubbing when the airport is not dominated by an airline/alliance then if it is dominated afterwards. If the growth is fuelled by a LCC, it is worth to compare the effect their different business model has on tourism. LCC tend to use larger aircraft on short haul flights then others. Therefore, an increase of the share of LCC with equal frequencies leads to more seat capacity offered. LCC also realise higher seat occupation, and due to a higher ancillary revenue (such as excess baggage fees etc.) and lower operating costs than traditional airlines are able to sell seats at lower fares, this stimulating local traffic more successfully than traditional carriers. We therefore propose: • P3: De-hubbing followed by a significant increase of the LCC share increases inbound tourism Next we turn to aspects of recovery. By definition, de-hubbing consists of a company exiting several air travel markets. With air travel being a highly competitive industry, we assume most incumbents are actively monitoring competing players, and aware of the dynamic nature of competition (Roberts et al. 2005). Therefore de-hubbing is likely to first (phase 1) result in a wave of reactions from incumbent firms as well as market entry by new firms. We consider each destination connected to the airport before by a non-stop flight to be an individual market. After de-hubbing, markets could remain either completely unserved, other markets could become massively competitive (for example when both incumbent airlines increase capacity and new airlines enter) and some markets could change into a monopoly (for example when only one airline is permitted to fly due to regulatory or technical restrictions). Other markets will retain a ‘normal’ level of competition. Furthermore, one could assume that in the second case, prices will decrease on the market – leading to a stimulation of passenger traffic – while in the third case, prices will increase. Then, in phase two, the market players will have had time to gain experience with the new market situation, and have made a further range of entry/exit decisions. Due to the 169
  • 3. European Journal of Business and Management ISSN 2222-1905 (Paper) ISSN 2222-2839 (Online) Vol.5, No.25, 2013 www.iiste.org need to scheduling aircraft and crew as well as sell tickets well in advance, the second ‘wave’ of reactions is likely to be 6 - 12 months after phase one. A most relevant question for the airport is if the recovery rate of the overall traffic in phases one and two. To determine this, assumptions need to be made about the competitive intensiveness and capacity offered for the respective markets, over time. This, in turn, requires an understanding of the attractiveness of the markets affected by de-hubbing. Because all players have more understanding of the attractiveness of markets, and also some or all players on markets will have occurred losses during a first phase, it is most likely that overall capacity and competition will decrease in a second phase. Irrespective of the size of the recovery rate, we therefore postulate that: • P4: The rate of traffic recovery after de-hubbing will first increase, then decrease, then increase again over time (S-shape). Next we will discuss these propositions in further detail and test their application in a recent case of de-hubbing. The case study methodology is an “empirical inquiry that investigates a contemporary phenomenon within its real-life context; when the boundaries between phenomenon and context are not clearly evident; and in which multiple sources of evidence are used” (Yin 1984, p. 23). It is appropriate to use in this case, because the existing knowledge of de-hubbing is still limited, and there are no generally accepted conceptual frameworks explaining the causes and effects, to the best of our knowledge. Also, the two cases presented here are unique, and were selected with the intention to give suggestions for further research, which could lead to a general model (Hamel et al. 1993). The case method has certain limitations, including a lack of generalizability of the results and the bias caused by the researcher’s extensive exposure to the cases. We consider the insights from these cases to be important enough in the development of new knowledge to outweigh the drawbacks, and encourage reading on, with the above limitations in mind. 3. Budapest airport – a case of sudden de-hubbing12 On 3rd February, 2012, the main hub carrier of Hungary’s Budapest airport stopped operations due to lack of funds. At that time, the airline accounted for 37% of the airport’s annual passenger traffic, and carried most of the airport’s 3.2 million transfer passengers. The airport also lost it’s only two long-haul airlines American Airlines and Hainan Airlines as a result of the weakened connectivity at the hub, and transfer traffic reduced by 99% immediately (see Table 3). Malév’s network consisted of a wide range of routes in Europe and the Middle East, and its schedule structure was optimized to allow efficient connections in the North-South and West-East directions. At a route level, however, the share of transfer passengers differed significantly. Some destinations carried very few transfer passengers, which could be caused by either a high demand of the local market segment, or a lack of connectivity, others had a very high share of transfer passengers. Because no other airline offered the possibility to connect in Budapest, the routes with a high transfer share were the most likely to remain unserved. Malév operated on 45 routes with own aircraft. By the following summer season, 19 new routes have been announced by 5 new airlines. The most significant announcement was made by Ryanair’s CEO who promised a “rescue plan for Budapest and Hungary tourism” (Anonymous 2012), subsequently launching 28 routes within weeks. By mid-summer, 13 incumbent airlines increased frequencies on their routes. 16 routes have not been taken over at that time, and also 18 months later, still 14 routes are non-served. Budapest’s biggest carrier, Wizz Air stated that a new aircraft joining their Budapest base in March 2014 will only be used to increase the frequency of existing routes (Landry 2013). This suggests that within two years after the event, all market opportunities caused by the demise of Malév may have been taken up, and therefore the recovery process may have largely been completed. We will now further discuss the five propositions suggested above, and assess if they can be upheld in this particular case of sudden de-hubbing. The intention is to give further substance to the proposed relationships, and suggest them for further investigation using a larger sample. Capacity dumping and inbound tourism Starting from February 2013, carriers started to add new routes and increase capacities on existing routes. It 12 All data related to schedules and routes to/from Budapest were obtained from the airport’s operator Budapest Airport Zrt., between August and September 2013, unless otherwise marked in the text. 170
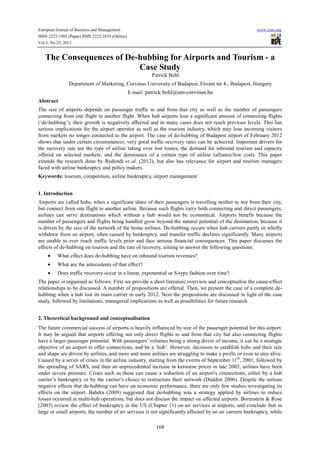
  • 4. European Journal of Business and Management ISSN 2222-1905 (Paper) ISSN 2222-2839 (Online) Vol.5, No.25, 2013 www.iiste.org could be expected that market forces lead to attractive markets receiving a higher increase in capacities than less attractive markets, which in some cases may also lead to an excess in capacity, which we term capacity dumping. For the purposes of this paper, capacity dumping is defined as increasing air service capacity between two countries in a way which leads to total annual capacity being 15% more compared to the year before. The value of 15% was chosen, because this mark is significantly higher than European tourism growth and average GDP growth in any European market, therefore indicating that capacity increases do not follow market demand, but are likely to be a strategic move in the competitive interaction by airlines, involving excess supply. We compared the change of annual departing seat capacity at Budapest airport for the full year 2012 compared to previous year with the change of registered international visitors at Hungarian hotels during the same period. Although 2012 full year data includes one month before de-hubbing (January 2012) we still decided to use annual data, because tourism data was available only for a full year. We identified six markets (see Table 4), and while average growth of international visitors to Hungary increased by 15.9%, three out of these markets grew by between 23% and 29% (Norway, Belgium and Ireland). The other markets (Spain, Italy and Poland) suggest that Hungary may be more attractive as a holiday destination in these Northern markets, while flights to Spain and Italy may be easier sold to Hungarian holidaymakers. The increase to Poland could be explained by increases by Poland’s home carrier aiming to carry Malév’s past traffic via their hub in Warsaw, but also by Ryanair and Wizz Air “fighting hard for leadership in Hungary and Poland” (Anker 2012, p.1). Therefore capacity dumping is likely to lead to growing international visitors in case of markets with a sufficient demand for inbound travel, but not in case of typical outbound markets, such as Spain. In total, annual capacity was 6.8% lower than previous year, dropping from 5.7 to 5.3 million seats on departing flights. The average growth rate varied quite significantly from country to country, and some countries had increases of up to 100.000 seats per year (United Kingdom) while others declined by almost 100,000 (Romania). Figure 1 plots each country connected by flights to Hungary on one axis showing the incremental number of seats offered in 2012 to Budapest and on the other axis showing the incremental visitors coming from that country compared to the previous year. The mean change of capacity per route was -18,449 seats, with a standard deviation of 42,945. The markets increasing significantly were U.K., Belgium, Spain and Italy, which probably seemed attractive enough for several carriers to enter the markets with high capacities. The markets most negatively affected were all in Eastern and Southern Europe (Ukraine, Romania, Serbia, Czech Republic, Bulgaria, and Greece). These were served by flights of Malév which carried predominantly transfer passengers and were not attractive enough for point to point carriers. 8 of 41 countries showed a growth of over 10.000 seats, 19 showed a decline of over 10.000 seats and the remainder was between the two categories (‘stable’). Where capacity grew, visitor numbers grew, or in one case remained stable (‘stable’, defined as less than 5.000 visitors growth or decline). Where capacity declined, also visitor numbers declined or remained stable, except in 6 cases. Three of these countries were neighbours, suggesting that not air travel but land transport drives inbound tourism. The other three countries are Russia, Sweden and Turkey. In these cases, Malév stopped flying, and only the incumbent carrier remained, which in case of Russia and Turkey was their home carrier, which naturally carried a larger percentage of inbound passengers. Sweden’s increase cannot be easily explained. Possibly this is an outlier, where other external factors (such as a strong increase of the demand in Sweden) could play a role. Losing a dominant airline and inbound tourism Redondi et al. (2012) assigns airports with no dominant carrier after de-hubbing to the ‘battleground’ category, which involves competition among airlines and is the least preferable outcome for airport operators. Contrary to that, we argue that the loss of a dominant carrier may actually increase inbound tourism. To investigate this, we compare the case of Budapest airport with the de-hubbing case of nearby Prague airport, which occurred at about the same time. Budapest airport falls into the category of ‘battleground’ (LCC occur for 45%, the largest alliance group accounted for 22% of the seats), while Prague airport falls into the alliance dominated group (51% of the seats) even after de-hubbing. Traffic at the airport started to decline at the start of the winter season 2008, when ČSA faced major financial difficulties. The airline started a wide ranging restructuring programme, which was aimed at preparing the carrier for privatisation and avoiding bankruptcy. In April 2013, 44% of the company’s shares were acquired by Korean Airlines Co., Ltd. and new routes were launched in the same year which may lead to a gradual re-hubbing of the airport (e.g., Prague-Seoul). For this investigation, we determine the start of de-hubbing to be the first month showing a decline of overall traffic of more than 10%, and the end a growth of over 10%. Between September 171
  • 5. European Journal of Business and Management ISSN 2222-1905 (Paper) ISSN 2222-2839 (Online) Vol.5, No.25, 2013 www.iiste.org 2008 and May 2013 the number of destinations by ČSA reduced from 65 to 41 (-37%). The number of transfer passengers at Prague airport in May 2013 was 70% less than during the same period 5 years prior, and only represent a share of 6% of the total traffic. The total traffic is 15% less than before de-hubbing. ČSA cancelled routes which were probably either not viable without a hub as they were not taken up by other carriers (e.g., Bologna, Cairo), routes which were taken up by others (e.g., Riga, Venice) and routes which were probably profitable but had to be given up as a compensation for the negative effect of state aid on other airlines (e.g., Munich, London, see European Commission 2012b). In both cases discussed here, de-hubbing has led to the main national carrier’s share of the airport’s annual traffic declining. In the case of Budapest, Malév’s share dropped from a stable 41-44% during the years 2007-2011 to nothing in February 2012, while ČSA’s reduction of capacity in 2008 and 2009 first did not lead to any reduction in share because other airlines reduced, too, but then dropped from 48% in 2009 to 43% (2010), 40% (2011) and then 29% (2012). Figure 2 shows the share of the airline at the respective hub in the primary vertical axis and the growth of visitors in the respective country in the secondary vertical axis. The plot suggests that tourism growth is not related to the share of a dominant airline in the case of neither airport. In fact, both countries’ visitors grew while the share declines in 2012 compared to the previous year. This approach therefore provides no evidence for Proposition 2. However the approach contains some limitations. Firstly, the tourism data used is on a national level. The Czech Republic has a number of other significant international airports, and also a number of tourist centres which are not close to Prague airport, while a significant proportion of Hungary’s tourism is concentrated on the Budapest area and Balaton (2 hours from Budapest). Secondly, tourism data includes a significant share of visitors using ground transportation, which strongly influences these results. Higher LCC share and inbound tourism Proposition 3 assumes that after de-hubbing, a higher share of LCC capacity has a positive effect on the growth rate of tourism, which could be operationalized as a positive relationship between LCC capacity and the growth rate of inbound visitors to the region. We ran a linear regression using 24 months of data (January 2011December 2012) which included 13 months of data before and 11 months after de-hubbing. The results showed no significant relationship between the two, and a very low R square. Next we compared inbound visitors growth before (10 months data) and after (10 months data), and found that there was no significant difference between the means of the two periods (M1=0.115, SD1=0.064, M2=0.092, SD2=0.028). We can therefore conclude that the growth of inbound visitors is not driven by the share of LCC at an airport. Recovery of lost transfer traffic over time We investigated the relationship between time (independent variable) and the rate of recovery (the number of incremental passengers during a given month compared to the number of transferring passengers during the same month in the year before de-hubbing, dependent variable). We hypothised the relationship to be S-shaped, involving first a positive, then a negative sign. When plotting the recovery rate against time, data points almost exactly follow an S-shape during the first 10 months. After that, however, recovery rate drops steeply and then shows a high variation from month to month. How can this be explained? Essential to the recovery process at Budapest airport was the fast reaction by Ryanair to base 5 aircraft and launch 28 destinations only weeks of the de-hubbing taking place. Two of these aircraft were removed again in November, leading to a temporary drop in recovery rate. The rate increases again from February – one year after the exit – because by this time, also airlines with a longer planning cycle have had time to adjust their flying programme and launched new routes. Finally, three high frequency routes (Moscow, Istanbul, Tel Aviv) could be recovered only over one year after the exit due to bilateral restrictions. The Hungarian government designated Wizz Air as the Hungarian carrier on these routes, which was accepted by the other countries only after lengthy negotiations. This positive effect was sufficient to compensate the negative effect of the above mentioned Ryanair cutback. Before estimating a regression model, we considered to control for these effects, for example by excluding Ryanair traffic, which seems to be highly influenced by negotiations with the airport. On the other hand negotiations may have taken place with many airlines, and in fact the recovery at airports is driven by airlines such as Ryanair moving in. We therefore did not adjust the data, but advise to analyse with the above comments 172
  • 6. European Journal of Business and Management ISSN 2222-1905 (Paper) ISSN 2222-2839 (Online) Vol.5, No.25, 2013 www.iiste.org in mind. A series of regression models were ran with SPSS 20. Data consisted of the rate of recovery of each month between February 2012 and July 2013 (n=18). A rate of recovery of 1 means that traffic growth has fully compensated the lost transfer traffic of the given month. In order to test the s-shape, we first propose a cubic model, described with Y’ being the predicted rate of recovery as: Y ' = a + b1t + b2t 2 + b3t 3 (1) Results for the cubic model are encouraging despite the outliers as discussed above (R2=.480, 17 d.f., P<0.05). In order to assess if other regression models provide a better fit, we also ran a linear, quadratic, logarithmic and s-curved regression (see Table 7 for results). Surprisingly, a quadratic model involving the recovery rate to first increase, and then drop again, delivers very similar results (R2=.455, 17 d.f., P<0.05). This equation however would mean that recovery peaks, and then continues dropping. IBM/SPSS 20 also offers an s-curve regression model, which assumes the following relationship: 2 Y '=e a+ b1 t (2) The increase in R from the cubic to the S-curved equation is significant (P<0.01) suggesting the s-curve model explains more of the data’s variation. Next we use Akaike’s Information Criterion (AIC) to compare the models (Motulsky & Christopoulos 2004). Based on information theory, the AIC assesses the goodness of fit of models, while also penalising for the number of estimated parameters, thus preferring a simpler model unless justified. The S-curve model reaches the lowest AIC value, and is therefore the preferred one. The parameters were estimated to be b0 = 0.0484, b1 = -2.677 (R2=.828, 17 d.f., P<0.001). This assumes that full recovery will be reached within 19 months. Despite the curve model being S-shaped, the parameters lead to no period with actual decline in recovery rate, therefore we cannot find evidence for Proposition 4. 4. Findings and Discussion The case presented here illustrates effects of a sudden de-hubbing on the airport’s traffic development within the first 18 months, as well as subsequent changes in the volume of international visitors to the country. In recent years, the number of de-hubbing cases has been increasing, and have serious financial consequences for airport operators (Redondi et al. 2012). This case involves an airline bankruptcy, which led to transfer traffic dropping by 99% and the share of low cost traffic to that airport increasing from 26% to 52% within a few months. Then, one year after de-hubbing took place, the supply of air services was again adjusted. By that time, all airlines had time to react to the new market situation, but also some airline reduced routes or frequencies after unsatisfactory results during the first phase. This led to the share of LCC dropping again. The recovery rate of lost transfer traffic exceeded 80% for most of the second year, as point-to-point traffic increased strongly. In year one, seat capacity was down only 8.9%. This is an exceptionally strong recovery, compared to similar cases. Following the classification of Redondi et al. (2012), this airport faced a ’battleground’ situation, and four similar cases on average have experienced seat capacity reductions of 21.0% in year one, and 22.3% in year two, namely Albany, Orlando, New Orleans and Milan Malpensa (Redondi et al. 2012). The de-hubbing was complete and sudden, which – compared to a case of gradual de-hubbing– gave entrants a signal that re-hubbing by the same airline was impossible, and that large segments could be attracted quickly. A wave of new airlines and new routes were brought to the airport at the same time, which also stimulated traffic with low fares. In comparison to a ‘slow and painful’ de-hubbing, this may be a preferred scenario in terms of traffic recovery. Recovery of traffic does seem to follow an S-curve model, which over time first increases at a high rate, then at a lower rate, and again at a higher rate. Full recovery was calculated to be reached after 19 months. The scatter plot (Figure 3) suggests that there is a strong seasonal effect, and future research should consider correcting for these effects. However the approach presented points into an important avenue for further research, as not only the antecedents of traffic growth, but also drivers of the shape of the recovery curve contain important information for airport planning. Because 99% of the country’s air services use this airport, this case also allows to analysis the direct relationship between capacity and inbound tourism. We have not yet identified any study investigating the effect of dehubbing on inbound tourism. As expected, increases of seat capacity of air services lead to an increase of inbound visitors from that country. The strength of the relationship is likely to be mediated by the relative attractiveness of the origin and the destination country, because routes to for example Spain have led to less increases of inbound tourism then routes to Belgium. In the case discussed, inbound visitor number has increased by 9% in the first year after de-hubbing, while the airport’s capacity has decreased by 9%. While the airport is 173
  • 7. European Journal of Business and Management ISSN 2222-1905 (Paper) ISSN 2222-2839 (Online) Vol.5, No.25, 2013 www.iiste.org struggling to recover, it appears that the tourism industry has overall benefited from the de-hubbing, despite the significant economic negative effects in other sectors. A study conducted in Hungary calculated the spending of visitors arriving by air, including items such as accommodation, meals, buying souvenirs and so on. In 2009 the spending of arriving visitors by air was on average 516 EUR. This figure includes direct and indirect effects of tourism spending (Dusek et al. 2010). Multiplying this figure with the actual number of incremental visitors in 2012 suggest the growth of tourism has led to an incremental spending of 170m EUR. In contrast to this, the Hungarian government estimated the economic effect of losing the national airline Malév to be 46-62 m EUR (tourism revenues and payments to Malév suppliers, Ministry of National Development 2011). Interestingly, the two cases Malév (sudden de-hubbing at Budapest) and ČSA (gradual de-hubbing at Prague) have both been investigated by EU authorities (European Commission 2012a, 2012b), with the outcome supporting the changes introduced by ČSA (announced in September, 2012) but not supportive of Malév (announced in January, 2012). As expected by the Hungarian government (Ministry of National Development 2011), this verdict triggered the airline’s bankruptcy. While a detailed comparison of the two decisions is out of scope, the EU’s reasoning for supporting the changes at ČSA is probably related to the significant compensation which it offered to competitors. This included a commitment to reduce aircraft fleet by more than 50% between 2009 and 2014, to eliminate or reduce its capacity on 16 profitable routes and to forego slots at London Heathrow (against a fee) and other congested airports (without a fee, European Commission 2012b). The intention behind these measures was probably to ensure effective competition leading to market level prices. From an airport’s perspective, however, this approach has led to a reduction of 26% in movements and 14% in passengers during the first four years of restructuring (as of 2012 full year). The study by Redondi et al. (2012) allows benchmarking this outcome against other comparable de-hubbing scenarios. The authors categorised cases depending on the market situation afterwards, and calculated the change of seats offered (cleaned for effects of seasonality) over 4 years since de-hubbing. The average recovery rate by airports with no dominant airline segment (low-cost, unallied, alliance) was a capacity reduction of 25%. Prague airport’s traffic declined by 19% (2012 vs. 2007) which is worse than Budapest which is has a positive growth within two years since dehubbing. One could argue that the ’slow and painful’ de-hubbing scenario favoured by the EU Commission has resulted in the worst possible outcome for the airport in terms of traffic. It should be noted, however, that the Czech government – majority owners of both ČSA and Prague Airport, may have overall benefited, for example due to the national airlines direct and indirect contribution to the countries’s GDP and employment, while Malév’s bankruptcy affected 2600 employees. On the other hand, the overall growth perspectives of airports are much higher in the presence of a hub, and therefore in the long term, re-hubbing, such as in the case of Zurich after the demise of Swissair (Dennis 2005), may lead to better results for the airport operator. From the perspective of a tourism, which is only indirectly benefiting from connecting flights, the above effects suggest that the EU ruling against Hungary may have been a blessing in disguise for the local tourism industry. 5. Limitations and directions for further research The approach presented in this paper has a number of limitations. As with each case study it is only an illustration of a one off event, and may not be comparable to other situations. Traffic recovery is dependent on many other factors, such as the attractiveness of the destination, economic strength of the country and main trading partners, airport charges and incentives, available fleet by potential new airlines and so on. These were not discussed in this paper. The relationship between inbound visitors and seat capacity does not consider that a majority of visitors arrive by land transport. While access to data for inbound tourism by air is often difficult, this could improve the strength of the relationship further. With this case being relatively recent, only 18 months of data was available and another review of the long term effects of de-hubbing may be desirable. This paper was intended to provoke further research into the antecedents and effects of de-hubbing. Firstly, we suggest investigating the impact of de-hubbing on tourism using a larger sample of airports. Secondly, we noted that the sudden de-hubbing scenario presented here was followed by an exceptionally fast recovery. We propose to investigate how the type of de-hubbing (sudden vs. gradual) influences the rate and magnitude of traffic recovery with a larger sample of airports. 6. Conclusion This paper investigates a case of sudden de-hubbing, where the bankruptcy of an airport’s only hub airline led to the loss of practically all connecting flights. Recovery was exceptional, and 80% of lost transfer traffic was 174
  • 8. European Journal of Business and Management ISSN 2222-1905 (Paper) ISSN 2222-2839 (Online) Vol.5, No.25, 2013 www.iiste.org recovered about one year after the event, leaving the airport with a seat capacity of only 8.9% less than during the last year before. The recovery continues and a regression based forecast suggests that full recovery takes 19 months. Airports in comparable situations (Albany, Orlando, New Orleans and Milan Malpensa, Redondi et al. 2012) have experienced seat capacity reductions of 21% in year one, and 22.3% in year two. The route network of the airport changed, with a significant number of unviable routes remaining unserved, but others having been taken over by other airlines, in some cases leading to capacity dumping. In these cases, paired with demand for tourism to Hungary (e.g., from Belgium, U.K. and Norway), the stimulated traffic also led to over proportional increases in inbound tourism. The share of low cost traffic increased significantly, but 18 months after the event, the airport is dominated by neither LCC, nor alliance members. The paper’s contribution is that is investigates the effects of de-hubbing on tourism, which to our knowledge has been published to date. It analyses a case of de-hubbing which compared to most other cases (Redondi et al. 2012) seems to have had a favourable outcome for the local tourism industry. In fact, the additional income of tourism to the affected country was so significant, that one may be pushed to conclude that tourism income develops independently of the presence of a hub airline in some cases, or – in case of that airline’s bankruptcy – may lead to scenarios which are positive for the tourism industry. While the airport’s operator handled 9% less capacity, the number of international visitors grew by 9%, who spent an estimated 170 m EUR more in the country then in the year prior to de-hubbing. At the same time, however, de-hubbing leads to lack of access to a number of markets, serious negative impacts on the competitiveness of the country’s economy and trade relations as well as reduces employment. These effects, however, were out of scope for this study. References Anonymous (2012), “Less than seven hours after Malev collapse, Ryanair announces new Budapest base”, The Journal, Dublin. Retrieved online from http://jrnl.ie/345179 on 7-9-13. Anker, R. (2012), “Wizz Air still #1 LCC in most of its ‘home’ markets”, Airline Network News and Analysis, Top Story, 30-5-2012, retrieved online from http://www.anna.aero/2012/05/30/wizz-air-still- number-1-lcc- inmost-of-its-home-markets/ on 3-9-13. Bhadra, D. (2009), “Race to the bottom or swimming upstream: performance analysis of US airlines”, Journal of Air Transport Management 15 (5), 227-235. Borenstein, S. (1989), "Hubs and High Fares: Dominance and Market Power in the U.S. Airline Industry," Rand Journal of Economics 20 (3), 344-365. Borenstein, S. & Rose, N. (2003), “The Impact of Bankruptcy on Airline Service Levels”, American Economic Review Papers and Proceedings 93 (2), 415-419. Dennis, N. (2005), “Industry consolidation and future airline network structures in Europe”. Journal of Air Transport Management 11, 175-183. Dudden, J.C. (2006), “Multi-hub network configurations – a temporary or permanent outcome of airline consolidation?” Review of Network Economics 5, 421-434. Dusek, T., Lukovics, M., & Bohl, P. (2011), “The economic impact of the Budapest Airport on the local economy”, proceedings of ERSA Conference, 09/2011, European Regional Science Association. European Commission (2012a), “Commission Decision of 09.01.2012 on the State Aid Implemented by Hungary In favour of Malév Hungarian Airlines Zrt.”, Brussels. European Commission (2012b), “Commission Decision of 19.09.2012 on the State Air No SA.30908, ČSA – Czech Airlines – Restructuring plan”, Brussels. Evans, W.N. & Kessides, I. (1993) “Localized Market Power in the U.S. Airline Industry” Review of Economics and Statistics 75, 66-75. Hamel, J., Dufour, S. & Fortin, D. (1993), “Case study methods”, Newbury Park, CA: Sage. Landry, D. (2013), “Wizz Air CEO: ‘No reasonable chance’ for Sólyom success”, Budapest Business Journal, 69-2013, retrieved online from http://www.bbj.hu/business/ on 7-9-2013. Ministry of National Development (2011), “White Paper on the Malév Heritage”, Ministry of National Development, Hungary, November 2011, retrieved online from http://www.nfm.gov.hu on 7-9-2013. Motulsky, H. & Christopoulos A. (2004), “Fitting models to biological data using linear and nonlinear 175
  • 9. European Journal of Business and Management ISSN 2222-1905 (Paper) ISSN 2222-2839 (Online) Vol.5, No.25, 2013 www.iiste.org regression”, Oxford: Oxford University Press. Redondi, R., Malighetti, P. & Paleari, S. (2010), “De-Hubbing cases and recovery patterns”, working paper 082010, Department of Economics and Technology Management, University of Bergamo, 12p. Redondi, R.,Malighetti, P. & Paleari, S. (2012), ”De-hubbing of airports and their recovery patterns”, Journal of Air Transport Management 18, 1-4. Roberts, J., Nelson, C. & Morrison, P. (2005), “A Prelaunch Diffusion Model for Evaluating Market Defence Strategies”, Marketing Science 24 (1), 150-164. Simon, Z. (2012), “Malev Airline Stops Services After 66 Years as Hungary Moves to Cut Losses”, bloomberg.com, 3-2-2012, retrieved from http://www.bloomberg.com/news/2012-02-03/malev-stops- flyingafter-66-years-as-hungary-cuts-its-losses.html on 5-9-2013. Tan, K.M. (2012), “The Effect of De-Hubbing on Airfares”, working paper, Department of Economics, The Ohio State University, retrieved from http://ssrn.com/abstract=2102893 on 16-8-2013. Vovlew, T.M. (2001), “The ‘Southwest Effect’ in multi-airport regions”, Journal of Air Transport Management 7, 251-258. Yin, R.K. (1984), “Case study research: Design and methods”, Newbury Park, CA: Sage. Table 3. Monthly Passengers at Budapest Airport and Transfer Share (2011-2012) January 2011 Total Passengers Malév Passengers Transfer Share 2012 Total Passengers Malév Passengers Transfer Share February March April May June July August September October November December TOTAL 526,921 487,858 637,468 734,461 776,704 827,457 950,396 958,559 894,188 845,815 646,171 634,655 8,920,653 172,993 156,336 218,801 260,525 261,125 290,717 362,194 359,923 344,698 343,936 252,601 255,533 3,279,382 15% 14% 13% 16% 14% 16% 20% 19% 18% 20% 17% 18% 568,782 424,633 580,977 712,064 758,243 795,679 892,015 895,183 840,417 796,721 642,326 596,980 8,504,020 230,840 13,354 0 0 0 0 0 0 0 0 0 0 244,194 20% 2% 0% 0% 0% 0% 0% 0% 0% 1% 1% 0% source: Budapest Airport data Table 4. Largest Growing Markets to/from Hungary (Seat Capacity and Visitors) Markets Norway 2012 Capacity to/from Hungary2012 Int'l visitors to Hungary Seats Visitors growth (%) growth (%) 82,512 50.5% 44,916 26.4% Spain 254,726 46.7% 143,604 7.2% Belgium 294,711 38.1% 71,257 23.0% Poland 163,264 31.0% 194,035 8.6% Ireland 120,897 18.5% 20,160 28.6% Italy 504,318 17.5% 229,022 16.0% source: based on data from Budapest Airport and National Statistics Office (KSH) 176
  • 10. European Journal of Business and Management ISSN 2222-1905 (Paper) ISSN 2222-2839 (Online) Vol.5, No.25, 2013 www.iiste.org Figure 1. Scatter Plot of Routes to/from Budapest airport (Capacity/Visitors) source: based on data from Budapest Airport and National Statistics Office (KSH) Table 5. Relationship between Change of Seat Capacity and International Visitors (2011-2012) BUD dep. seat capacity No. of Internationall visitors to Hungary countries Declining Stable Growing Growing 0 1 7 Stable 0 12 2 Declining 2 11 6 source: based on data from Budapest Airport and National Statistics Office (KSH) Table 6. Decline of Passenger Traffic and Flights at Prague Airport (2009-2013) Percentage of reduction vs. May '08 - Prague Airport May '09 May '10 May '11 May '12 May '13 Passengers -14% -12% -6% -19% -15% Transfer Pass. -7% -2% -10% -66% -70% Flights -11% -13% -20% -31% -28% source: Prague Airport 177
  • 11. European Journal of Business and Management ISSN 2222-1905 (Paper) ISSN 2222-2839 (Online) Vol.5, No.25, 2013 www.iiste.org Figure 2. Annual Visitors (Hungary/Czech Rep.) vs. Airport Traffic (BUD/PRG) source: based on data from Budapest airport, National Statistics Office (KSH) and Prague Airport Table 7. Fit of Alternative Regression Models (Y=recovery rate, t=time) Model Linear Quadratic Cubic Logarithmic Y = b0 + (b1 * t) 2 Y = b0 + (b1 * t) + (b2 * t ) 2 3 Y = b0 + (b1 * t) + (b2 * t ) + (b3 * t ) Y = b0 + (b1 * ln(t)) Equation S Y = exp (b0 + (b1/t)) R Square .225 .455*** .480*** .429** Std. Error .214 .186 .188 .184 .828* .292 * significant at p<.001,** at p<.01, *** at p<.05. AIC -51.544 -55.893 -54.712 -57.052 -40.484 Figure 3. Plot of Transfer Traffic Recovery Rate Against Time and Regression Curves 178
  • 12. This academic article was published by The International Institute for Science, Technology and Education (IISTE). The IISTE is a pioneer in the Open Access Publishing service based in the U.S. and Europe. The aim of the institute is Accelerating Global Knowledge Sharing. More information about the publisher can be found in the IISTE’s homepage: http://www.iiste.org CALL FOR JOURNAL PAPERS The IISTE is currently hosting more than 30 peer-reviewed academic journals and collaborating with academic institutions around the world. There’s no deadline for submission. Prospective authors of IISTE journals can find the submission instruction on the following page: http://www.iiste.org/journals/ The IISTE editorial team promises to the review and publish all the qualified submissions in a fast manner. All the journals articles are available online to the readers all over the world without financial, legal, or technical barriers other than those inseparable from gaining access to the internet itself. Printed version of the journals is also available upon request of readers and authors. MORE RESOURCES Book publication information: http://www.iiste.org/book/ Recent conferences: http://www.iiste.org/conference/ IISTE Knowledge Sharing Partners EBSCO, Index Copernicus, Ulrich's Periodicals Directory, JournalTOCS, PKP Open Archives Harvester, Bielefeld Academic Search Engine, Elektronische Zeitschriftenbibliothek EZB, Open J-Gate, OCLC WorldCat, Universe Digtial Library , NewJour, Google Scholar