Download to read offline

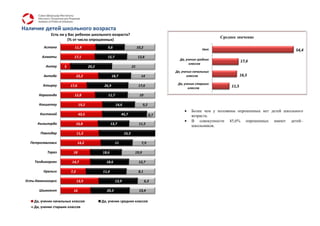
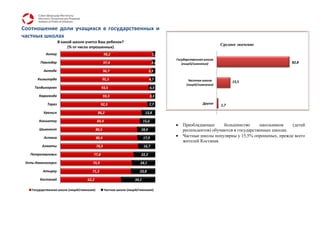
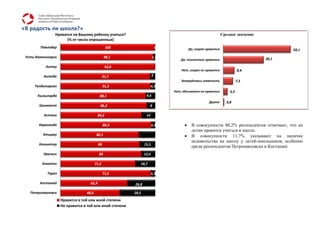
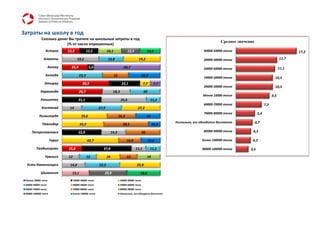

Социологический опрос, проведенный в сентябре 2012 года в 16 городах Казахстана, показал, что 45,6% респондентов имеют детей школьного возраста. Преобладающее большинство школьников обучаются в государственных школах, при этом 80,2% родителей довольны тем, как их детям нравится учиться. Основные тревоги родителей связаны с расходами на обучение и качеством образования.


