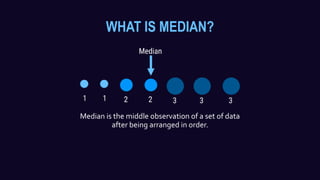
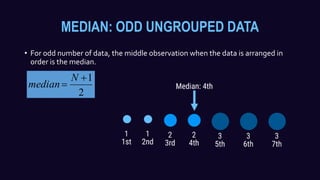
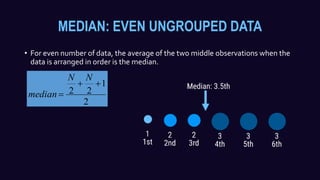
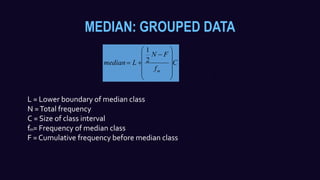
MEASURES OF CENTRAL TENDENCY
MEDIANHAIKAL IRFAN FITRI AFZAN OWEN
3K2
WHAT IS MEDIAN?
Median is the middle observation of a set of data
after being arranged in order.
MEDIAN: ODD UNGROUPED DATA
2
1

N
median
• For odd number of data, the middle observation when the data is arranged in
order is the median.
MEDIAN: EVEN UNGROUPED DATA
• For even number of data, the average of the two middle observations when the
data is arranged in order is the median.
2
1
22


NN
median
EXAMPLE QUESTIONS
1. Determine the median for each of the following set of data.
a) 10, 5, 12, 7, 14, 9, 17
b) 18, 19, 15, 12, 20, 13
2. Determine the median for each of the following sets of data.
a) 21, 25, 34, 26, 21, 39, 23
b) 19, 17, 20, 16, 19, 15, 16, 19
MEDIAN: GROUPED DATA
C
f
FN
Lmedian
m













 2
1
L = Lower boundary of median class
N =Total frequency
C = Size of class interval
f = Frequency of median class
F = Cumulative frequency before median class
mf
m
EXAMPLE QUESTIONS
• The following table shows the frequency distributions of the heights of a group
of students in a certain class.
Heights (cm) Frequency
141 - 145 3
146 - 150 6
151 - 155 9
156 - 160 14
161 - 165 10
166 - 170 5
171 - 175 3
Estimate the median height of the
students.
Estimate the number of students that
are more than 158cm in height

SPM Additional Mathematics / +Math - Median

  • 1.
    MEASURES OF CENTRALTENDENCY MEDIANHAIKAL IRFAN FITRI AFZAN OWEN 3K2
  • 2.
    WHAT IS MEDIAN? Medianis the middle observation of a set of data after being arranged in order.
  • 3.
    MEDIAN: ODD UNGROUPEDDATA 2 1  N median • For odd number of data, the middle observation when the data is arranged in order is the median.
  • 4.
    MEDIAN: EVEN UNGROUPEDDATA • For even number of data, the average of the two middle observations when the data is arranged in order is the median. 2 1 22   NN median
  • 5.
    EXAMPLE QUESTIONS 1. Determinethe median for each of the following set of data. a) 10, 5, 12, 7, 14, 9, 17 b) 18, 19, 15, 12, 20, 13 2. Determine the median for each of the following sets of data. a) 21, 25, 34, 26, 21, 39, 23 b) 19, 17, 20, 16, 19, 15, 16, 19
  • 6.
    MEDIAN: GROUPED DATA C f FN Lmedian m              2 1 L = Lower boundary of median class N =Total frequency C = Size of class interval f = Frequency of median class F = Cumulative frequency before median class mf m
  • 7.
    EXAMPLE QUESTIONS • Thefollowing table shows the frequency distributions of the heights of a group of students in a certain class. Heights (cm) Frequency 141 - 145 3 146 - 150 6 151 - 155 9 156 - 160 14 161 - 165 10 166 - 170 5 171 - 175 3 Estimate the median height of the students. Estimate the number of students that are more than 158cm in height