


![60
S.V. Institute of Management, Kadi.
7.2. INDEPENDENT SAMPLE T-TEST
Independent Sample T-Test with Preference for the Advertisements on Car and
Gender
H0:1 There is no difference in Perception towards Top of the Mind for the advertisement on Car
and Gender of the respondents [t (298) = 0.757, p=0.450].
H0:2 There is no difference in Perception towards Ease of remembering the advertisement on Car
and Gender of the respondents [t (298) = -0.307, p=0.759].
H0:3 There is no difference in Perception towards Brand Recalling for the advertisement on Car
and Gender of the respondents [t (298) = -0.639, p=0.523].
H0:4 There is no difference in Perception towards Something New for the advertisement on Car
and Gender of the respondents [t (298) = 2.457, p=0.015].
H0:5 There is no difference in Perception towards Eye Catching for the advertisement on Car and
Gender of the respondents [t (298) = 3.490, p=0.001].
Independent Sample T-Test with Buying Intention for the Advertisements on Car
and Gender
H0:1 There is no difference in Buying Intention towards I will search for the product advertisement
on Car and Gender of the respondents [t (298) = 1.195, p=0.233].
H0:2 There is no difference in Buying Intention towards I am in interested in the product
advertisement on Car and Gender of the respondents [t (298) = 1.222., p=0.223].
H0:3 There is no difference in Buying Intention towards I will buy the product advertisement on
Car and Gender of the respondents [t (298) = 0.566, p=0.572].](https://image.slidesharecdn.com/spinningmantrapvt-171128070657/85/Spinning-mantra-pvt-ltd-63-320.jpg)
![61
S.V. Institute of Management, Kadi.
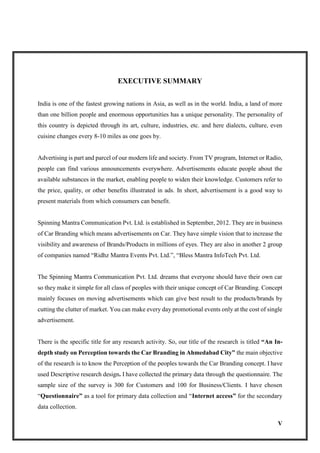
H0:4 There is no difference in Buying Intention towards I can recall the product advertisement on
Car and Gender of the respondents [t (298) = 2.058, p=0.040].
Interpretation for independent Sample T-Test with Preference for the
Advertisements on Car and Gender
H0:1- There is no difference in Perception towards Top of the Mind for the advertisement on Car
and Gender of the respondents.
Interpretation: Here the significance value is 0.450 which is more than 0.05 so alternative
hypothesis is rejected, it means that there is no difference in Perception towards Top of the Mind
for the advertisement on Car and Gender of the respondents. Here the females have more impact
on their mind related Car Branding.
H0:2- There is no difference in Perception towards Ease of remembering the advertisement on Car
and Gender of the respondents.
Interpretation: Here the significance value is 0.450 which is more than 0.05 so alternative
hypothesis is rejected, it means that there is no difference in Perception towards Ease of
remembering the advertisement on Car and Gender of the respondents. Males can easily remember
the advertisement as compare to females.
H0:3- There is no difference in Perception towards Brand Recalling for the advertisement on Car
and Gender of the respondents.
Interpretation: Here the significance value is 0.523 which is more than 0.05 so alternative
hypothesis is rejected, it means that there is no difference in Perception towards Brand Recalling
for the advertisement on Car and Gender of the respondents. Males can recall the product if the
watch advertisements on car.](https://image.slidesharecdn.com/spinningmantrapvt-171128070657/85/Spinning-mantra-pvt-ltd-64-320.jpg)


![64
S.V. Institute of Management, Kadi.
7.3. ONE-WAY ANOVA
7.3.1. One-Way ANOVA for Customer
One-Way ANOVA with Preference for Advertisement on Car and Age
H0:1 A one-way ANOVA was conducted to compare the significance difference in the Preference
towards top of the mind for advertisement on Car and Age of the respondents. There was no
significant difference in Preference towards Top of the Mind for advertisement on Car and Age of
the respondents at the p>0.05 level for three conditions [F (3) = 1.518, p=0.210].
H0:2 A one-way ANOVA was conducted to compare the significance difference in the Preference
towards ease to remember for advertisement on Car and Age of the respondents. There was no
significant difference in Preference towards ease to remember for advertisement on Car and Age
of the respondents at the p>0.05 level for three conditions [F (3) = 1.124, p=0.340].
H0:3 A one-way ANOVA was conducted to compare the significance difference in the Preference
towards brand recalling for advertisement on Car and Age of the respondents. There was no
significant difference in Preference towards brand recalling for advertisement on Car and Age of
the respondents at the p>0.05 level for three conditions [F (3) = 0.302, p=0.824].
H0:4 A one-way ANOVA was conducted to compare the significance difference in the Preference
towards something new for advertisement on Car and Age of the respondents. There was no
significant difference in Preference towards something new for advertisement on Car and Age of
the respondents at the p>0.05 level for three conditions [F (3) = 0.615, p=0.606].
H0:5 A one-way ANOVA was conducted to compare the significance difference in the Preference
towards eye catching for advertisement on Car and Age of the respondents. There was no
significant difference in Preference towards eye catching for advertisement on Car and Age of the
respondents at the p>0.05 level for three conditions [F (3) = 0.760, p=0.517].](https://image.slidesharecdn.com/spinningmantrapvt-171128070657/85/Spinning-mantra-pvt-ltd-67-320.jpg)
![65
S.V. Institute of Management, Kadi.
One-way ANOVA with Buying Intention for advertisement on Car and Age
H0:1 A one-way ANOVA was conducted to compare the significance difference in the Buying
Intention towards I will search for the product for the advertisement on Car and Age of the
respondents. There was no significant difference in Buying Intention towards I will search for the
product for advertisement on Car and Age of the respondents at the p>0.05 level for three
conditions [F (3) = 0.911, p=0.436].
H0:2 A one-way ANOVA was conducted to compare the significance difference in the Buying
Intention towards I am interested in the product for the advertisement on Car and Age of the
respondents. There was significant difference in Buying Intention towards I am interested in the
product for advertisement on Car and Age of the respondents at the p>0.05 level for three
conditions [F (3) = 2.819, p=0.039].
H0:3 A one-way ANOVA was conducted to compare the significance difference in the Buying
Intention towards I will buy the product for the advertisement on Car and Age of the respondents.
There was no significant difference in Buying Intention towards I will buy the product for
advertisement on Car and Age of the respondents at the p>0.05 level for three conditions [F (3) =
2.165, p=0.092].
H0:4 A one-way ANOVA was conducted to compare the significance difference in the Buying
Intention towards I can recall the product for the advertisement on Car and Age of the respondents.
There was no significant difference in Buying Intention towards I can recall the product for
advertisement on Car and Age of the respondents at the p>0.05 level for three conditions [F (3) =
0.493, p=0.688].](https://image.slidesharecdn.com/spinningmantrapvt-171128070657/85/Spinning-mantra-pvt-ltd-68-320.jpg)
![66
S.V. Institute of Management, Kadi.
7.3.2. One-Way ANOVA for Clients/Business
One-way ANOVA with Perception for advertisement on Car and Type of Industry
H0:1 A one-way ANOVA was conducted to compare the significance difference in the Perception
towards reach to sufficient numbers of customers for the advertisement on Car and Type of
Industry of the respondents. There was no significant difference in Perception towards reach to
sufficient numbers of customers for advertisement on Car and Type of Industry of the respondents
at the p>0.05 level for three conditions [F (4) = 0.024, p=0.999].
H0:2 A one-way ANOVA was conducted to compare the significance difference in the Perception
towards break the clutter of traditional media for the advertisement on Car and Type of Industry
of the respondents. There was no significant difference in Perception towards Break the Clutter of
traditional media for advertisement on Car and Type of Industry of the respondents at the p>0.05
level for three conditions [F (4) = 0.894, p=0.471].
H0:3 A one-way ANOVA was conducted to compare the significance difference in the Perception
towards have exceptional visibility for the advertisement on Car and Type of Industry of the
respondents. There was no significant difference in Perception towards have exceptional visibility
for advertisement on Car and Type of Industry of the respondents at the p>0.05 level for three
conditions [F (4) = 0.473, p=0.756].
H0:4 A one-way ANOVA was conducted to compare the significance difference in the Perception
towards better exposure than traditional media for the advertisement on Car and Type of Industry
of the respondents. There was no significant difference in Perception towards better exposure than
traditional media for advertisement on Car and Type of Industry of the respondents at the p>0.05
level for three conditions [F (4) = 1.024, p=0.399].
H0:5 A one-way ANOVA was conducted to compare the significance difference in the Perception
towards reach to specific target segment for the advertisement on Car and Type of Industry of the
respondents. There was no significant difference in Perception towards reach to specific target](https://image.slidesharecdn.com/spinningmantrapvt-171128070657/85/Spinning-mantra-pvt-ltd-69-320.jpg)
![67
S.V. Institute of Management, Kadi.
segment for advertisement on Car and Type of Industry of the respondents at the p>0.05 level for
three conditions [F (4) = 1.389, p=0.244].
H0:6 A one-way ANOVA was conducted to compare the significance difference in the Perception
towards be noticed by the consumers for the advertisement on Car and Type of Industry of the
respondents. There was no significant difference in Perception towards be noticed by the
consumers for advertisement on Car and Type of Industry of the respondents at the p>0.05 level
for three conditions [F (4) = 1.298, p=0.276].
H0:7 A one-way ANOVA was conducted to compare the significance difference in the Perception
towards be recalled by the consumers for the advertisement on Car and Type of Industry of the
respondents. There was no significant difference in Perception towards be recalled by the
consumers for advertisement on Car and Type of Industry of the respondents at the p>0.05 level
for three conditions [F (4) = 0.807, p=0.524].
One-way ANOVA with Perception for the advertisement on Car and Type of
Industry
H0:1 A one-way ANOVA was conducted to compare the significance difference in the Perception
towards car branding is new and effective concept of advertising for the advertisement on Car and
Type of Industry of the respondents. There was no significant difference in Perception towards car
branding is new and effective concept of advertising for advertisement on Car and Type of Industry
of the respondents at the p>0.05 level for three conditions [F (4) = 1.320, p=0.268].
H0:2 A one-way ANOVA was conducted to compare the significance difference in the Perception
towards I like to see my brand on car for the advertisement on Car and Type of Industry of the
respondents. There was no significant difference in Perception towards I like to see my brand on
car for advertisement on Car and Type of Industry of the respondents at the p>0.05 level for three
conditions [F (4) = 1.960, p=0.107].](https://image.slidesharecdn.com/spinningmantrapvt-171128070657/85/Spinning-mantra-pvt-ltd-70-320.jpg)
![68
S.V. Institute of Management, Kadi.
H0:3 A one-way ANOVA was conducted to compare the significance difference in the Perception
towards car branding is not useful concept for the advertisement on Car and Type of Industry of
the respondents. There was significant difference in Perception towards car branding is not useful
concept for advertisement on Car and Type of Industry of the respondents at the p>0.05 level for
three conditions [F (4) = 2.618, p=0.040].
H0:4 A one-way ANOVA was conducted to compare the significance difference in the Perception
towards car branding may spoil the brand image for the advertisement on Car and Type of Industry
of the respondents. There was no significant difference in Perception towards car branding may
spoil the brand image for advertisement on Car and Type of Industry of the respondents at the
p>0.05 level for three conditions [F (4) = 1.067, p=0.377].
H0:5 A one-way ANOVA was conducted to compare the significance difference in the Perception
towards car branding is cost effective for the advertisement on Car and Type of Industry of the
respondents. There was no significant difference in Perception towards car branding is cost
effective for advertisement on Car and Type of Industry of the respondents at the p>0.05 level for
three conditions [F (4) = 1.425, p=0.232].
One-way ANOVA with Perception for the advertisement on Car and Budget
H0:1 A one-way ANOVA was conducted to compare the significance difference in the Perception
towards reach to sufficient numbers of peoples for the advertisement on Car and Perception of the
respondents. There was no significant difference in Perception towards reach to sufficient numbers
of peoples for the advertisement on Car and Budget of the respondents at the p>0.05 level for three
conditions [F (1) = 0.160, p=0.690].
H0:2 A one-way ANOVA was conducted to compare the significance difference in the Perception
towards break the clutter of traditional media for the advertisement on Car and Perception of the
respondents. There was no significant difference in Perception towards break the clutter of
traditional media for the advertisement on Car and Budget of the respondents at the p>0.05 level
for three conditions [F (1) = .057, p=0.812].](https://image.slidesharecdn.com/spinningmantrapvt-171128070657/85/Spinning-mantra-pvt-ltd-71-320.jpg)
![69
S.V. Institute of Management, Kadi.
H0:3 A one-way ANOVA was conducted to compare the significance difference in the Perception
towards have exceptional visibility for the advertisement on Car and Perception of the respondents.
There was no significant difference in Perception towards exceptional visibility for the
advertisement on Car and Budget of the respondents at the p>0.05 level for three conditions [F (1)
= 3.074, p=0.083].
H0:4 A one-way ANOVA was conducted to compare the significance difference in the Perception
towards better exposure than traditional media for the advertisement on Car and Perception of the
respondents. There was no significant difference in Perception towards better exposure than
traditional media for the advertisement on Car and Budget of the respondents at the p>0.05 level
for three conditions [F (1) = 2.065, p=0.154].
H0:5 A one-way ANOVA was conducted to compare the significance difference in the Perception
towards reach to specific target segment for the advertisement on Car and Perception of the
respondents. There was no significant difference in Perception towards reach to specific target
segment for the advertisement on Car and Budget of the respondents at the p>0.05 level for three
conditions [F (1) = 2.118, p=0.149].
H0:6 A one-way ANOVA was conducted to compare the significance difference in the Perception
towards be noticed by the consumers for the advertisement on Car and Perception of the
respondents. There was no significant difference in Perception towards be noticed by the
consumers for the advertisement on Car and Budget of the respondents at the p>0.05 level for three
conditions [F (1) = 0.387, p=0.535].
H0:7 A one-way ANOVA was conducted to compare the significance difference in the Perception
towards be recalled by the consumers for the advertisement on Car and Perception of the
respondents. There was no significant difference in Perception towards be recalled by the
consumers for the advertisement on Car and Budget of the respondents at the p>0.05 level for three
conditions [F (1) = 2.542, p=0.114].](https://image.slidesharecdn.com/spinningmantrapvt-171128070657/85/Spinning-mantra-pvt-ltd-72-320.jpg)
![70
S.V. Institute of Management, Kadi.
One-way ANOVA with Perception for the advertisement on Car and Budget
H0:1 A one-way ANOVA was conducted to compare the significance difference in the Perception
towards car branding is new and effective concept of advertising for the advertisement on Car and
Budget of the respondents. There was significant difference in Perception towards car branding is
new and effective concept of advertising for advertisement on Car and Budget of the respondents
at the p>0.05 level for three conditions [F (4) = 5.338, p=0.023].
H0:2 A one-way ANOVA was conducted to compare the significance difference in the Perception
towards I like see my brand on car for the advertisement on Car and Budget of the respondents.
There was significant difference in Perception towards I like see my brand on car for advertisement
on Car and Budget of the respondents at the p>0.05 level for three conditions [F (4) = 6.571,
p=0.012].
H0:3 A one-way ANOVA was conducted to compare the significance difference in the Perception
towards car branding is not useful concepts and Budget of the respondents. There was no
significant difference in Perception towards car branding is not useful concepts for advertisement
on Car and Budget of the respondents at the p>0.05 level for three conditions [F (4) = 2.242,
p=0.138].
H0:4 A one-way ANOVA was conducted to compare the significance difference in the Perception
towards car branding may spoil the brand image for the advertisement on Car and Budget of the
respondents. There was no significant difference in Perception towards car branding may spoil the
brand image for advertisement on Car and Budget of the respondents at the p>0.05 level for three
conditions [F (4) = 1.219, p=0.272].
H0:5 A one-way ANOVA was conducted to compare the significance difference in the Perception
towards car branding is cost effective for the advertisement on Car and Budget of the respondents.
There was no significant difference in Perception towards car branding is cost effective for
advertisement on Car and Budget of the respondents at the p>0.05 level for three conditions [F (4)
= 2.664, p=0.106].](https://image.slidesharecdn.com/spinningmantrapvt-171128070657/85/Spinning-mantra-pvt-ltd-73-320.jpg)


![80
S.V. Institute of Management, Kadi.
QUESTIONNAIRE
Dear Sir/Madam,
I am the student of S. V. Institute of Management, Kadi. As a part of my curriculum, I am
preparing a research project on the title “An In-depth study on perception towards the Car Branding
in Ahmedabad City”. For fulfilling the research requirements, I request you to answer the following
question and help me in my work. I ensure you that the answers given by you will be kept
confidential and will be used for academic purpose only.
(Use ‘√’ to indicate your choice)
1. Are you aware about the various Advertising platforms?
(a) Kiosk Advertising (LCDs) [ ] (b) TV [ ]
(c) Newspapers [ ] (d) Magazines [ ]
(e) Mall Activity [ ] (f) Digital Marketing [ ]
(g) Hoardings [ ] (h) Road Show [ ]
(i) Radio [ ] (j) Other………………………..
2. Do you admire the advertisements?
(a) Yes [ ] (b) No [ ]
3. For you which media is best for remembering the advertisements?
(a) Kiosk Advertising (LCDs) [ ] (b) TV [ ]
(c) Newspapers [ ] (d) Magazines [ ]
(e) Mall Activity [ ] (f) Digital Marketing [ ]
(g) Hoardings [ ] (h) Road Show [ ]
(i) Radio [ ] (j) Other………………………..
4. Are you aware of Car Branding (Advertisement on Cars)?
(a) Yes [ ] (b) No [ ]](https://image.slidesharecdn.com/spinningmantrapvt-171128070657/85/Spinning-mantra-pvt-ltd-83-320.jpg)
![81
S.V. Institute of Management, Kadi.
5. Rate after seeing the Car Branding?
Statements Strongly
Agree
Agree Neutral Disagree Strongly
Disagree
Top of the Mind
Easy to remember
Brand Recalling
Something New
Eye Catching
6. After watching the advertisement on the car…
Statements Strongly
Agree
Agree Neutral Disagree Strongly
Disagree
I will search for the product
I am interested in the product
I will buy the product
I can recall the product
7. Do you have a car?
(a) Yes [ ] (b) No [ ]
8. Will you prefer such advertisements on your car?
(a) Yes [ ] (b) No [ ]](https://image.slidesharecdn.com/spinningmantrapvt-171128070657/85/Spinning-mantra-pvt-ltd-84-320.jpg)
![82
S.V. Institute of Management, Kadi.
9. How likely would you recommend Car Branding to your Friend/Relatives/Colleagues?
Please Tick [ √ ] any one from the given scale.
Not Extreme
Likely Likely
1 2 3 4 5 6 7
Demographic Detail:
Name : ………………………………………………………………………….....
Address/Area : …………………………………………………………………………….
Gender : .....................................................................................................................
Occupation : …………………………………………………………………………….
Age :
(a) 20 to 30 years [ ] (b) 31 to 40 years [ ]
(c) 41 to 50 years [ ] (d) 51 to 60 years [ ]
(e) 61 years and above [ ]
Contact No. : …………………………………………………………………………….
Email ID : …………………………………………………………………………….](https://image.slidesharecdn.com/spinningmantrapvt-171128070657/85/Spinning-mantra-pvt-ltd-85-320.jpg)
![83
S.V. Institute of Management, Kadi.
QUESTIONNAIRE
Dear Sir/Madam,
I am the student of S. V. Institute of Management, Kadi. As a part of my curriculum, I am
preparing a research project on the title “An In-depth study on perception towards the Car Branding
in Ahmedabad City”. For fulfilling the research requirements, I request you to answer the following
question and help me in my work. I ensure you that the answers given by you will be kept
confidential and will be used for academic purpose only.
(Use ‘√’ to indicate your choice)
1. You are in business of?
(a) Manufacturer or Producer [ ] (b) Service Provider [ ]
(c) Both (a) & (b) [ ]
2. In which type of Industry you belong?
……………………………………….
3. Which advertisement media you are using?
(Tick ‘√’ multiple options)
(a) Radio [ ] (b) Kiosk Marketing [ ]
(c) TVC [ ] (d) Newspapers & Magazines [ ]
(e) Mall Activity [ ] (f) Hoardings [ ]
(g) Digital Marketing [ ] (h) Others [ ]
4. What is your Approximate Budget for the Advertisements in a year in INR?
(a) Below Rs.5, 00,000 [ ] (b) Rs.5, 00,000 to 15, 00,000 [ ]
(c) Rs.15, 00,000 to 30, 00,000 [ ] (d) Rs.30, 00,000 to 50, 00,000 [ ]
(e) Rs.50, 00,000 to 75, 00,000 [ ] (f) Rs.75, 00,000 and above [ ]](https://image.slidesharecdn.com/spinningmantrapvt-171128070657/85/Spinning-mantra-pvt-ltd-86-320.jpg)
![84
S.V. Institute of Management, Kadi.
5. How you are doing advertisements for you brand?
(a) In-House Ads [ ] (b) Out House Agency [ ]
(c) Both (a) & (b) [ ]
6. Who is your target audience/segment?
……………………………………………………….
7. Are you aware of Car Branding (Advertisements on Car)?
(a) Yes [ ] (b) No [ ]
8. If you do advertising on Car then your brand will…
Statements Strongly
Agree
Agree Neutral Disagree Strongly
Disagree
Reach to sufficient numbers of
peoples.
Break the Clutter of Traditional
Media.
Have Exceptional Visibility.
Better Exposure than Traditional
Media.
Reach to Specific Target
Segment.
Be Noticed by the Consumers.
Be Recalled by the Consumers.](https://image.slidesharecdn.com/spinningmantrapvt-171128070657/85/Spinning-mantra-pvt-ltd-87-320.jpg)
![85
S.V. Institute of Management, Kadi.
9. State the Level of Agreement for below statements.
Statements Strongly
Agree
Agree Neutral Disagree Strongly
Disagree
Car Branding is New and
Effective concept of Advertising.
I like to see my Brand on Car.
Car Branding is not useful
concepts.
Car Branding may spoil the
Brand Image.
Car Branding is Cost Effective.
10. Suppose you choose Car Branding than for what Purpose / Occasion will you choose Car
Branding? (Tick ‘√’ multiple options)
(a) To create Awareness [ ]
(b) To remind about the brand to Consumers [ ]
(c) For New Product Launch [ ]
(d) During Festivals [ ]
(e) During Vacation [ ]
(f) During Marriage Seasons [ ]
(g) Others…………………………………………………..
Demographic Details:
Name of the Company : ................................................................................................................
Name of the Contact Person : …………………………………………………………………………
Company Address : …………………………………………………………………………
Contact No. : …………………………………………………………………………
Email ID : …………………………………………………………………………](https://image.slidesharecdn.com/spinningmantrapvt-171128070657/85/Spinning-mantra-pvt-ltd-88-320.jpg)

India is rapidly growing and the document highlights its advertising landscape, focusing on the unique concept of car branding introduced by Spinning Mantra Communication Pvt. Ltd. The research aims to understand public perception towards this innovative advertising method in Ahmedabad, using a sample of 300 customers and 100 businesses for data collection. Furthermore, it explores the global and Indian advertising industry's historical context, current trends, and future projections, emphasizing the digital transformation and evolving consumer behaviors.