Downloaded 120 times


![195
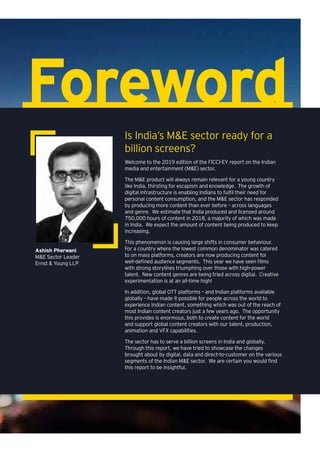
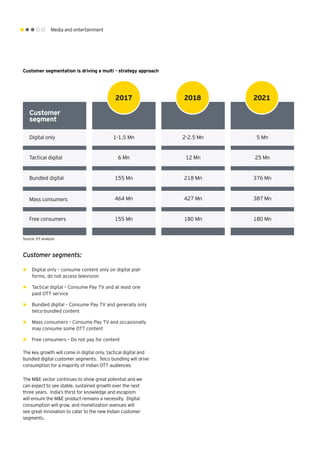
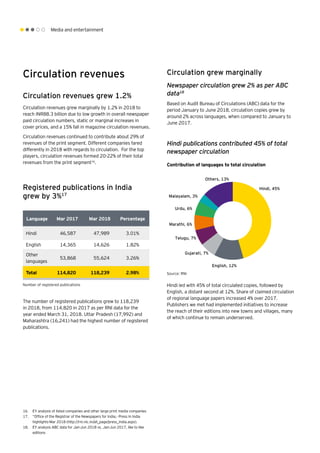
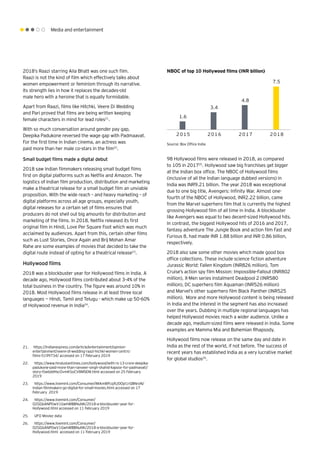
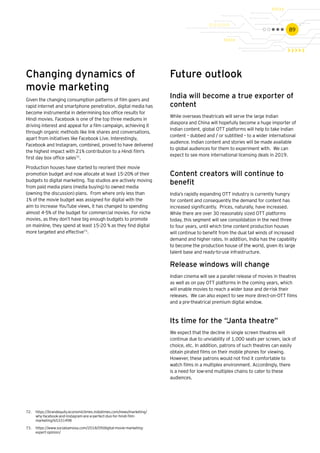
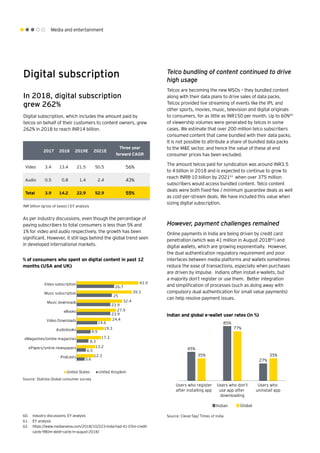
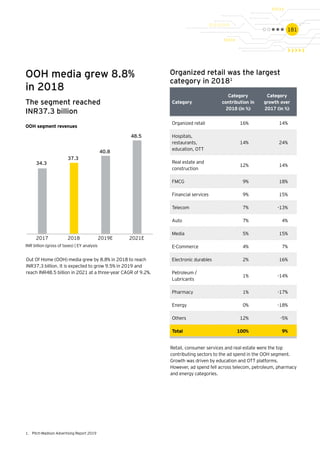
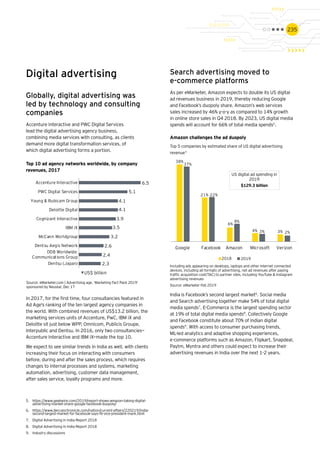
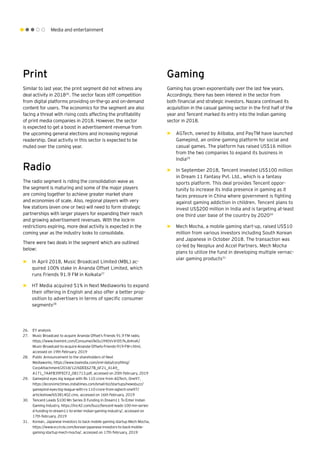
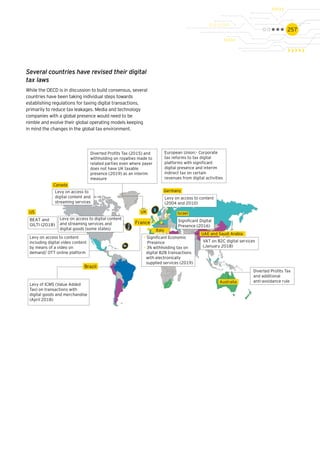
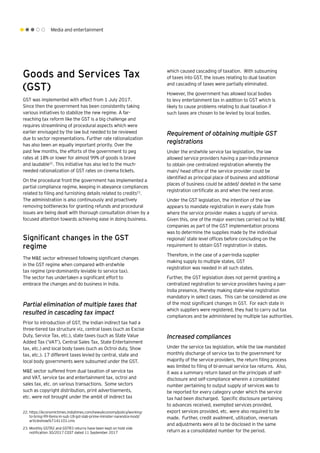
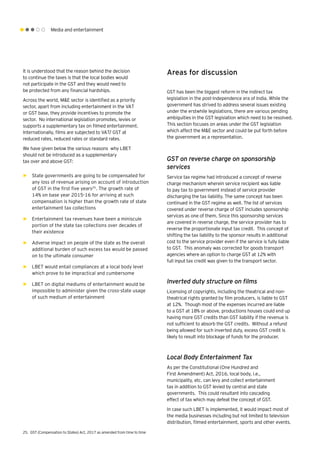
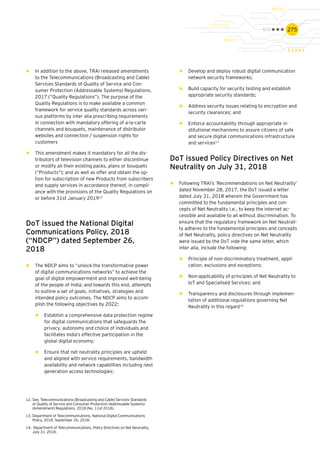
Measurement of listenership
remained an issue
Listenership measurement remains a challenge- except
for the four metros where Radio Audience Measurement
(RAM) data is available, listenership measurement is the
biggest pressing challenge in other cities. At present,
the segment is using social media platforms and their
own surveys to overcome the absence of a credible
measurement system. In order to overcome issues in
measuring listenership, MRUC in association with AROI
is inviting proposals to form an independent body that
will measure listenership in the top few markets. Initially
the plan is to cover 21 markets and the methodology
for research will be similar to what IRS uses now.
16. http://pib.nic.in/newsite/PrintRelease.aspx?relid=187301
17. Industry discussions
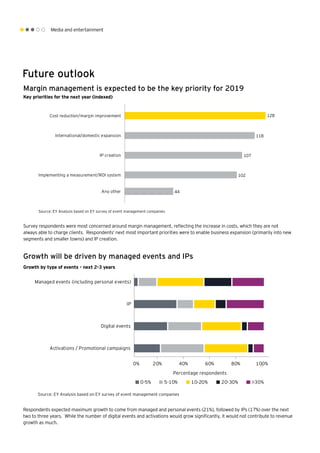
Future outlook
Growth will accelerate in 2019
Ad spends in the upcoming general and state
elections, non-FCT revenues and firming of ad rates
in regional markets will fuel growth in 2019.
Radio brands will be leveraged more
Radio will enable more growth through brand
leverage, across concerts, branded content, digital
content and delivery, events and activations,
podcasts, etc. The industry would drive up to 20%17
of topline from non-FCT revenues by 2021.
Radio and audio streaming will
increase collaboration
Radio companies will focus on building communities on
[radio + digital] media, to understand consumers better,
end enable brands to connect with their audiences directly.
Combinations between radio players and streaming apps will
be tried to increase fill rates on streaming audio platforms
and sell segmented audiences to advertisers. There will
be an increase in multi-media offerings to advertisers.
News was finally permitted on
private FM, but with heavy caveats
Private FM was finally permitted to air news, but only in
the form or replays of news broadcasts created by Prasar
Bharti, without any modifications16
. No such restrictions
exist on other media like television, digital or print in India.](https://image.slidesharecdn.com/ey-a-billion-screens-of-opportunity-190312110559/85/Ey-a-billion-screens-of-opportunity-195-320.jpg)


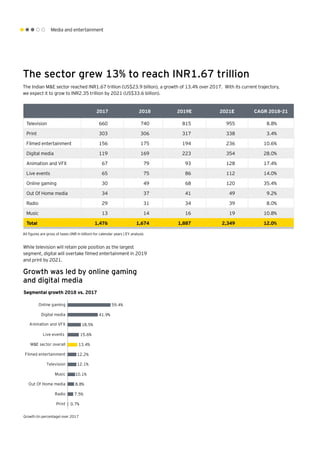
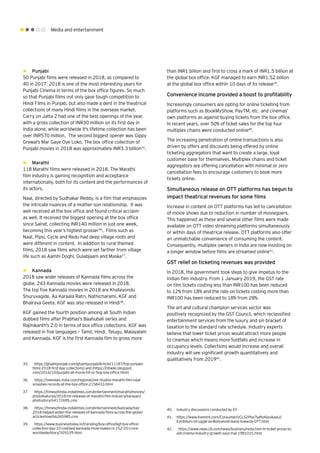
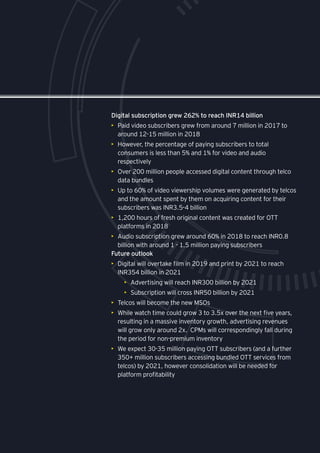
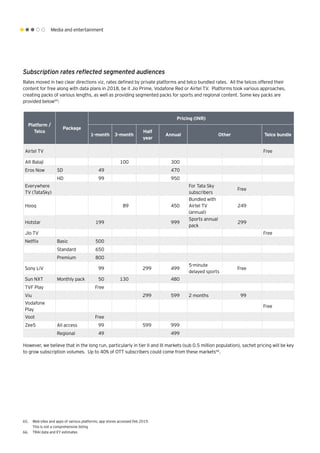
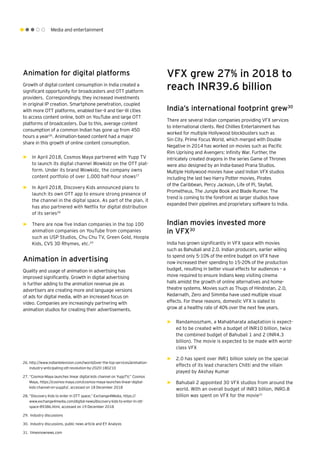
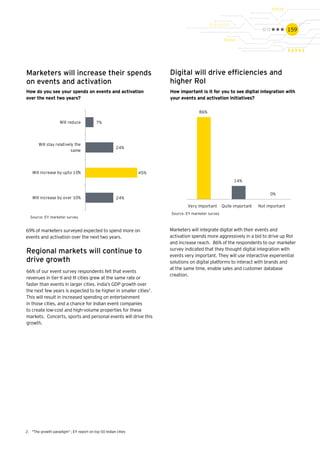
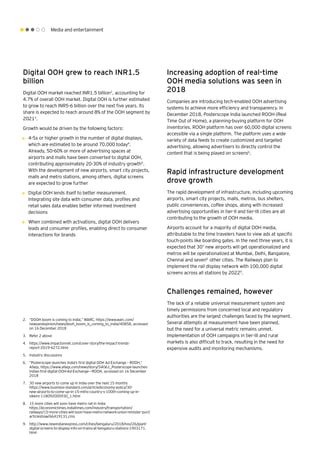
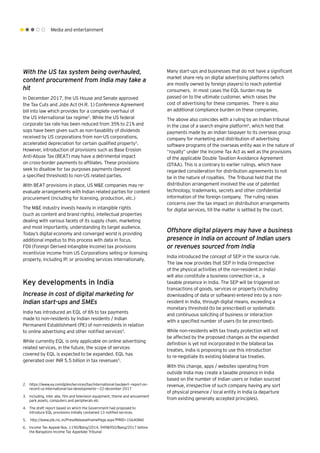
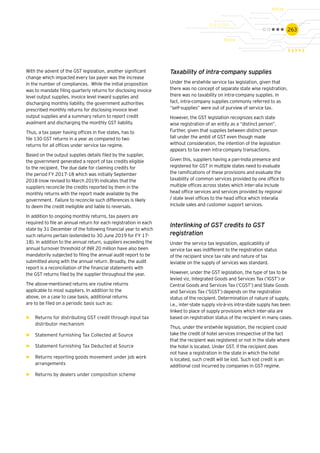
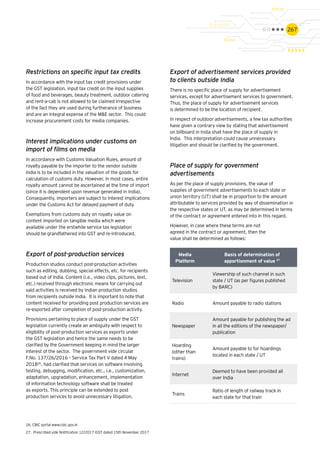
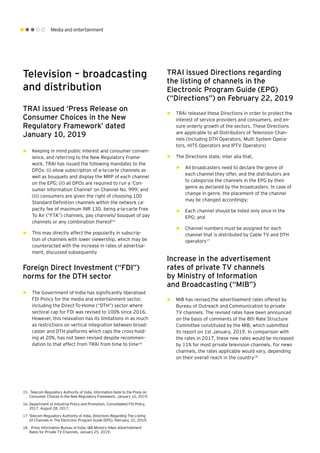
![Expert
speak
The unique ability of radio to seamlessly integrate with
emerging digital platforms has driven innovative and path
breaking programming in radio content. Brands have
recognized the potential of radio by using it along with
other mediums like TV and print. Owing to the change in
consumption patterns and growing GDP as compared to last
year, radio will certainly witness a double digit growth.
Ashit Kukian
CEO, Radio City
In 2019, the radio segment will emerge as a much stronger
medium. Radio is constantly innovating and integrating
its content with digital. The sector needs to change the way
it sells and [radio plus digital] is a potent combination for
advertisers.
Nisha Narayanan
COO & Director, Red FM
I am confident FM radio will the fastest growing traditional
media in the years to come. Radio brands will also diversify
and become multi media content producers, reaching
audiences through radio, video, SM all.
Prashant Panday
Managing Director & CEO, Entertainment Network
(India) Ltd.
M&A will be the only way to ensure double digit topline
and EBITDA growth in a tough media market overall. In
the absence of new licenses, radio players will enter digital
music streaming to improve reach.
Vineet Hukmani
MD and CEO, Radio One](https://image.slidesharecdn.com/ey-a-billion-screens-of-opportunity-190312110559/85/Ey-a-billion-screens-of-opportunity-200-320.jpg)


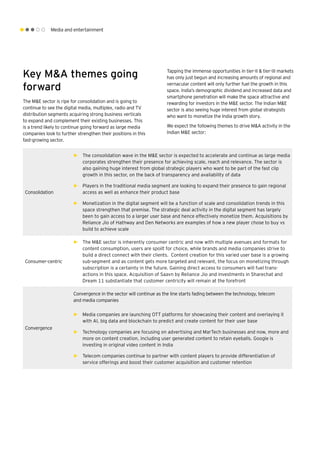


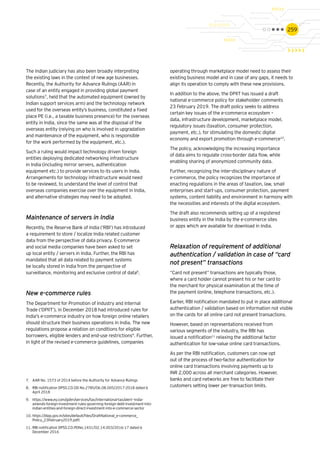

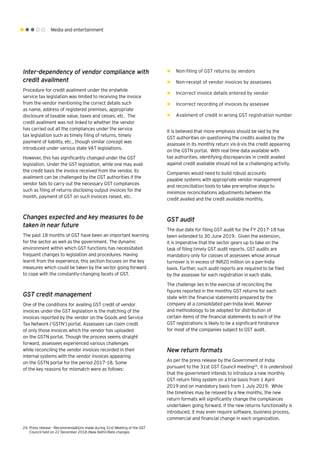
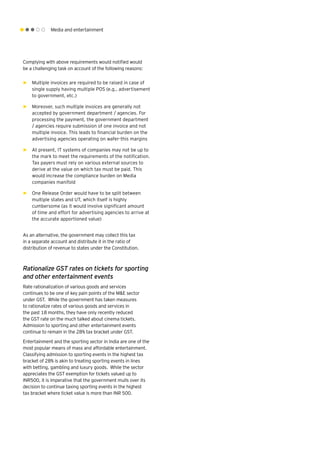


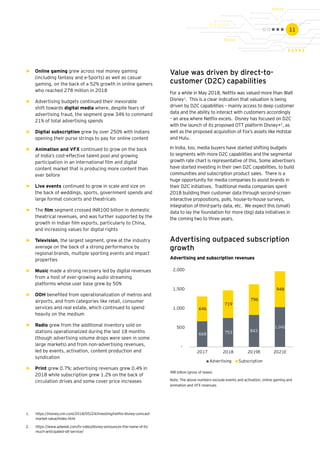
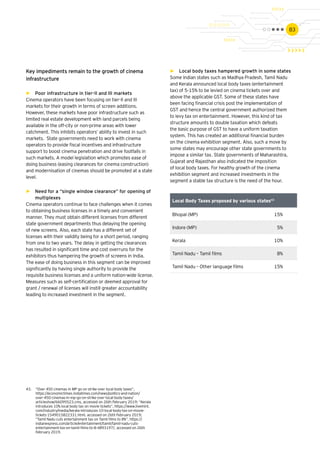
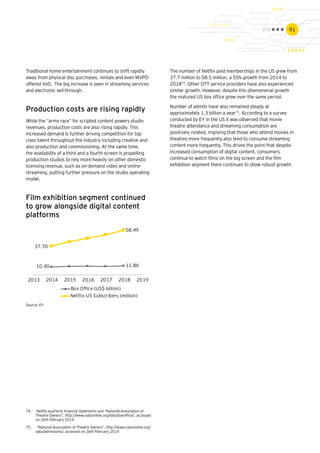
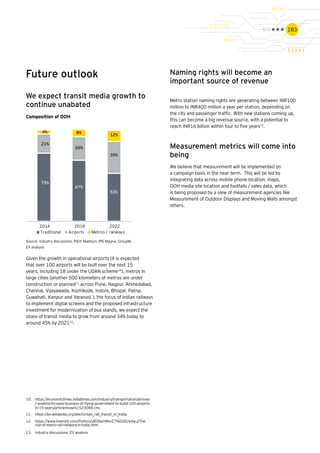
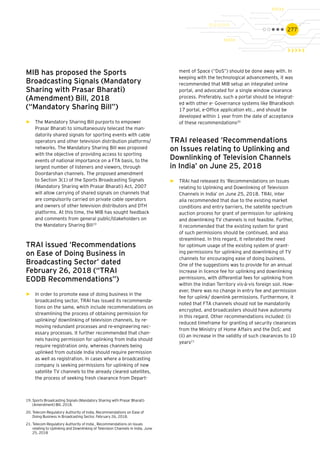
![Media and entertainment
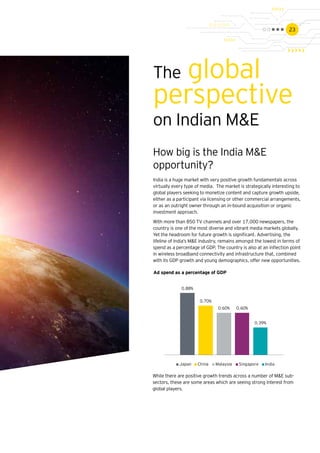
Recent major develop-
ments in the M&E sector
Privacy and Data Protection
2018 has been a watershed year for privacy and data
protection jurisprudence in India. A summary of the
recent key developments in this space is provided below.
Right to Privacy Judgement
In Justice K S Puttaswamy (Retd.) & Anr. v. Union of India &
Ors., dated August 24, 2017 (“Right to Privacy Judgment”)
a Constitution Bench comprising of nine judges of the
Supreme Court of India (“SC”) unanimously upheld the
right to privacy as a fundamental right guaranteed under
Part III of the Constitution of India (“Constitution”).
Perhaps more importantly, the SC ruled that informational
privacy forms part of the right to privacy, confirmed that it
was a horizontal right (i.e., a right capable of being applied
against private persons) and required the formulation of
comprehensive legislation to protect rights of individuals1
.
Justice Srikrishna Committee on Personal
Data Protection
The Ministry of Electronics and Information Technology
(“MEITY”) constituted a Committee of Experts on July 31,
2017 under the Chairmanship of Justice B.N. Srikrishna
(Retd.) (“Committee”) to recommend a data protection
framework in India, and propose a draft data protection
bill. Pursuant to its mandate, the Committee released the
draft of the Personal Data Protection Bill, 2018 (“PDP
Bill”) along with its corresponding report in July 2018.
The PDP Bill requires that all data fiduciaries (entities
responsible for determining the purpose of processing of
data), process personal data of individuals in a fair and
reasonable manner, respecting the privacy of the individual,
and only for lawful specific purposes. Further, personal
data is permitted to be collected and stored only to the
extent, and for the period, necessary to fulfill the purpose
of its collection. Additionally, the PDP Bill prescribes the
implementation of ‘privacy by design’ that is every data
fiduciary will have to design their information technology
architecture and processes in a manner that will anticipate
and avoid harm to the data principal. Interestingly, the
PDP Bill has defined a ‘child’ to mean any data principal
who is below the age of eighteen years. This is significant
as the PDP Bill provides for the classification of data
fiduciaries whose websites or services are directed at
children or those data fiduciaries who process large
volumes of personal data of children as ‘guardian data
fiduciaries’, and prohibits them from profiling, tracking,
monitoring of, or targeting advertising at, children.
The PDP Bill also contemplates the creation of a sector
agnostic regulator called the Data Protection Authority of
India with wide powers of monitoring and enforcement,
standard setting, grievance redressal and adjudication.
While personal data may be transferred outside India
under specific conditions, a live, mirror copy of the data
must be stored within India. Moreover, the PDP Bill also
provides that ‘critical personal data’ (to be notified by
the Central Government) must only be stored in India.
Aadhaar Judgement
The SC pronounced its judgement on the Aadhaar
(Targeted Delivery of Financial and Other Subsidies,
Benefits and Services) Act, 2016 (“Aadhaar Act”) on in
Justice K S Puttaswamy (Retd.) & Anr. v. Union of India &
Ors., dated September 26, 2018 (“Aadhaar Judgement”)2
which has a significant impact on privacy law in India.
The judgment has far reaching consequences for businesses
(especially those that are mandated to undertake KYC
under applicable law), as it read down Section 57 of the
Aadhaar Act and therefore, removed the ability of companies
and individuals to seek to authenticate the identity of
personnel on the basis of contractual provisions. However,
the Court left intact the portion of Section 57 which
enables the collection of Aadhaar information to establish
the identity of a person for a purpose backed by a law.
Intermediary Guidelines
MEITY released the draft Information Technology
[Intermediaries Guidelines (Amendment) Rules], 2018
(“Draft Rules”) on December 24, 2018, under Section 79
of the Information Technology Act, 2000 (“IT Act”) for
public consultation and feedback. The Draft Rules propose
an entity localization requirement for all intermediaries with
above five million users and entities specifically notified
by the Government. Accordingly, intermediaries who fall
within the criteria outlined above will now need to comply
with all relevant statutory obligations, such as inter alia,
regulatory compliance and filings under the Companies Act
and labour law compliances. Crucially, this will also trigger
attendant tax obligations because such incorporation will
create a ‘permanent establishment’ for the purposes of
taxation. Furthermore, the Draft Rules would also require
intermediaries to deploy technology based automated tools
or appropriate mechanisms, with appropriate controls,
for proactively identifying and removing or disabling
public access to unlawful information or content.
1. Justice K S Puttaswamy (Retd.) & Anr. v. Union of India & Ors., (2017) 10
SCC 1.
2. Writ Petition (Civil) No. 494 of 2012.](https://image.slidesharecdn.com/ey-a-billion-screens-of-opportunity-190312110559/85/Ey-a-billion-screens-of-opportunity-272-320.jpg)


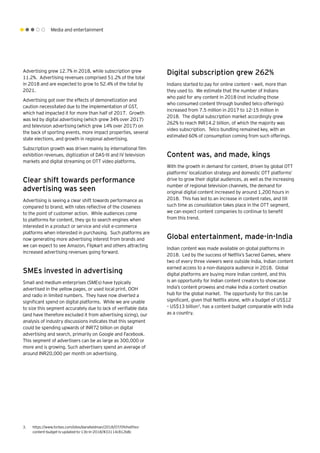
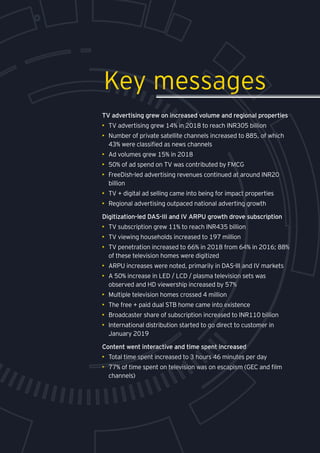
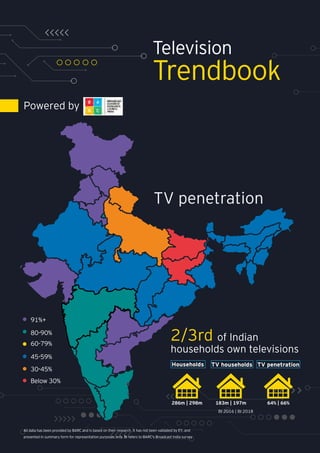
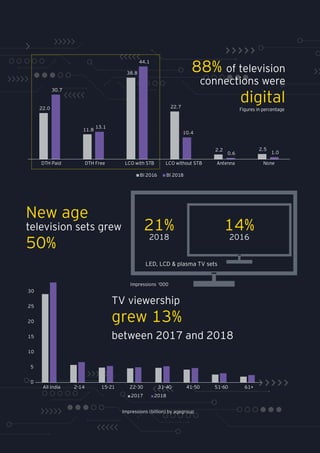
The media and entertainment sector in India grew 13.4% in 2018 to reach INR1.67 trillion. Digital media saw the highest growth of 59.4% followed by online gaming which grew 41.9%. Advertising grew faster than subscription with advertising growing 12.7% and subscription growing 11.2%. Digital subscription grew significantly by 262% as more Indians started paying for online content. The demand for original digital content also increased. Traditional sectors like television and films grew around the industry average. Overall, the sector continued to outperform India's nominal GDP growth.